AMD Radeon RX 460 Review
Frequency, Temperature & Noise Results
GPU Boost Clock Rates & Voltages
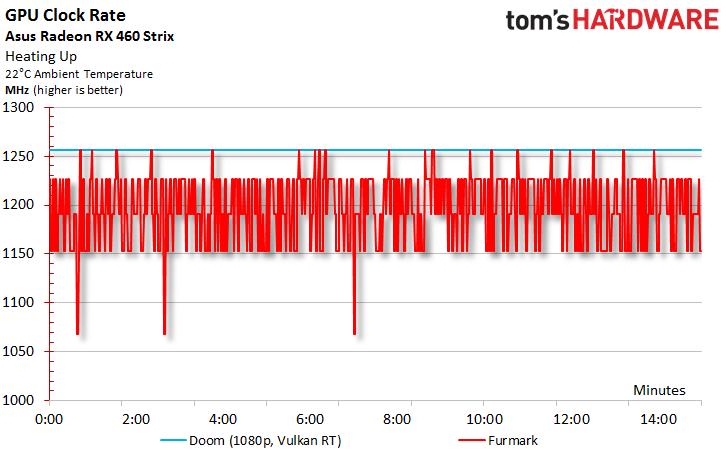
Let’s first take a look at boost clock rates in our Doom benchmark. These are the frequencies that Asus' Strix RX 460 achieves after warming up. A stable 1256 MHz without any fluctuations is evidence of the factory-overclocked graphics card’s higher power limit. Our Sapphire Nitro Radeon RX 460 OC performs similarly, maintaining 1250 MHz. There should be ample room left for additional overclocking on both cards, especially in light of the relatively low GPU temperatures reported at the bottom of this page.
This changes dramatically under full load, where large fluctuations are observed. An additional 15W are enough to send the Strix RX 460 headlong into its power limit. The result is illustrated in the chart above.
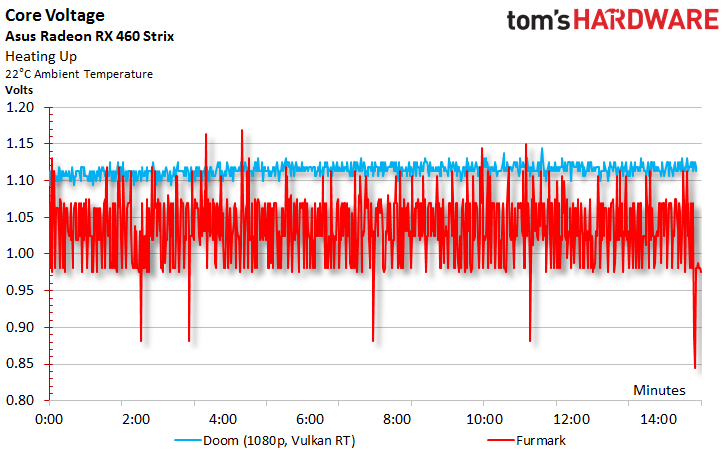
The voltage curve looks similar. During our gaming loop, Asus' Strix RX 460 peaks at 1.14V (we calculated the average at 1.125V with minimal fluctuations). During the stress test, though, those fluctuations become much more significant. Once again, the culprit is the card’s power limit.
Temperatures
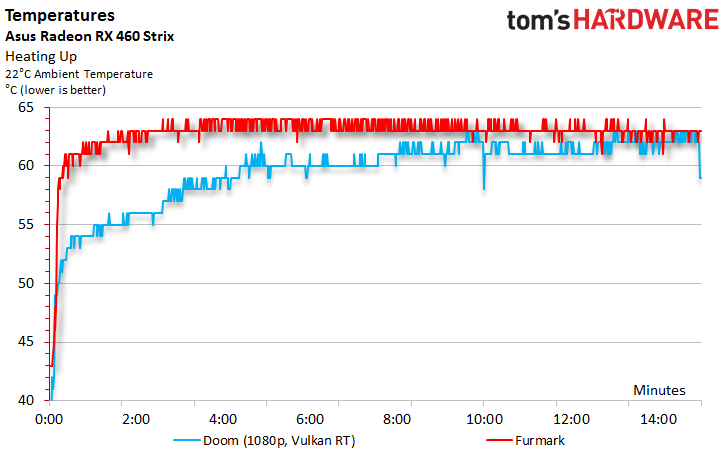
Asus cools Polaris 11 well. The Strix RX 460 posts 64°C during both the gaming loop and stress test, which increases to 66°C and 67°C, respectively, when we place the platform in a closed PC case. There's really nothing to complain about as far as the GPU is concerned.
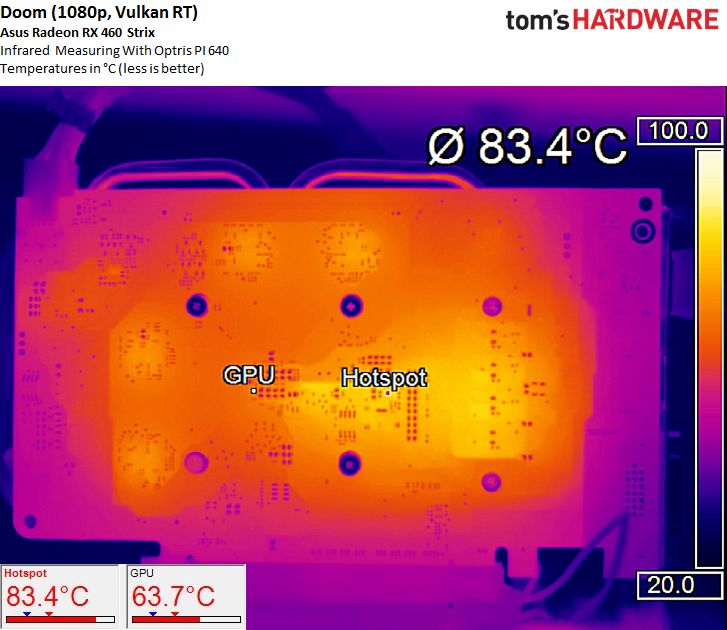
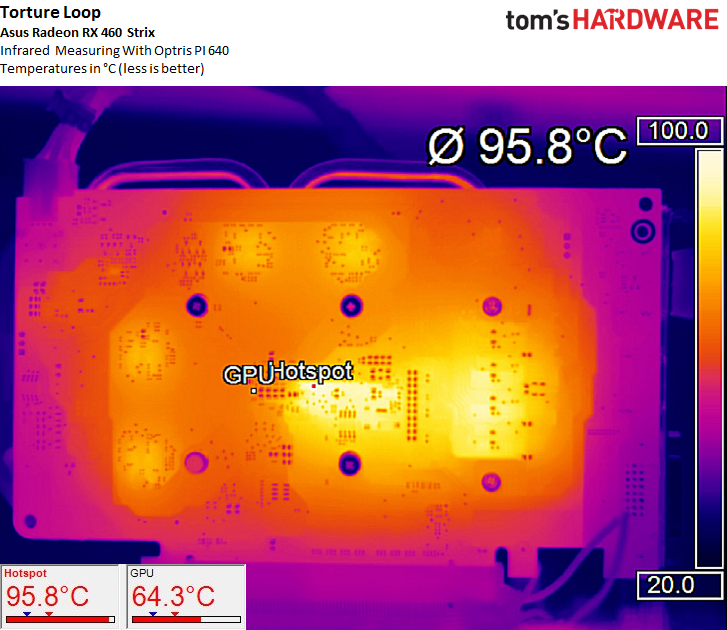
The infrared picture shows that the temperature under the GPU's package is in line with the processor's internal sensor. Elsewhere, there's an 83.4°C hotspot on top of a small component located between the GPU and voltage converters, above the power supply circuits.
Cranking up the load pushes the hotspot toward Polaris 11. It’s definitely not located below the voltage converters. It's hard to attribute those higher temperatures to 15W of additional waste heat alone. It's time for a closer look.
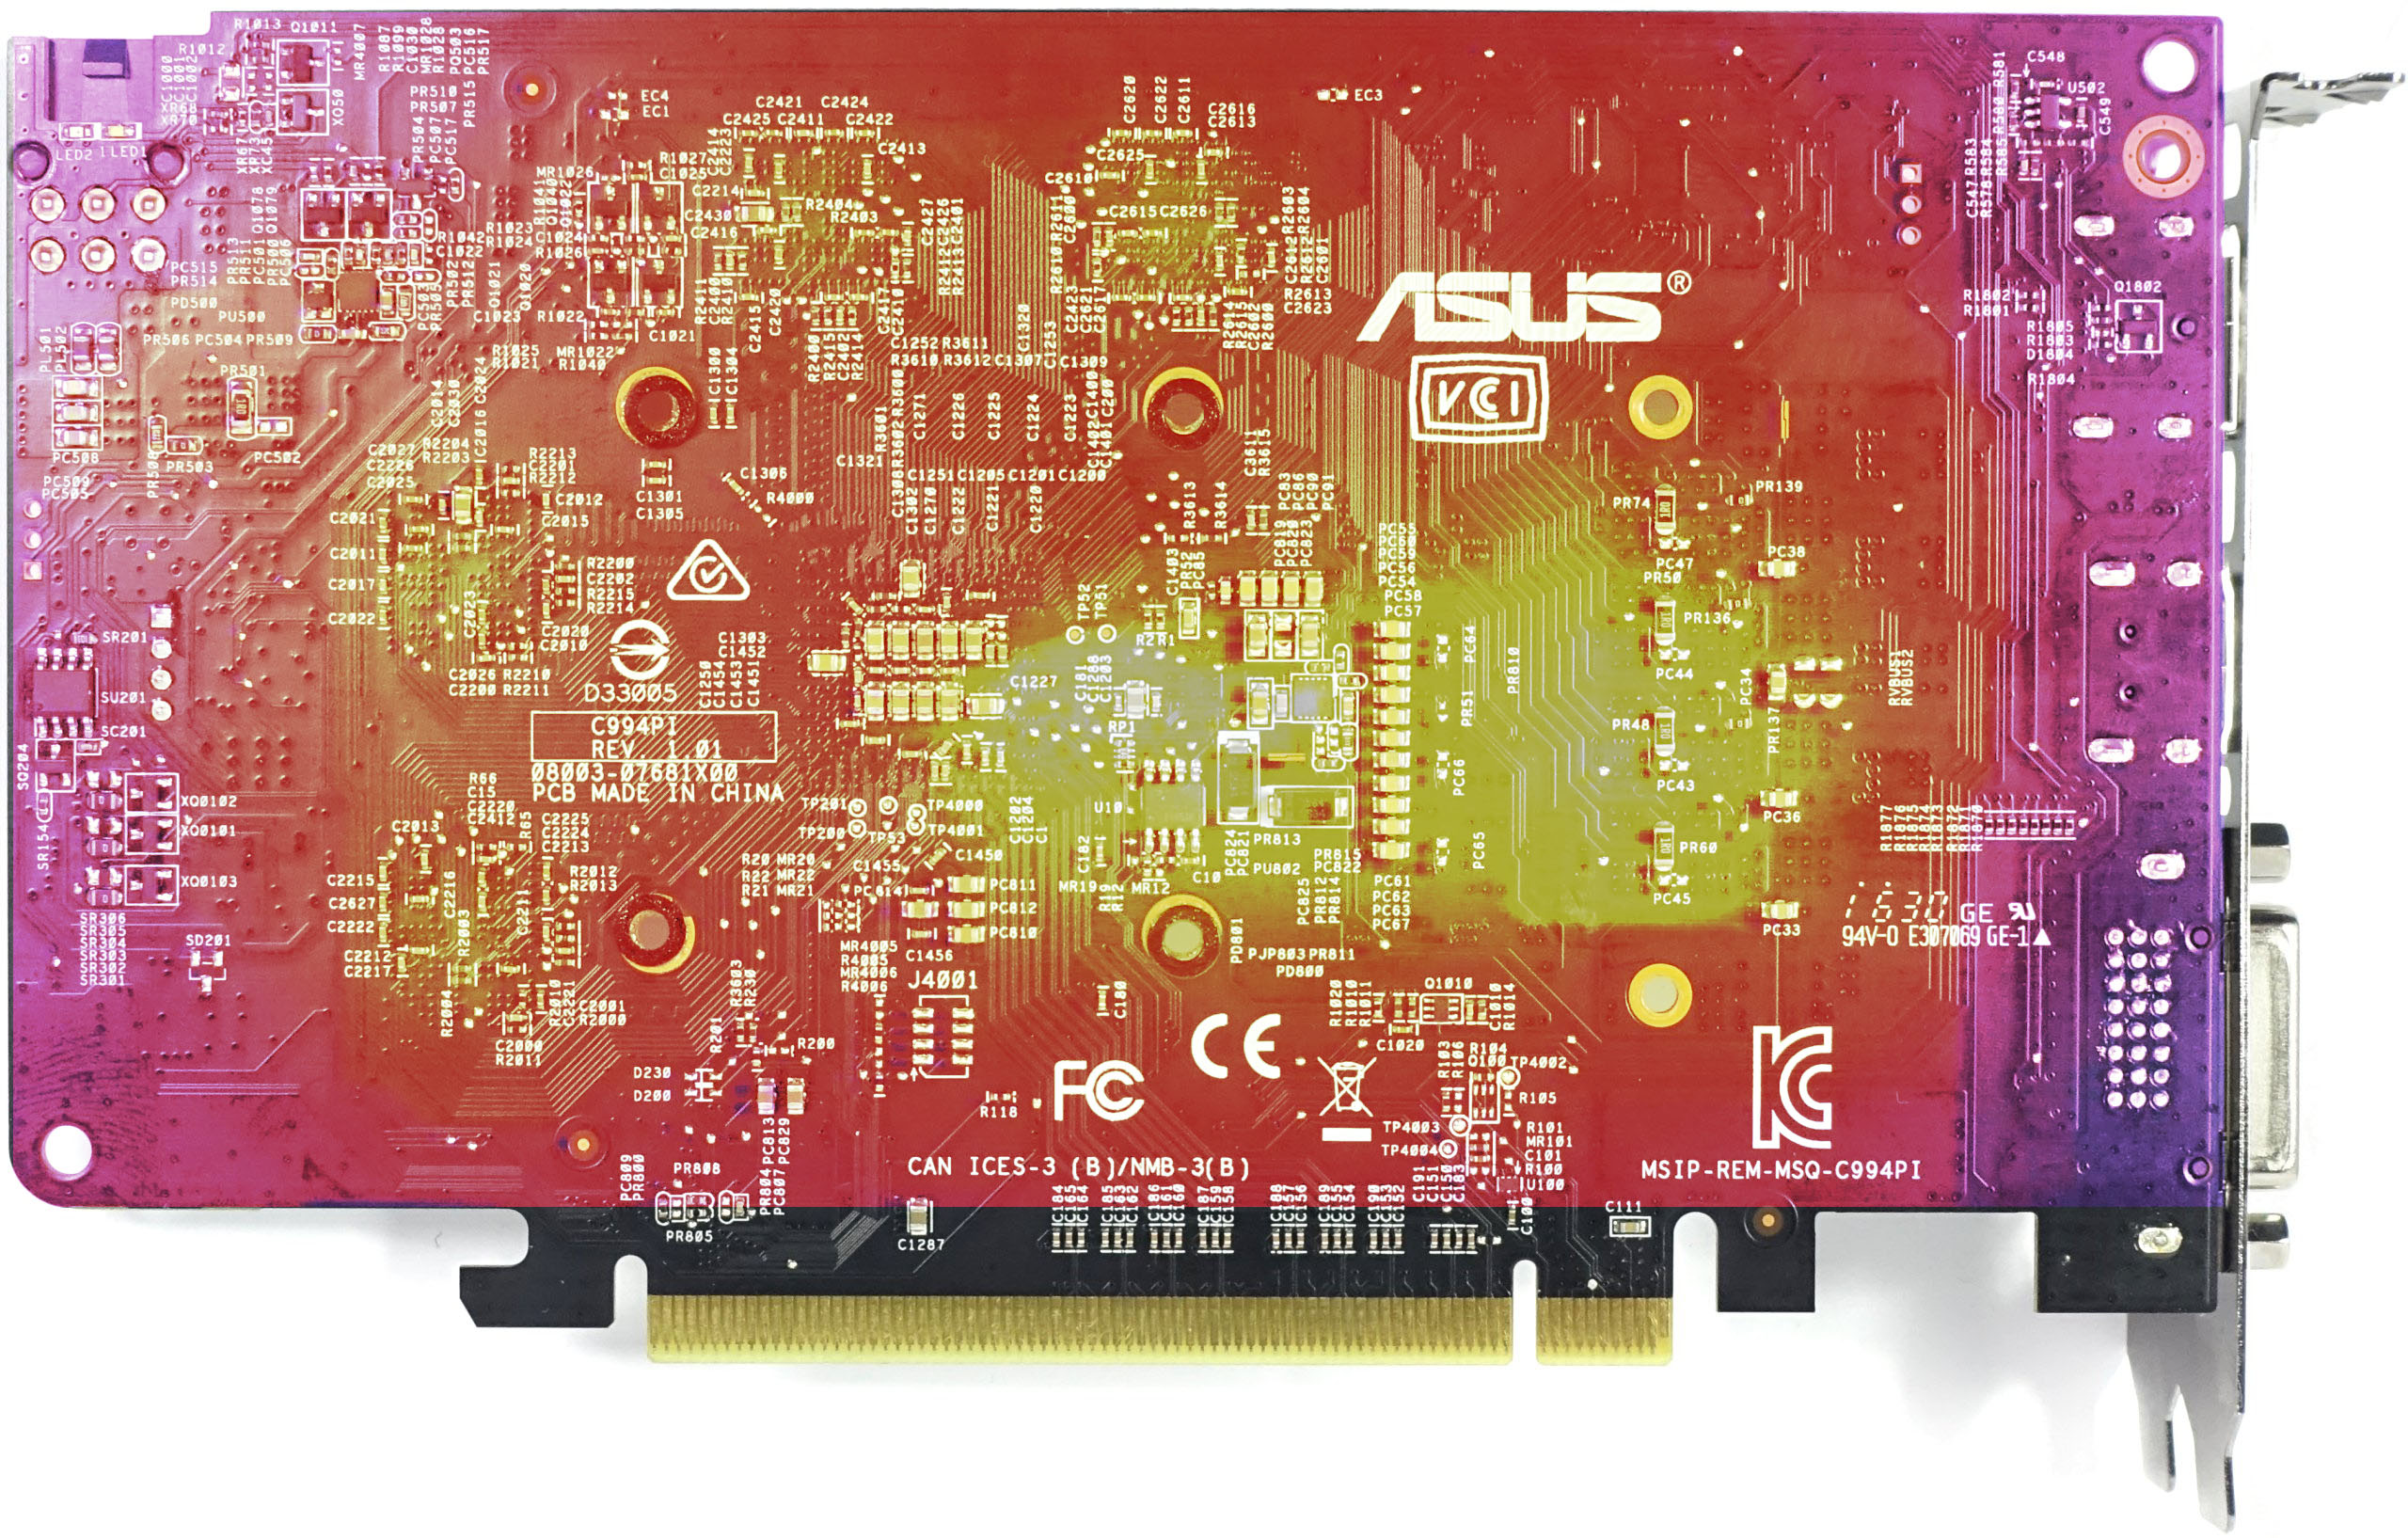
To get to the bottom of this, we’re using an overlay view by superimposing the infrared picture onto the back of Asus' Strix RX 460. Several shunts appear to amplify the hotspot. Fortunately, our peak readings are in a non-critical range. But this part of the board's layout wasn't designed very well, as the GPU heats up from below, through its package. Over time, this leads to higher fan speeds since Asus chose a target temperature of 65°C that it enforces aggressively.
Get Tom's Hardware's best news and in-depth reviews, straight to your inbox.
Fan Curves & Noise
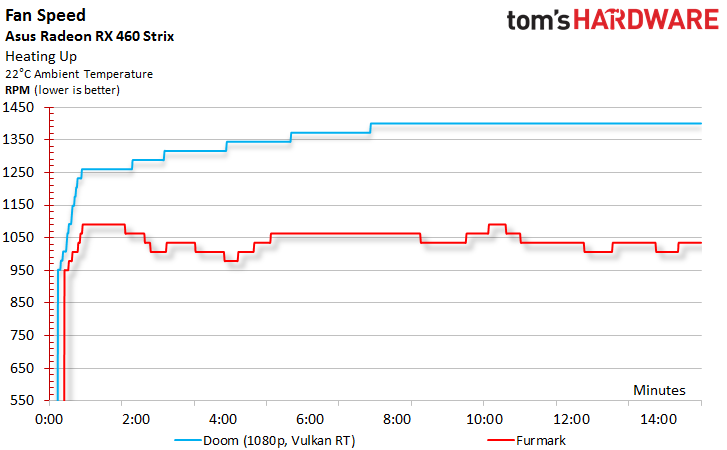
We applied a filter to the fan speed results as well, which makes for a smoother curve that’s easier to interpret. In this case, the curve corresponds well to the percentage set by the PWM controller. It steps in aggressively during gaming workloads, but shows restraint during the stress test. This explains the significantly higher board temperature we couldn't pin on an additional 15W.
A high fan speed is a big price to pay for the relatively low 64°C maximum temperature. Then again, fan blades spinning quickly generate a lot of air turbulence, which gets us wondering what this card's acoustic profile looks like.
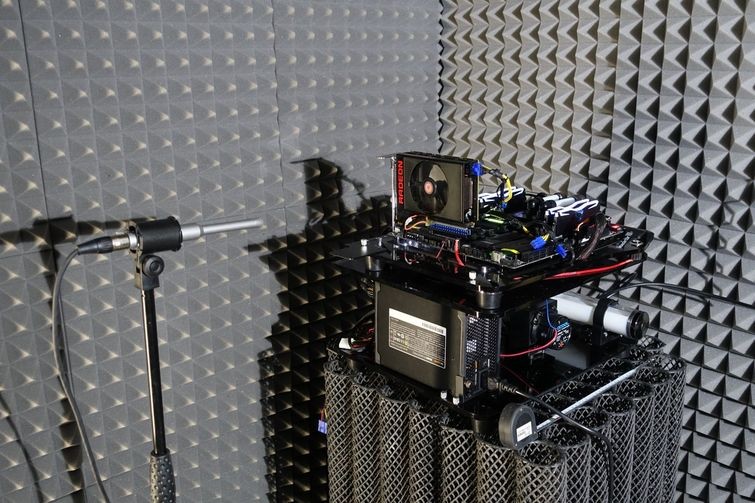
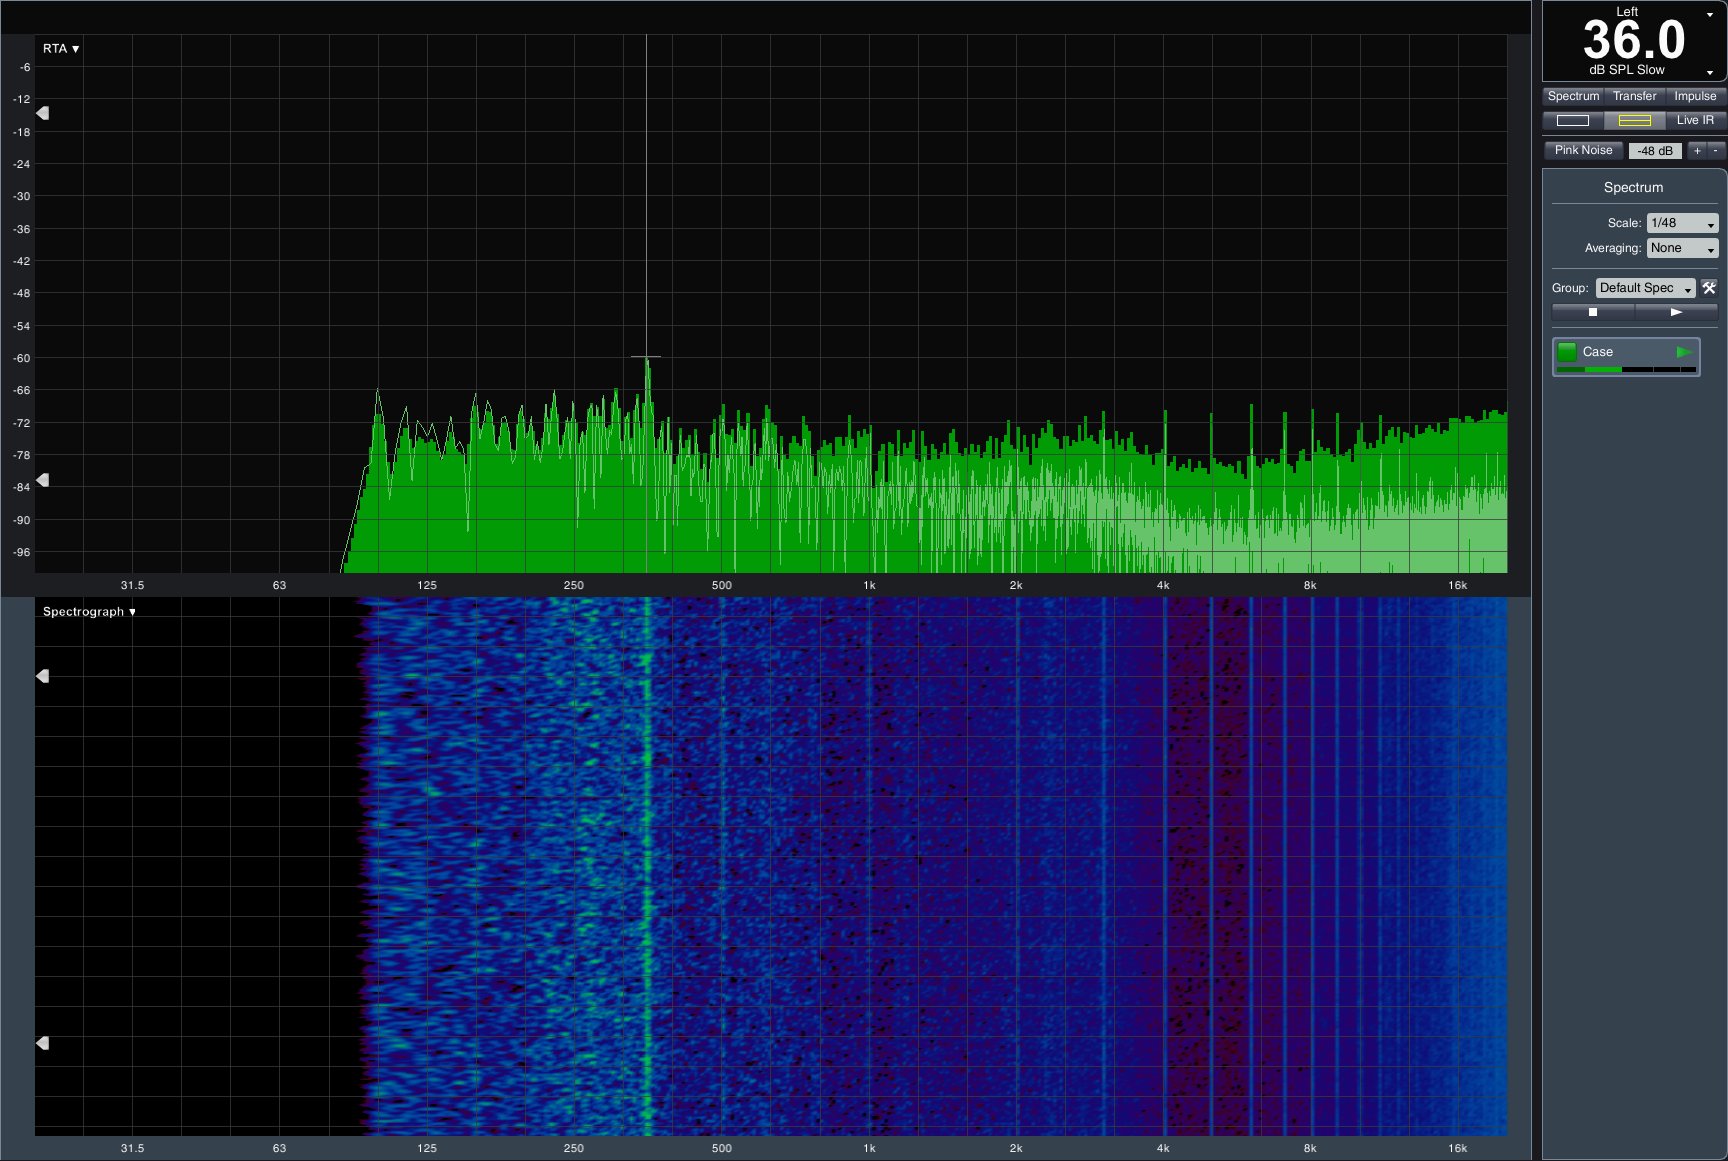
As usual, the noise measurements are performed using our silent water-cooled PC in our sound-dampened anechoic chamber built for just this purpose. The setup's practical lower limit is 22 dB(A) due to the measurement system's hardware.
| Test System And Equipment | |
|---|---|
| Microphone | NTI Audio M2211 (with Calibration File, Low Cut at 50 Hz) |
| Amplifier | Steinberg UR12 (with Phantom Power for Microphones) |
| System | Graphics Card Test System with Optimized Water Cooling - Intel Core i7-5930K @ 4.2 GHz, Water-Cooled - Crucial Ballistix Sport, 4x 4GB DDR4-2400 - MSI X99S XPower AC - 1x Crucial MX200, 500GB SSD (System) - 1x Corsair Force LS, 960GB SSD (Applications, Data) - be quiet! Dark Power Pro, 850W Power Supply Unit (PSU) |
| Water Cooling | - Alphacool VPP655 Pump (Undervolted) - Alphacool NexXxos CPU Cooler - Phobya Balancer - Alphacool 24cm Radiator - 2x 12cm Noiseblocker eLoop Fan @ 400 RPM |
| Software | Smaart v.7 |
| Measurement Chamber | Custom-Made Proprietary Measurement Chamber, 3.5 x 1.8 x 2.2m (LxDxH) |
| Measurement Position | Perpendicular to Center of Noise Source(s), Measurement Distance of 50cm |
| Measurement Data | - Noise Level in dB(A) (Slow), Real-time Frequency Analyzer (RTA) - Graphical Frequency Spectrum of Noise |
The Strix RX 460's 36 dB(A) reading is an improvement compared to what we measured from Asus' Strix RX 470. The outcome is solid overall.
There’s room for a custom fan curve, especially during cooler months. If you live in a warmer climate, it be necessary to leave Asus' default in place. Fortunately, that's not a big deal in this case.
MORE: Best Graphics Cards
MORE: Desktop GPU Performance Hierarchy Table
MORE: All Graphics Content
Current page: Frequency, Temperature & Noise Results
Prev Page Power Consumption Results Next Page Conclusion-
gdmaclew Just curious as to why you are showing a link to Newegg for the AMD FX-8370 at $169.99? The actual price for that CPU at Newegg has been $189.99 for the past week.Reply
Edit: Should have thanked the authors for their excellent review first. Well done.
-
AndrewJacksonZA Thanks for the review Chris and Igor, I've been waiting for this one! Nicely structured, logical, easy to follow. :-)Reply
I agree with your conclusion: I've been looking for a replacement for my 6670 1GB DDR3 that I picked up in 2012 for $65 and this looks good. I was, however, expecting to see a MSRP of between $85 and $100.
Thanks again,
Andrew -
CaptainTom CURB STOMP!Reply
Very relieved this performed better than those leaked benchmarks. So it is indeed a 70w 7870 for $110.
The are already sold out btw lol -
turkey3_scratch The only one available is a Sapphire RX 460 and it is $170 on Amazon (it's also on Newegg but is sold out). So the RX 460 is being priced what the RX 470 was supposed to be. And the RX 470 is being priced what the RX 480 was supposed to be.Reply
Am I the only one having trouble figuring out where this sits performance-wise? It seems to be all over the place from game to game. CaptainTom, not sold out yet, 12 in stock https://www.amazon.com/Sapphire-Radeon-NITRO-Graphics-11257-02-20G/dp/B01J1M4HDS/ref=sr_1_2?ie=UTF8&qid=1470662745&sr=8-2&keywords=rx+460
Also, these Asus coolers suck. I'm definitely not going to be recommending any Asus card this generation. -
rush21hit This is it. For an entry-level and low powered $100 card at this caliber nVidia can't touch this. This is the winning chip.Reply
If there will ever be cutdown 1060 with 3B as planned, knowing nVidia, it won't even come near this price. -
AndrewJacksonZA Reply
I think that there's one very big thing that the RX 460 has in it's favour over it's older brethren: the new APIs.18404296 said:Am I the only one having trouble figuring out where this site performance-wise? -
turkey3_scratch Reply18404342 said:This is it. For an entry-level and low powered $100 card at this caliber nVidia can't touch this. This is the winning chip.
If there will ever be cutdown 1060 with 3B as planned, knowing nVidia, it won't even come near this price.
The 1060 is whoppingly better. Why would it ever come to this price? Pinch me also if you honestly see an RX 460 for $110. -
AndrewJacksonZA Reply
I think rush21hit was talking about the rumoured 3GB 1060 which was supposed to be "severely cut down," to put it mildly, not the real, actual 1060 which is in a whole different class. One can almost buy 3x 460s for 1x 1060.18404369 said:18404342 said:This is it. For an entry-level and low powered $100 card at this caliber nVidia can't touch this. This is the winning chip.
If there will ever be cutdown 1060 with 3B as planned, knowing nVidia, it won't even come near this price.
The 1060 is whoppingly better. Why would it ever come to this price? Pinch me also if you honestly see an RX 460 for $110.
Having said that... Let's just wait for the 1050 and 1040 to drop before we declare an absolute winner in this price segment, shall we? But right now, you are correct rush21hit, Nvidia has nothing to compete in this price range. I look forward to seeing the changed Best Graphics Cards for the Money article. ;-)
