
Why you can trust Tom's Hardware Our expert reviewers spend hours testing and comparing products and services so you can choose the best for you. Find out more about how we test.

We measure real-world power consumption using Powenetics testing hardware and software. We capture in-line GPU power consumption by collecting data while looping Metro Exodus (the original, not the enhanced version) and while running the FurMark stress test. Our test PC remains the same old Core i9-9900K as we've used previously, to keep results consistent.
Note that we have additional power data from Nvidia's PCAT v2. However, we haven't fully converted to using our new test PCs and PCAT for everything, so we also gathered power data using our existing methodology.
For the RX 7900 cards, we ran Metro at 3840x2160 using the Extreme preset (no ray tracing), and we ran FurMark at 2560x1440. The following charts are intended to represent something of a worst-case scenario for power consumption, temps, etc.
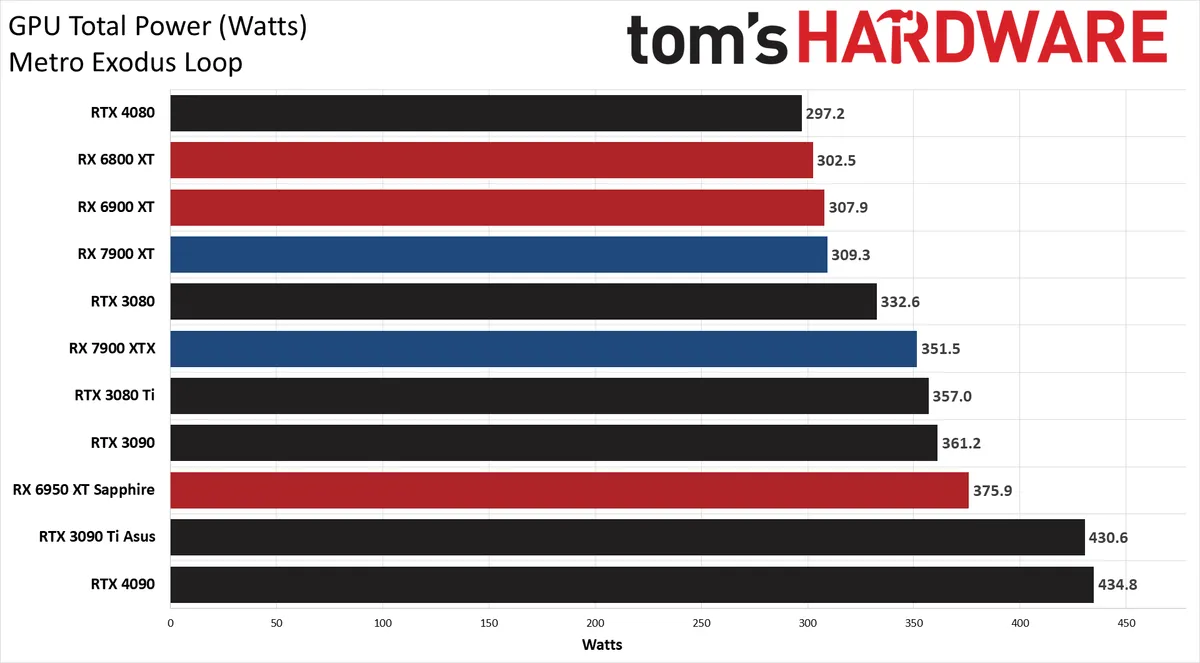


AMD bumped up the TBP on the 7900 XT to 315W instead of the original 300W, and in FurMark we actually just barely exceeded that mark — and the same goes for the RX 7900 XTX, which hit 366W. Our Metro Exodus power tests both end up around 5W lower than the rated TBP, but it's worth noting that in other gaming tests, particularly at 1080p, power use can be quite a bit lower (see below).
Clock speeds on both cards landed above the 2.5 GHz mark while gaming, though as you'd expect, the clocks were quite a bit lower in FurMark. In fact, in FurMark it looks like AMD's new cards throttle more than just about any other GPU we've tested recently. That's not a huge issue, as FurMark represents an atypical "worst-case" workload — though that could change in the future.
GPU temperatures remained below 70C in all of our testing, with fan speeds south of 2,000 RPM. The fan speed and temperature results also line up with what we experienced in regular use, as the XTX card has a larger and more potent cooling subsystem and often runs noticeably quieter than the XT model.

Of course, that doesn't always happen. Running Metro Exodus for 30 minutes, the XTX card eventually settled in at 49.9 dB(A) while the 7900 XT was a bit quieter with 48.7 dB(A). AMD's reference designs are pretty good overall, and we like the way they look, but they're definitely not among the quietest graphics cards we've tested.
Full Suite FrameView and PCAT Testing Results
Besides our Powenetics testing, we collect all of our frametime data using Nvidia's FrameView, which also logs clock speeds, temperatures, power, and GPU utilization (and plenty of other data as well). We've verified with our Powenetics equipment that Nvidia's PCAT results are close enough that we have no problem using PCAT going forward, as the results were within 1W of each other.
Below, we have the summarized test results from all 15 games, and we've calculated performance per watt for the main six GPUs from our testing: From AMD, we have the new RX 7900 XTX and RX 7900 XT, along with the previous generation RX 6950 XT; for Nvidia, we have the RTX 4090, RTX 4080, and the previous generation RTX 3090 Ti. Note that both the RX 6950 XT and RTX 3090 Ti use third party cards, the ASRock RX 6950 XT Formula and the Asus RTX 3090 Ti TUF Gaming OC.


For AMD's new GPUs, most of the games we tested came pretty close to 100% GPU utilization, and as such the power levels are pretty close to the rated TBP. Far Cry 6, Flight Simulator, and Minecraft weren't quite as high as the others, particularly at 1080p, but overall in real-world gaming tests, the results match up pretty closely with what we measured in our Powenetics testing.
It's interesting that AMD raised the TBP slightly on the 7900 XT, and that may account for its higher than expected clocks. At 1080p and 4K, the XT model averaged higher GPU core clocks than the XTX variant, even though the latter officially has a 100 MHz higher boost clock.
Looking at the overall performance per watt data from the six GPUs, it's also fun to see just how much things have improved. Both the RX 6950 XT and RTX 3090 Ti land at an average of 0.12 FPS/W at 4K. AMD's RX 7900 series bumps that to 0.16 FPS/W, a 33% improvement, and the 7900 XTX actually comes out ahead of the 7900 XT. But Nvidia's RTX 4080 and 4090 take the efficiency crown in this case, with 0.22 FPS/W at 4K, with the 4090 also just edging past the 4080.
And yes, looking at the overall result isn't always the best solution, which is why we provided the full tables above. Looking just at Borderlands 3 4K, for example, which lands close to the GPUs' TBP for all six cards, the rankings shift a bit. The 6950 gets 0.23 FPS/W while the 7900 cards get 0.29 and 0.31 for the XT and XTX models — 26% and 35% better performance per watt in that case. Doing the same for Nvidia, the 3090 Ti gets 0.17 FPS/W, 4080 gets 0.29 FPS/W, and the 4090 gets 0.30 FPS/W. That's a 71% and 76% generational improvement, but here at least the AMD cards match Nvidia in relative efficiency. Of course, that's largely thanks to the removal of the ray tracing results.
- MORE: Best Graphics Cards
- MORE: GPU Benchmarks and Hierarchy
- MORE: All Graphics Content
