Why you can trust Tom's Hardware
Power Consumption
We used CPUz logging to measure the card’s power consumption with the Metro:Exodus benchmark running at 2560 x 1440 using the default Ultra settings. The tested card is warmed up prior to testing and started after settling to an idle temperature (after about 10 minutes). The benchmark is looped a total of five times, which yields around 10 minutes of testing. In the charts you will see a few blips in power use, which is a result of the benchmark starting the next loop.
We also use Furmark to capture worst-case power readings. Although both Nvidia and AMD consider the application to be a “power virus,” or program that deliberately taxes the components beyond normal limits, the data we can gather from it offers useful information about a card’s capabilities outside of typical gaming loads.
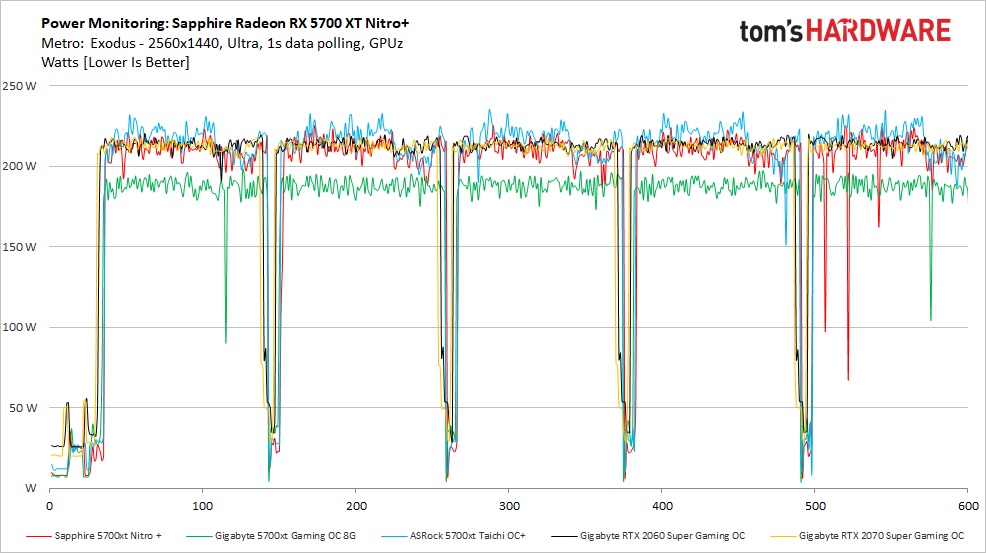
Looking at the gaming power draw, the ASRock Taichi X OC+ averaged 216W during the test. This draw is higher than the other 5700 XT’s found on the graph, where the Nitro+ averages 208W and the Gigabyte 186W. The difference here is mostly down to the ASRock’s higher clock speeds.
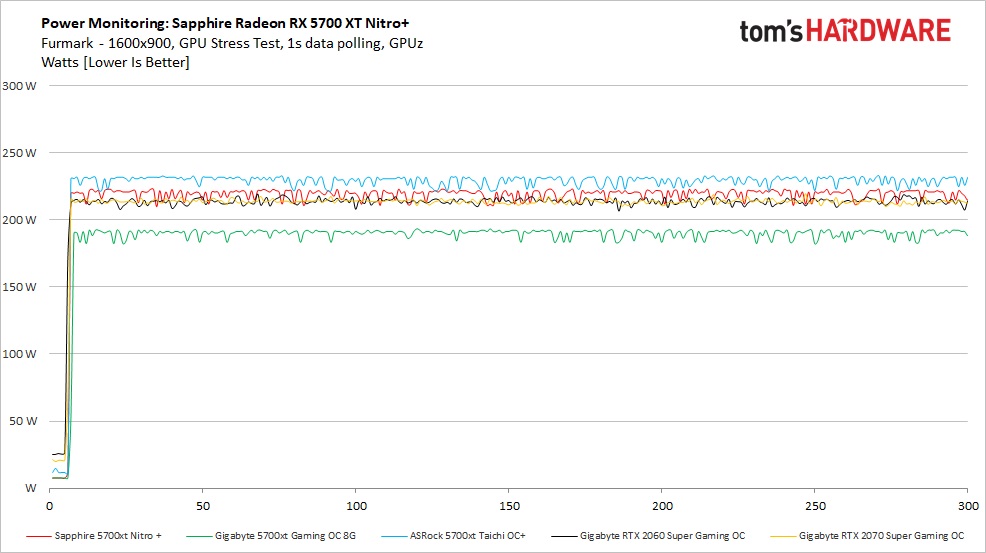
In analyzing the Furmark results, we again see the Taichi X OC+ using more power. In this case, it pulled an average of 226W with a peak of 232W. During this testing, the card hit its own power limit (230W) and throttled back to fit within that parameter, as did the rest. The other cards used less power, with the Nitro+ averaging 219W and the Gigabyte 189W. The limits of those cards are obviously set lower out of the box.
Temperatures, Fan Speeds and Clock Rates
In order to see how each video card behaves, like the power testing, we use GPUz logging in one second intervals to capture data. Game testing is done looping the Metro: Exodus benchmark five times at Ultra settings running at 2560x1440 resolution.
We also used Furmark to capture some of the data below, which offers a more consistent load and uses slightly more power, regardless of the fact that the clock speeds and voltages are limited. These data sets give insight into worst-case situations along with a load other than gaming.
Gaming
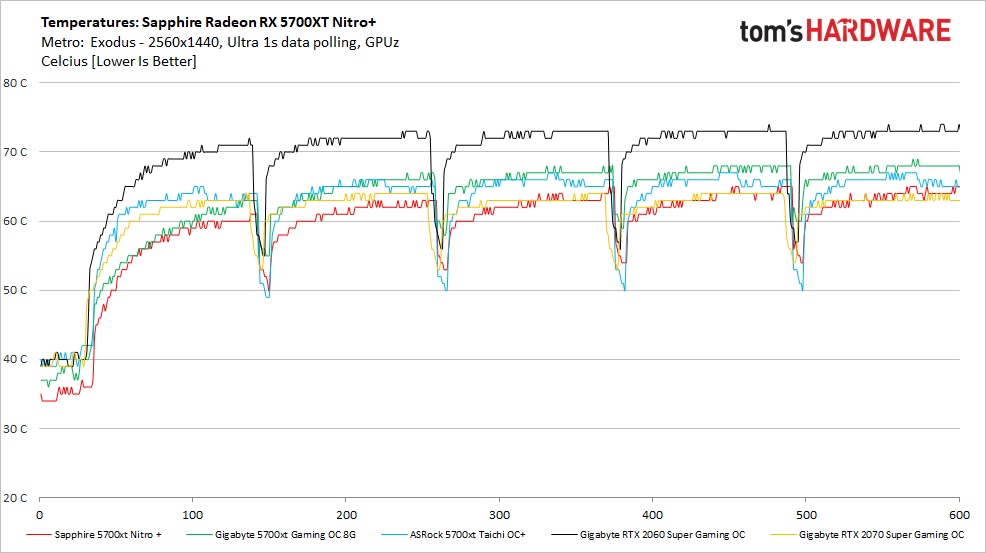
The ASRock Taichi X OC+ peaked at 67C during our testing, which falls in the middle of the three aftermarket 5700 XT’s. This temperature was reached using the OC BIOS and faster fan speeds. The Nitro+ was the coolest running here, peaking at 65C, while the Gigabyte and its Windforce 3 cooler peaked at 68C, the warmest of the bunch.
Get Tom's Hardware's best news and in-depth reviews, straight to your inbox.
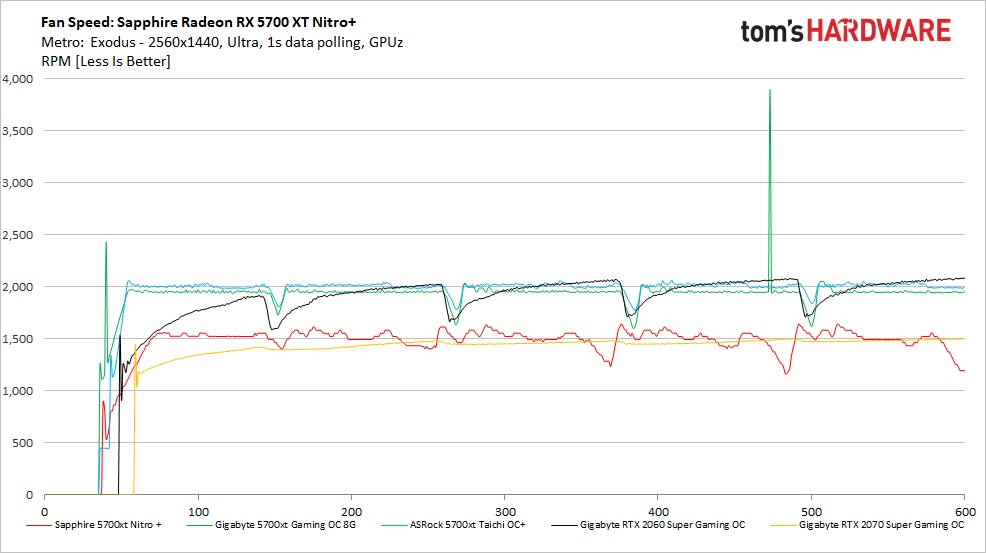
The ASRock’s Taichi’s Triple Fan setup has a zero fan feature where the fans remain off until a certain temperature has been met. For this test, like previously, we used to OC BIOS and higher fan speeds. Using this configuration, the Taichi spun up to 1,200 RPM to start and ended up at 2,000 RPM throughout the majority of testing. After getting up to speed, there was a very small fan speed variance, of approximately 50 RPM. When running the silent BIOS, the fans spin slower and are quiet. While in OC mode, the fans are audible, but not oppressive. And we didn’t notice any bothersome humming.
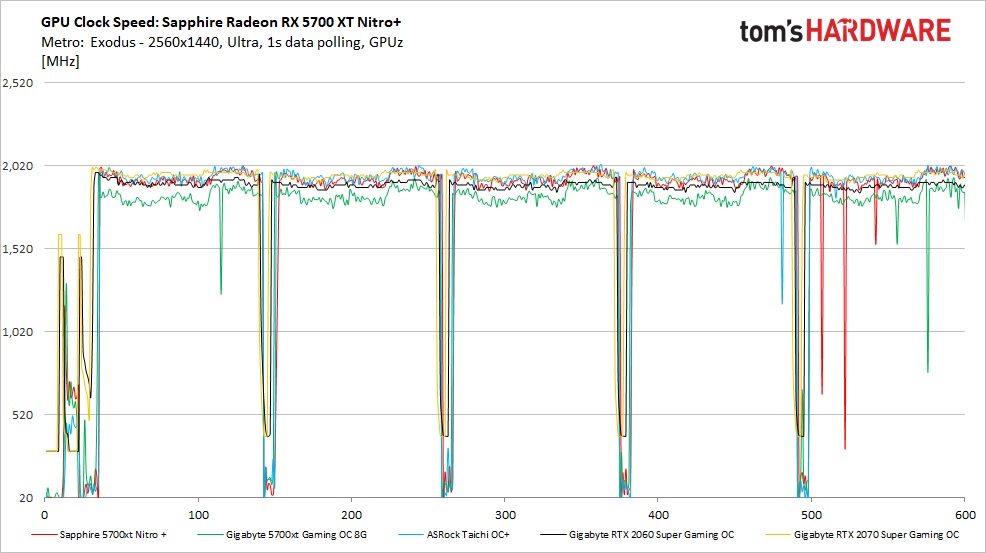
When we look at the clock rate response in gaming, the average for the Taichi card is 1,956 MHz when using the OC BIOS. This compares the the Nitro+ at 1,911 MHz and the Gigabyte card at 1,826 MHz. So far, the ASRock card delivers the highest clock speed we’ve tested. This translates to a slightly faster card overall than the Nitro+ and Gigabyte Windforce 3. That 1,956 MHz value runs about 20 MHz over the advertised game clock, which is the expected behavior of these AMD cards. The boost clock feels like a pointless specification as cards are rarely close to that clock speed when gaming.
Furmark
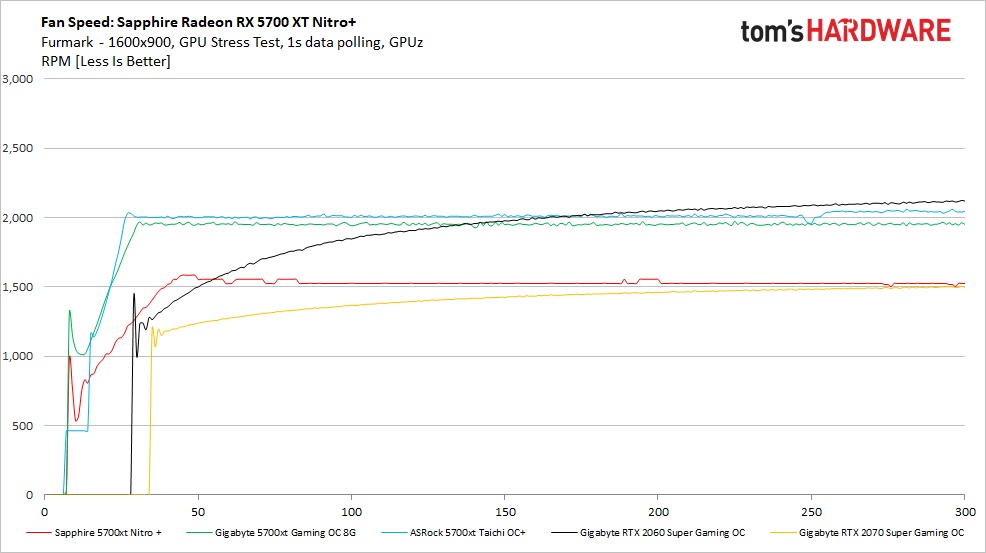
Moving on to Furmark, the song remains mostly the same compared to the gaming result. However, the ramp ups are more stable because of the heavier and more consistent loads from the test. With temperatures not increasing much because of throttling, fan speeds were also similar with the Taichi sitting at 2,000 RPM throughout.
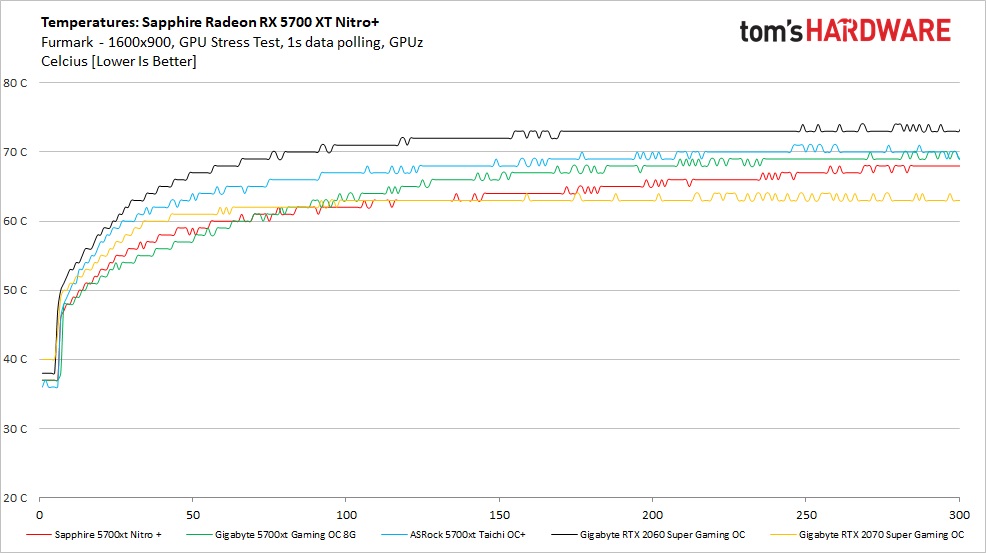
Temperatures in Furmark were not much different than gaming. They ramped up a bit more slowly compared to the game due to all the throttling and management the cards need to run it. Temperatures peaked here at 71C on the Taichi, while both the Gigabyte and ASRock ran just a couple of degrees Celsius cooler. For as big as these fans are and how fast they run, I am surprised the ASRock card didn’t perform better here. That said, the temperatures are still well within specification, so there’s no need to worry.
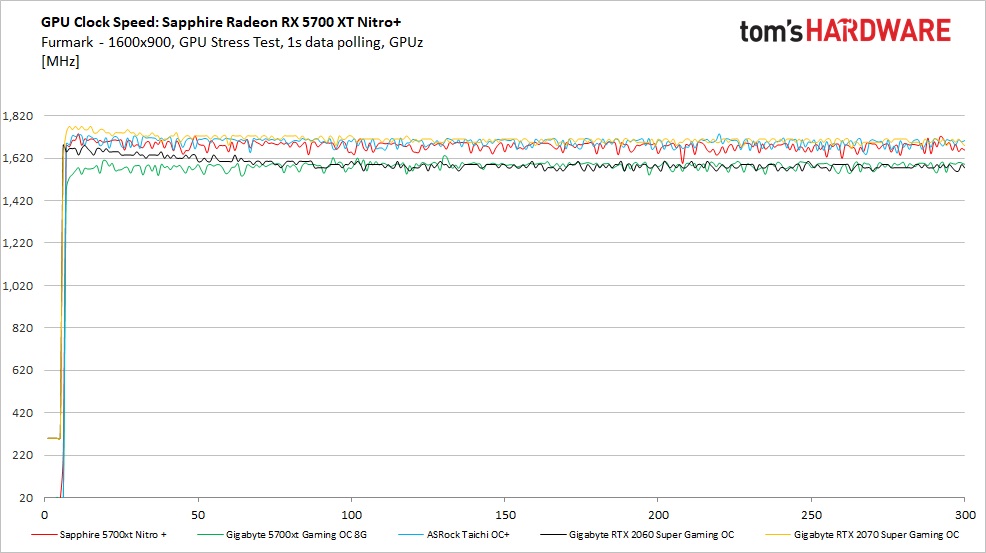
One of the biggest differences we see in Gaming and Furmark testing is that, when running the latter, the clock rate is notably lower across all tested cards. As was mentioned previously, both AMD and Nvidia consider Furmark to be a power virus and thus have protection built in to protect the hardware under such loads. In this case the Taichi’s average clock rate was 1,694 MHz, a ways off from the 1,956 MHz it delivered when gaming. The Gigabyte 5700 XT card managed to run at 1,582 MHz and the Nitro+ averaged 1,678 MHz, both notably lower than a typical gaming load.
MORE: Best Graphics Cards
MORE: Desktop GPU Performance Hierarchy Table
MORE: All Graphics Content
Current page: Power Consumption, Fan Speeds, Clock Rates and Temperature
Prev Page Performance Results: 3840 x 2160 Next Page Software: ASRock Taichi Tweak
Joe Shields is a staff writer at Tom’s Hardware. He reviews motherboards and PC components.