Why you can trust Tom's Hardware
The PG42UQ is certified to have an average error level below 2dE for both color and grayscale by an enclosed datasheet specific to each sample. Mine met this claim in both the DCI-P3 and sRGB gamuts.
Grayscale and Gamma Tracking
Our grayscale and gamma tests use Calman calibration software from Portrait Displays. We describe our grayscale and gamma tests in detail here.
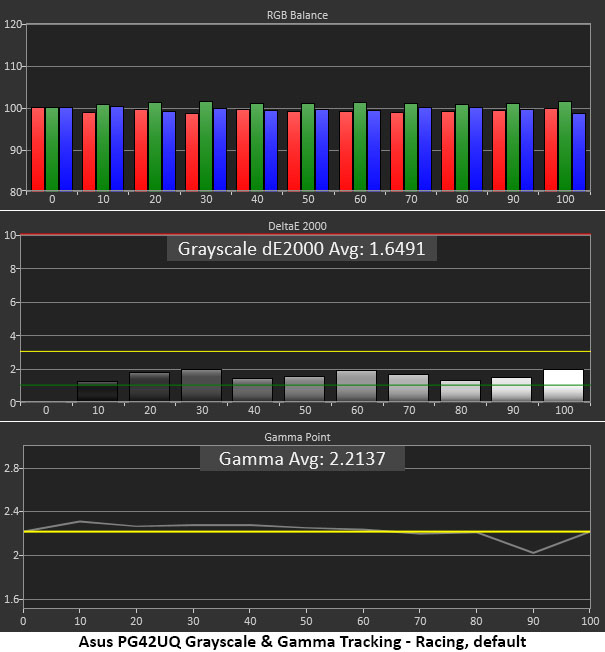
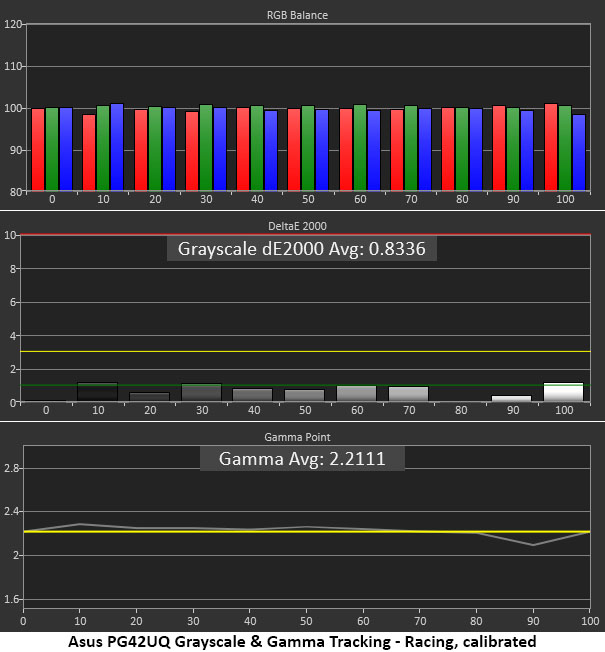
The best way to enjoy the PG42UQ is to leave it in Racing mode and set brightness to taste. For me, that was 100%. Grayscale tracking is visually free of errors with all values below 2dE. Gamma tracks on the reference line except at the 90% step which is a tad too light. I could not spot this error in actual content.
Calibration improves the error numbers and tightens gamma a bit, but I could not see this difference in actual content. Dialing in the grayscale required moderately large changes to the green and blue sliders, which was surprising, but they are at least precise. Whichever way you go, this is excellent performance.
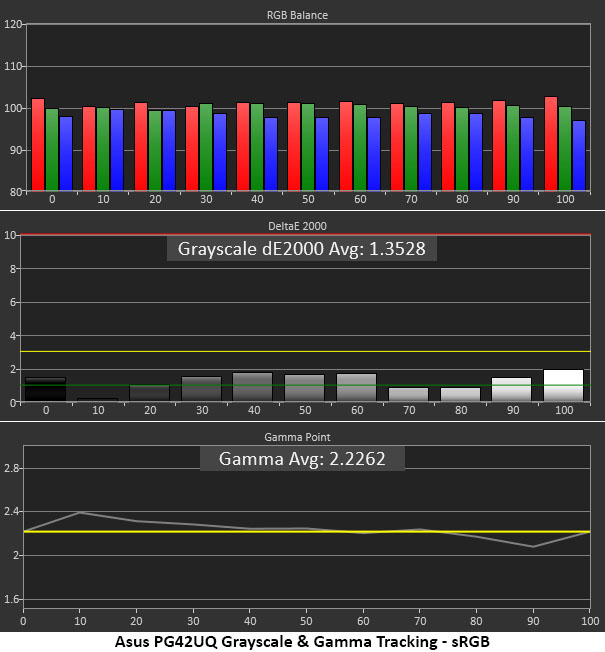
sRGB mode can’t be calibrated, but its grayscale and gamma tracking are visually perfect. I noted a rise in gamma at the dark end of the scale, but I did not observe any clipping in low-brightness step patterns. All steps from 0-20% were visible.
Comparisons
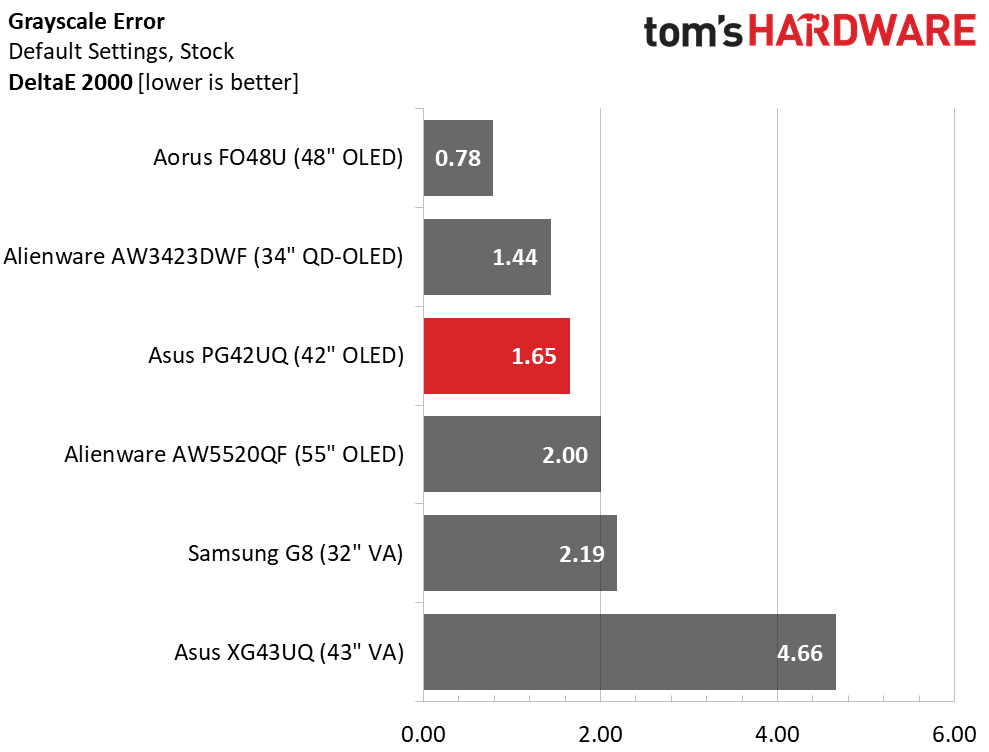
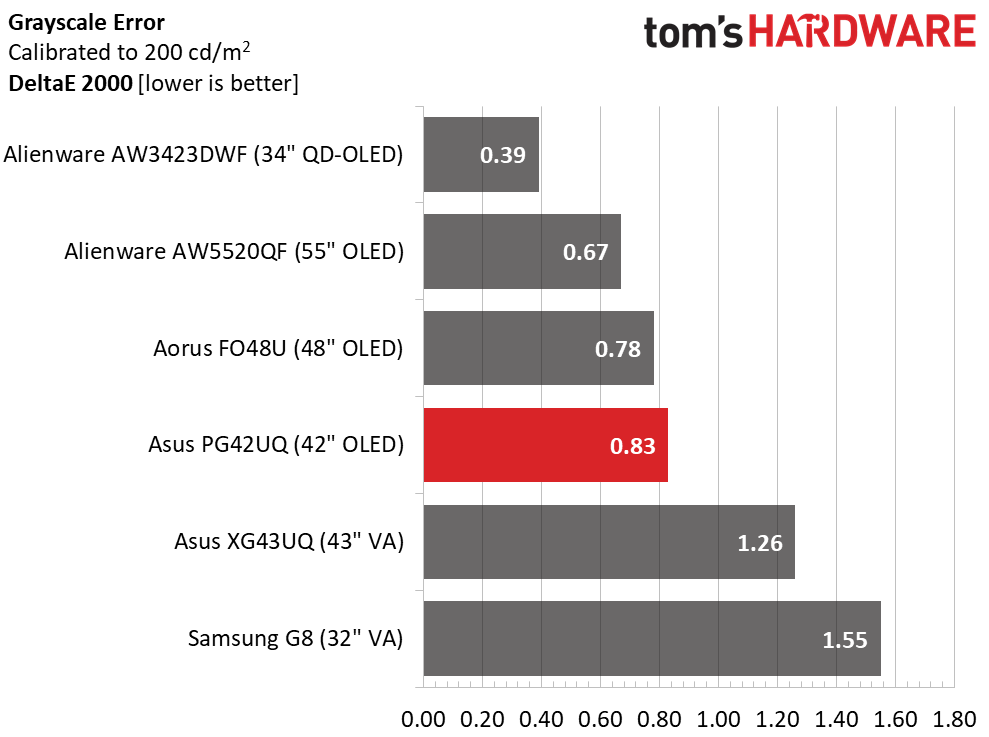
Of all the monitors in the group, only the XG43UQ requires calibration. The others either look the same before and after or slightly better with adjustment. This is the way it should be for premium displays. One should not have to tweak them to achieve a picture that matches industry standards.
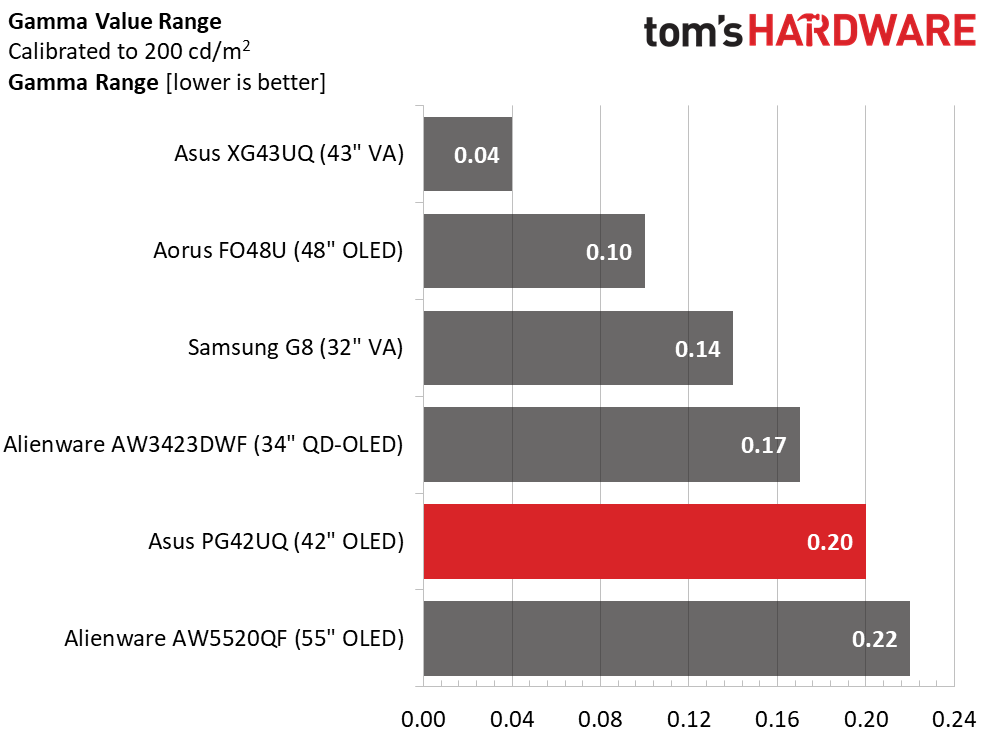
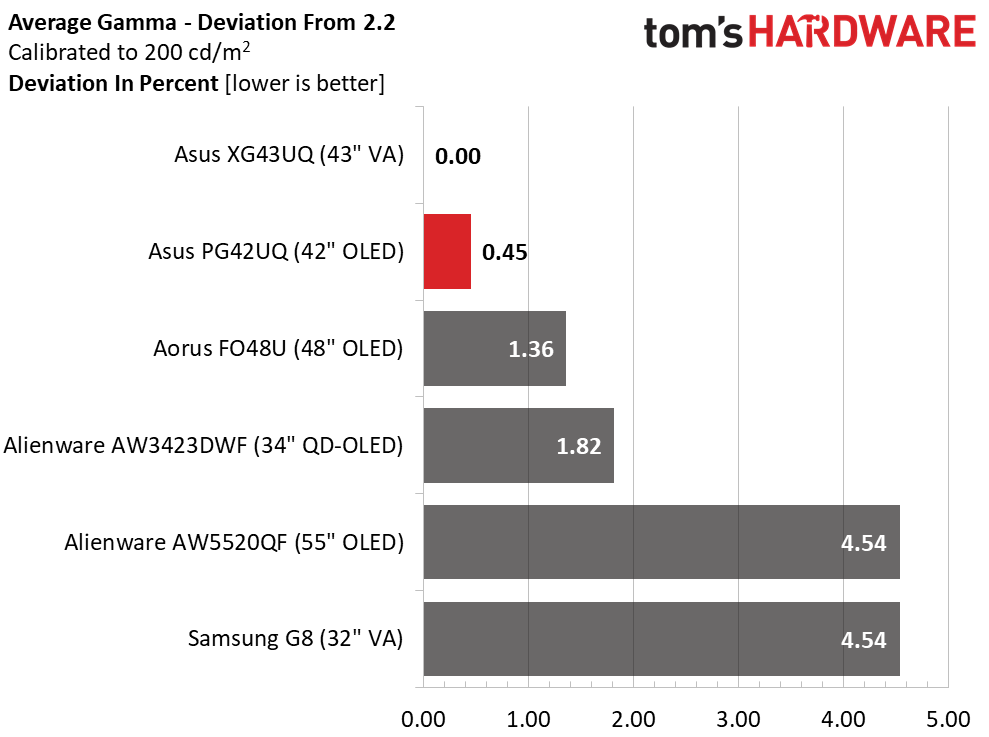
Gamma tracking follows the same journey, as none of the monitors show a visible issue. Though the PG42UQ is fourth in the range contest, its deviation from 2.2 is only 0.45% (actual value 2.21). This bodes well for perceived contrast and color tracking, which are excellent in tests and practical observation.
Get Tom's Hardware's best news and in-depth reviews, straight to your inbox.
Color Gamut Accuracy
Our color gamut and volume testing use Portrait Displays’ Calman software. For details on our color gamut testing and volume calculations, click here.
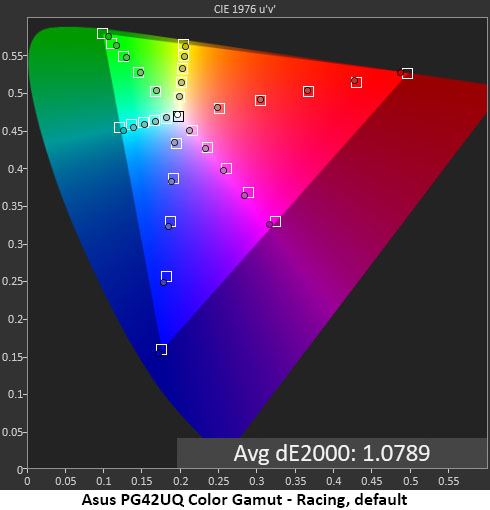
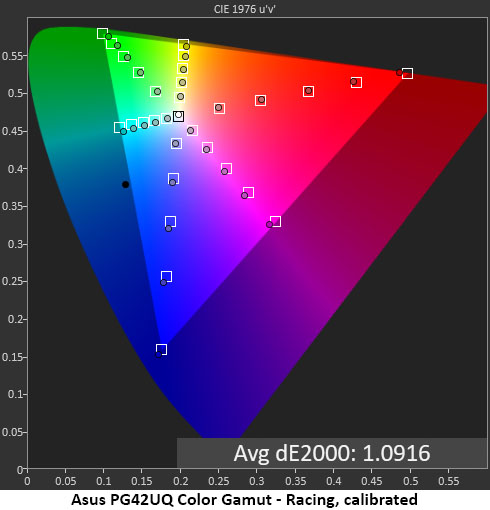
The before and after gamut charts are so close that one can barely see any change in the saturation and hue values. The pre-calibration chart has a slightly lower average error, but compared to the competition, there is no difference in placement. This is a professional-level result, meaning you’re looking at visual perfection.
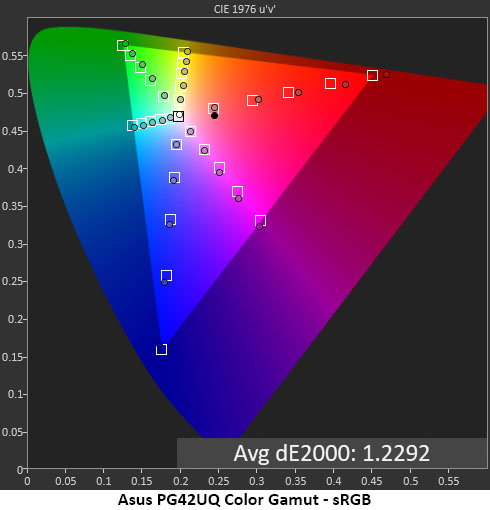
In the PG42UQ’s sRGB picture mode, red is slightly over-saturated, but the overall error is still below the visible threshold. You’ll see the same result if you select the Racing mode with the sRGB color space.
Comparisons
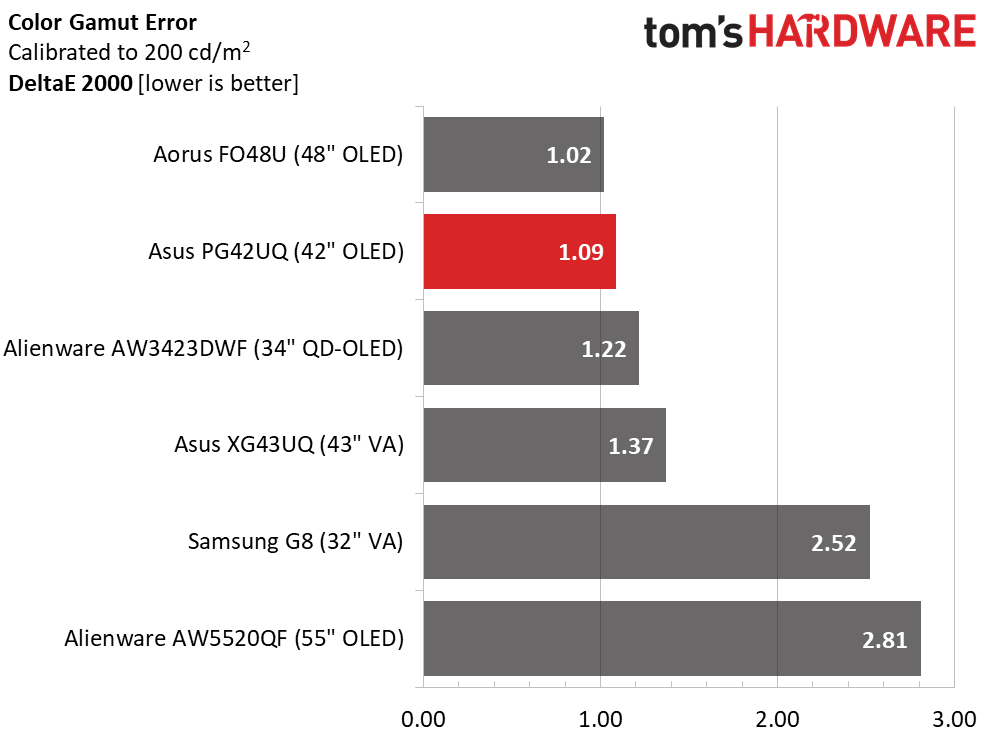
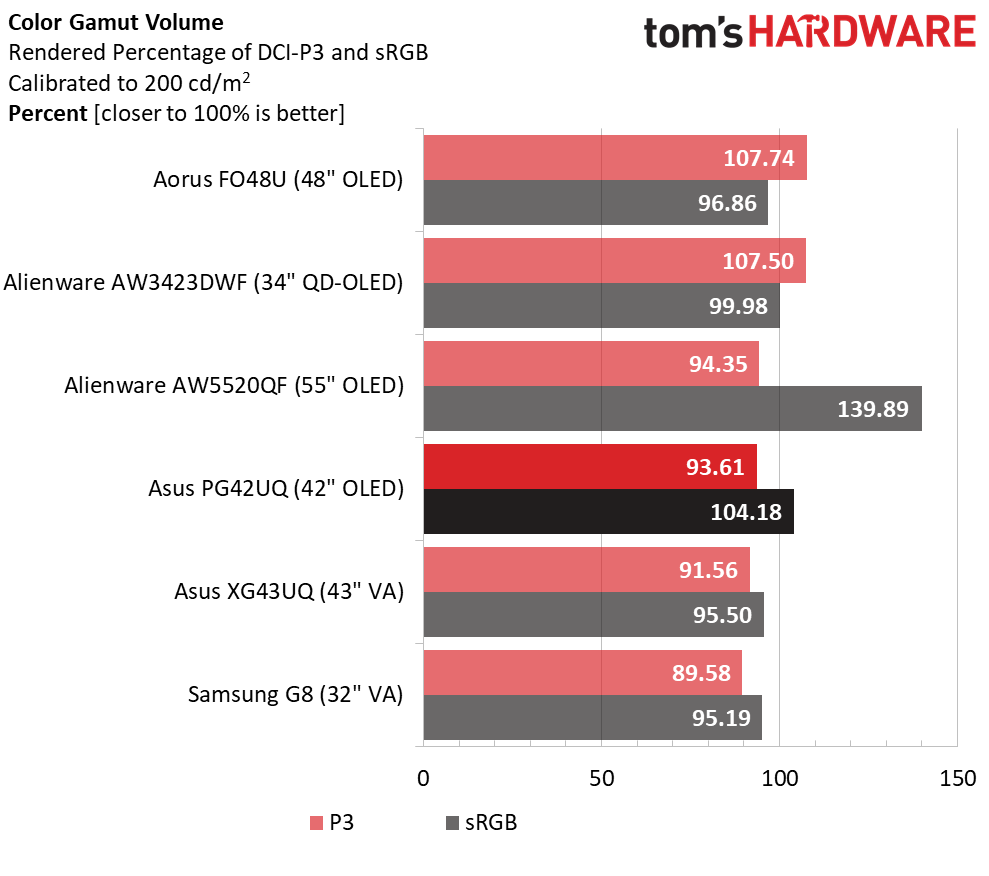
Clearly, it doesn’t get much better than the PG42UQ’s 1.09dE average color error. Only the Aorus manages to pip it for first place. To the naked eye, there is no difference between any of the monitors. But the PG42UQ doesn’t require calibration to get there. It beats its competitors right out of the box.
Of the OLEDs here, two have greater color volume than the PG42UQ. The AW3423DWF manages this with a Quantum Dot layer (QD-OLED), but the Aorus takes top prize without that extra. If you want a monitor dripping with color, that is the one. The PG42UQ isn’t far behind; in my observation, the difference is pretty minor. With the bonus red I mentioned earlier, it exceeds the sRGB standard with 104.18% coverage. This is still within the range needed for color-critical work.
MORE: Best Gaming Monitors
MORE: How We Test PC Monitors
MORE: How to Buy a PC Monitor: A 2022 Guide
MORE: How to Choose the Best HDR Monitor
Current page: Grayscale, Gamma and Color
Prev Page Brightness and Contrast Next Page HDR Performance
Christian Eberle is a Contributing Editor for Tom's Hardware US. He's a veteran reviewer of A/V equipment, specializing in monitors. Christian began his obsession with tech when he built his first PC in 1991, a 286 running DOS 3.0 at a blazing 12MHz. In 2006, he undertook training from the Imaging Science Foundation in video calibration and testing and thus started a passion for precise imaging that persists to this day. He is also a professional musician with a degree from the New England Conservatory as a classical bassoonist which he used to good effect as a performer with the West Point Army Band from 1987 to 2013. He enjoys watching movies and listening to high-end audio in his custom-built home theater and can be seen riding trails near his home on a race-ready ICE VTX recumbent trike. Christian enjoys the endless summer in Florida where he lives with his wife and Chihuahua and plays with orchestras around the state.
-
oofdragon "One obstacle to wide acceptance has been size. Early OLED computer monitors weren’t much smaller than big-screen TVs". Article about 42 inch "PC monitor". FailReply -
JarredWaltonGPU Reply
42 inches for 4K on a monitor seems about ideal to me! I felt 30-inch for 1440p was a good size, so if you want to increase the resolution by 125% (1.5X in each dimension), you definitely need to make the screens bigger. This 4K in a 14-inch laptop business is ludicrous, and 4K in a 28-inch monitor isn't much better for practical use.oofdragon said:"One obstacle to wide acceptance has been size. Early OLED computer monitors weren’t much smaller than big-screen TVs". Article about 42 inch "PC monitor". Fail -
Greg7579 Reply
I am a photographer and shoot high-res GFX 100 (100 MP) files. For years I have used an ASUS 32 inch IPS professional monitor that cost me several thousand 5 years ago. I don't render or edit video, and I don't game. I just edit and enjoy my high-res image files and use Photoshop and mostly Lightroom. The color gamut is important to me, but this monitor seems to be right there at the professional level for photography work, and the 42 inch size (up from 32) I think I would relish.Admin said:Asus adds a 42-inch 4K model to the list of available OLED gaming monitors. The ROG Swift PG42UQ sports a 138 Hz refresh rate, Adaptive-Sync, HDR and extended color. It delivers a stunning image and premium gaming performance.
Asus ROG Swift PG42UQ 4K OLED Review: Stunning in Every Respect : Read more
So, should I get this monitor if I never game? I build my own high-end desktop and am about to build a rig with the 4090 just for the Hell of it.
What do I lose when compared to the ASUS pro mini-led monitor that costs 5 grand?
I think I'm going to get this monitor for my photography work and enjoyment.
What do you think? Or is ASUS about to come out with a new "Pro" monitor that is cheaper and better than their current lineup?
I don't need 144 Hz, but why not? Maybe I will even try a game or two. -
hancor ReplyGreg7579 said:I am a photographer and shoot high-res GFX 100 (100 MP) files. For years I have used an ASUS 32 inch IPS professional monitor that cost me several thousand 5 years ago. I don't render or edit video, and I don't game. I just edit and enjoy my high-res image files and use Photoshop and mostly Lightroom. The color gamut is important to me, but this monitor seems to be right there at the professional level for photography work, and the 42 inch size (up from 32) I think I would relish.
So, should I get this monitor if I never game? I build my own high-end desktop and am about to build a rig with the 4090 just for the Hell of it.
What do I lose when compared to the ASUS pro mini-led monitor that costs 5 grand?
I think I'm going to get this monitor for my photography work and enjoyment.
What do you think? Or is ASUS about to come out with a new "Pro" monitor that is cheaper and better than their current lineup?
I don't need 144 Hz, but why not? Maybe I will even try a game or two.
I bought this unit about 2 months ago, and the firmware issue is now resolved. This monitor is everything state of the art, for gaming, photography, or plain old work, net surfing. Currently, paired with my EVGA 2080 Ti, while the EVGA FTW3 RTX Ultra Gaming, is being repaired. Colors just "pop" compared to TN, VA, or IPS panels.
Without question you will enjoy this monitor immensely. Cheers :) -
eisenb11 I have this monitor and it’s great - but I can’t believe that the article didn’t mention fringing on text. IMHO that’s the biggest issue (although you can live with it) with this monitor.Reply
The author is minimizing it by using 150% scaling. He really should have also tested the monitor at 100% scaling so you can, you know, use the full 4K res of the monitor for your desktop.
This is an inherent problem of the WRGB sub pixel layout which pretty much all LG panels use. The real fix is that enough people need to complain about it (not work around it with higher scaling) so Microsoft updates ClearType which is currently optimized for normal RGB.
For those with this monitor, using MacType helps a bit, but a real fix to ClearType is really needed. It improves text quality, but it’s still nowhere near LCD level. You can turn off ClearType, but text looks terrible - even at 4K resolution so that it’s still better looking with the fringing. -
PlaneInTheSky ReplyEven the best Mini LED panels can’t reproduce intra-image black levels like an OLED.
Yep, my OLED has far better local dimming than the Mini LCD TV and none of the light bleeding. Each Mini LED backlight still illuminates thousands of pixels, so Mini LED still suffers from the same problems of IPS, TN and VA panels, light bleeding, no true black, viewing angle problems, etc.
The light bleeding which causes blooming, is less of an issue on TV consuming movies for example. But it is a real issue for text for example.
Only OLED and E-ink solves this problem.
(The exception is of course the QD-OLED garbage from Samsung and Alienware, which messes it all up with their color artefacts.)
The big promise was that Micro LED would solve Mini LED's problems and have per pixel dimming. But Micro LED is turning out to be a manufacturing nightmare. The tiny circuitry needed to power millions of LED is a mess and yields are terrible. -
PlaneInTheSky ReplyI have this monitor and it’s great - but I can’t believe that the article didn’t mention fringing on text. IMHO that’s the biggest issue (although you can live with it) with this monitor.
The Alienware and Samsung QD-OLED have this problem. Color artefacts, color fringes. Whatever people want to call it. They're red and green lines surrounding high contrast elements due to a difference in pixel layout.
I am spared from this problem on my regular OLED TV which I use as a monitor. -
PlaneInTheSky ReplyThis is an inherent problem of the WRGB sub pixel layout which pretty much all LG panels use.
LG sells OLED monitors with an RGB layout that has no color fringing, like the LG Ultrafine Pro series.
Of course, they're more expensive than the OLED screens found in gaming monitors. -
Blacksad999 Interesting review. Every other monitor testing site and reviewer suggested that "Cinema Mode" is the best setting for accurate colors. I'm also curious which firmware the reviewer is using, as people all over the place are dealing with washed out non-functional HDR on firmware V033. All of the previous firmware versions don't allow the panel to wake on sleep if you're using "overclocking" to reach 138hz, and the pixel refresh pop up returns very commonly, so I was surprised to see no mention of any of that.Reply
You can read about the broken HDR in depth on Rtings review of the monitor. The tone mapping is broken on this monitor, and only covers 34% of the gamut when HDR is on, as you can see here: https://www.rtings.com/assets/pages/ncyZeV4m/fall-800-hdr-off-large.jpgIf anyone knows which firmware the reviewer is using, let me know. I don't think it's the updated version V033. -
DougMcC So close to the monitor i'm dying to buy. Just get me to 144hz and no bigger than 37".Reply
