BenQ XL2720Z Monitor Review: A 27-Inch, 144 Hz Gaming Display
Many displays are marketed as gaming monitors. But only a tiny handful operate at refresh rates greater than 60 Hz. The BenQ XL2720Z sails along at 144 Hz and offers many gaming-specific features. Today we run it through our benchmark suite.
Results: Brightness And Contrast
Uncalibrated
Before calibrating any panel, we measure zero and 100-percent signals at both ends of the brightness control range. This shows us how contrast is affected at the extremes of a monitor's luminance capability. We do not increase the contrast control past the clipping point. While doing this would increase a monitor’s light output, the brightest signal levels would not be visible, resulting in crushed highlight detail. Our numbers show the maximum light level possible with no clipping of the signal.
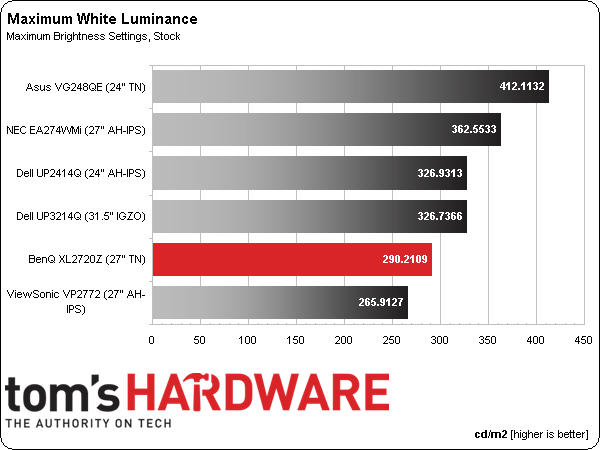
We reviewed another 144 Hz screen back in the fall, Asus' VG248QE, so we're adding it to our comparison group. The rest are QHD and UHD displays already evaluated on Tom's Hardware.
Our measurements come pretty close to BenQ’s spec of 300 cd/m2. That's plenty of light for any gaming or productivity application. There is one caveat though. If you engage the blur reduction feature, output is cut by around 58 percent. Whenever black frame insertion is used in any LCD panel, lower brightness is an unavoidable side-effect. You can mitigate this somewhat by using the Blur Busters Strobe Utility, which we talk about on page nine.
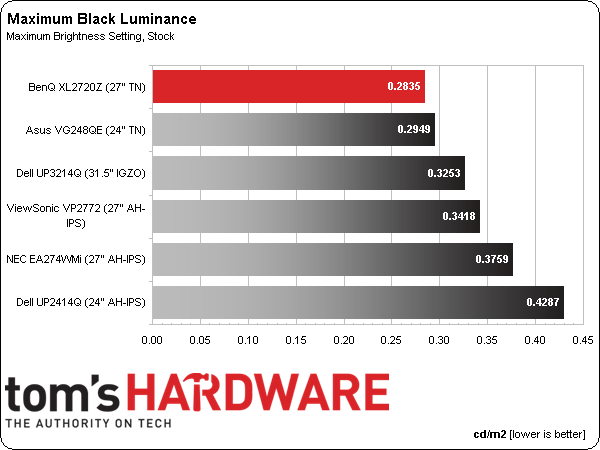
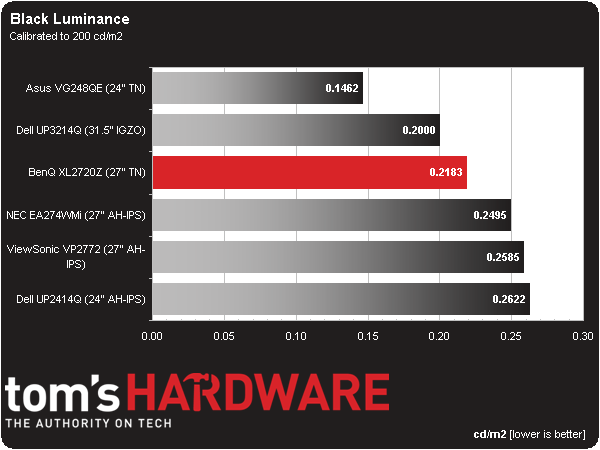
TN panels usually render decent black levels, even with the backlight on maximum.
The XL2720Z cranks out excellent black levels. This is one area where TN panels are still superior to their IPS counterparts. The BenQ also edges out its 144 Hz competitor, Asus’ VG248QE by a hair.
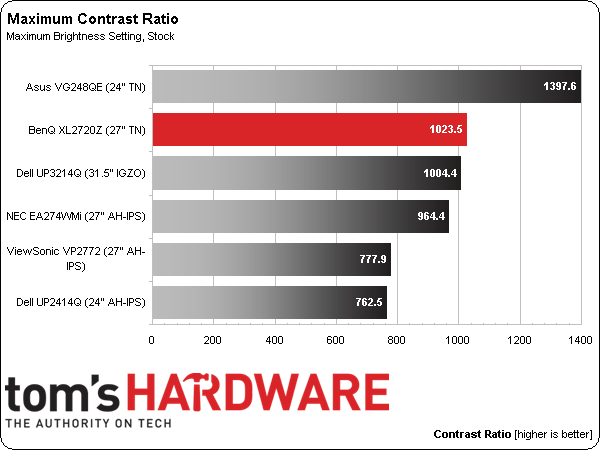
The overall contrast result is quite good.
The BenQ’s max contrast ratio isn’t quite at the top, but it’s very close. Only a handful of monitors of any type can exceed 1000 to 1 when the backlight is turned up all the way.
Get Tom's Hardware's best news and in-depth reviews, straight to your inbox.
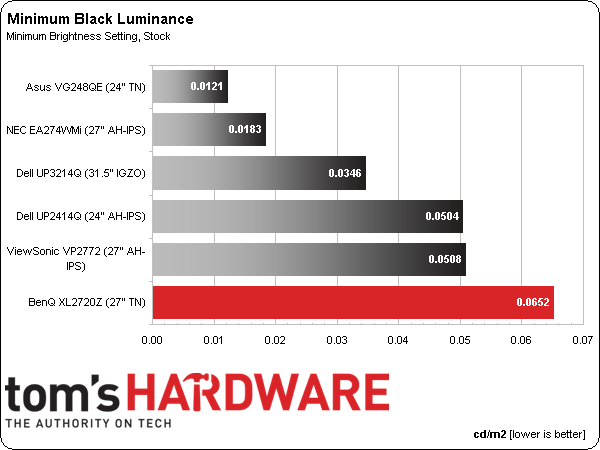
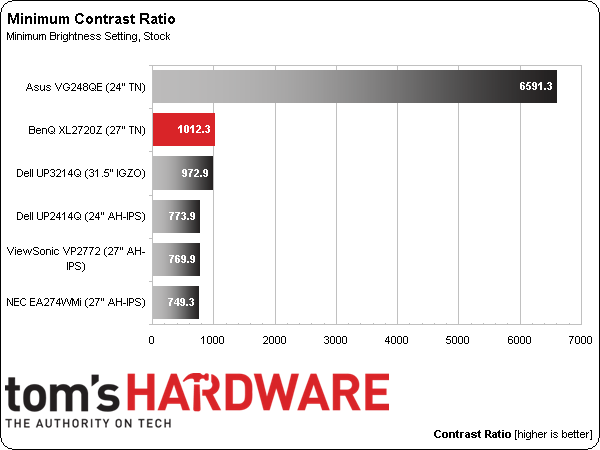
We believe 50 cd/m2 is a practical minimum standard for screen brightness. Any lower and you risk eyestrain and fatigue. The XL2720Z bottoms out at 66.0294 cd/m2, which is great for playing games in total darkness as long as you don’t use the Blur Reduction feature. As you’ll see below, black levels and contrast hold up extremely well too.
Even though the BenQ finishes last in this group, all of the monitors measure extremely low in our minimum black level test. The VG248QE is still the champ.
Here are the contrast numbers:
BenQ's result beats most of the other monitors we’ve tested. Although we’ve seen a couple of screens score higher (like the Asus), once the contrast ratio is over 1000 to 1, it’s hard to tell a difference in perceived image quality. The XL2720Z demonstrates consistently high contrast performance throughout its entire brightness range.
After Calibration
Since we consider 200 cd/m2 to be an ideal point for peak output, we calibrate all of our test monitors to that value. In a room with some ambient light (like an office), this brightness level provides a sharp, punchy image with maximum detail and minimum eye fatigue. On many monitors, it’s also the sweet spot for gamma and grayscale tracking, which we'll look at on the next page. In a darkened room, some professionals prefer a 120 cd/m2 calibration, though it makes little to no difference on the calibrated black level and contrast measurements.
Calibration usually reduces contrast slightly. But unless the change is greater than about 15 percent, you’re unlikely to see a difference. A result of .2183 cd/m2 is excellent.
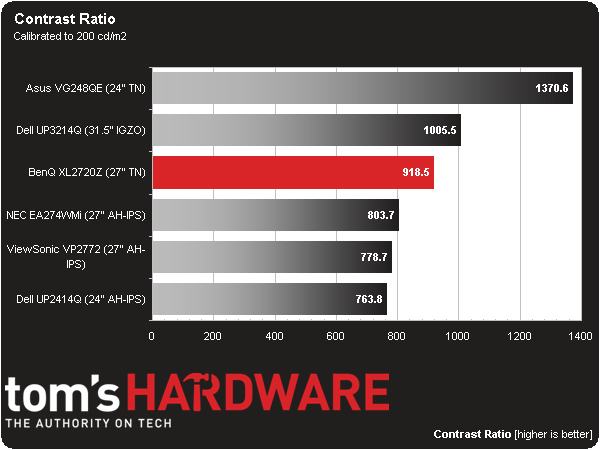
The final contrast ratio is only slightly lower than the out-of-box figure.
We are happy to see the trend of consistent contrast performance continue with the XL2720Z. It’s always best to have a screen that delivers the same image quality no matter what the backlight setting. This panel is firmly in that category.
ANSI Contrast Ratio
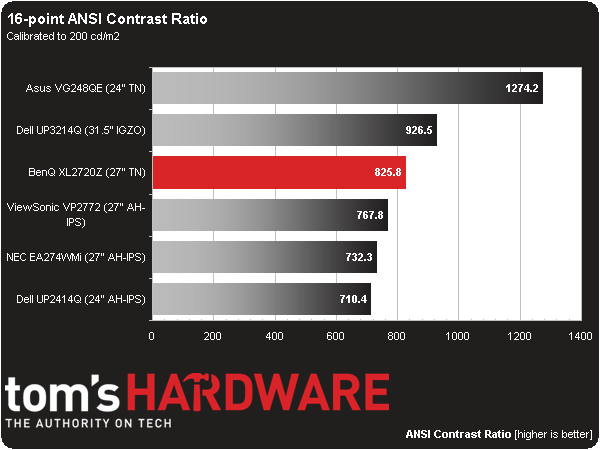
Another important measure of contrast is ANSI. To perform our test, a checkerboard pattern of sixteen zero and 100-percent squares is measured, giving us a somewhat more real-world metric than on/off measurements because it evaluates a display’s ability to simultaneously maintain both low black and full white levels, further factoring in screen uniformity. The average of the eight full-white measurements is divided by the average of the eight full-black measurements to arrive at the ANSI result.
Looking over our data for the past year, a vast majority of tested screens are in a range of 800-900 to 1 for ANSI contrast. The checkerboard pattern we measure is a more real-world representation of actual intra-image contrast. Since the XL2720Z is made from a brand-new panel part, it’s not surprising to see such good engineering and quality control.
Current page: Results: Brightness And Contrast
Prev Page Measurement And Calibration Methodology: How We Test Next Page Results: Grayscale Tracking And Gamma Response
Christian Eberle is a Contributing Editor for Tom's Hardware US. He's a veteran reviewer of A/V equipment, specializing in monitors. Christian began his obsession with tech when he built his first PC in 1991, a 286 running DOS 3.0 at a blazing 12MHz. In 2006, he undertook training from the Imaging Science Foundation in video calibration and testing and thus started a passion for precise imaging that persists to this day. He is also a professional musician with a degree from the New England Conservatory as a classical bassoonist which he used to good effect as a performer with the West Point Army Band from 1987 to 2013. He enjoys watching movies and listening to high-end audio in his custom-built home theater and can be seen riding trails near his home on a race-ready ICE VTX recumbent trike. Christian enjoys the endless summer in Florida where he lives with his wife and Chihuahua and plays with orchestras around the state.
-
Fierce Guppy What a coincidence. I got a XL2720Z just this Wednesday. I would've preferred to wait for the arrival of Haswell-E before buying a new monitor, but my Samsung T260 emits something that causes reddening of the skin around my nose, above my left eyebrow, and smack in middle of my forehead. (Sunlight and florescent tubes don't do this to me.) Happy to say the XL2720Z does not cause me any injury, or at least not yet...Reply
It's still an interim monitor, though. What I really want is a large affordable WQHD or UHD IPS gaming monitor.
-
MonsterCookie When do monitor manufacturers understand, that 1080p resolution is a JOKE,Reply
especially on a large 27" screen?
In the early 2000s it might have been ok to have such resolution, but nowadays
it is no longer usable. Even for a 24" screen the minimal resolution is
1920x1200.
Until they are not making these 27" screens to have more pixels, they are not
seeing any cash out of me. I rather buy el-cheapo monitors from Ebay as a mail
order from Korea.
Monitor manufacturers, please stop living in the 80s and stop hustling us with
your prices! -
Bernie Fresh "oh neat, a new monitor. lets check specs. oh coool 1080p and a bunch of buzz words"Reply
sometimes I feel like nobody is listening... or just trying to sell me a bridge for the low low.
decent review, but if youve got the gpu for 144Hz. 2160p @60 is just a cootie shot away -
somebodyspecial So from the results I still need an IPS with Gsync or you're stuck with TN. I'm hoping by xmas they have a dozen good choices for gsync monitors with 144hz also in there (why not, what if I go AMD again after maxwell?). Might as well get as many bases covered as possible. IF monitor makers are reading this, 2560x1600! Screw this 1440p crap. Wider is NOT better in monitors of these sizes. I want to scroll up & down less than I am already on 1920x1200 but at least at 1600p I get the same. I won't buy 1440p.Reply -
MonsterCookie Reply"oh neat, a new monitor. lets check specs. oh coool 1080p and a bunch of buzz words"
To add offense to injury, in 2008 I bought my first LCD (24" Samsung with 1920x1200 pixels) for 330Euros. Now a 24" Samsung would cost me 400 Euros, and it has only 1920x1080 pixels.
sometimes I feel like nobody is listening... or just trying to sell me a bridge for the low low.
What on earth have happened? Why did prices go up, and resolution went down?
Why are there no 30" 2560x1600 TN panels out there for gamers for 700 Euros?
-
siman0 ReplyWhen do monitor manufacturers understand, that 1080p resolution is a JOKE,
especially on a large 27" screen?
In the early 2000s it might have been ok to have such resolution, but nowadays
it is no longer usable. Even for a 24" screen the minimal resolution is
1920x1200.
Until they are not making these 27" screens to have more pixels, they are not
seeing any cash out of me. I rather buy el-cheapo monitors from Ebay as a mail
order from Korea.
Monitor manufacturers, please stop living in the 80s and stop hustling us with
your prices!
This monitor is made for gaming, true gamers don't care a grate deal about resolution. We are in it for the refresh rates and the response time. Ive been gaming on a old CRT monitor till last year with a change to the Asus VG248QE. Even though its still much slower than my old CRT it works. I have 2 computers 1 for gaming and one for everyday and video work. Gaming machine is set up around a single R9 290X, 4770K, and a Asus VG monitor. My other computer is a crossfired 295s, 3930K, and 3 IPS 4k monitors.
A single card is better for latency, 4770K is more than enough to push data to the 290X and the monitor has a fast refresh rate. Its better at gaming than my extremely high dollar build. Peripherals are set up differently as you can imagine gaming computer has razer and a 7.1 headset. The other is mostly set up for 2.1 but i do have a 7.1 headset for room sound. -
MonsterCookie @siman0Reply
"This monitor is made for gaming, true gamers don't care a grate deal about resolution"
You meant, online multiplayer gamers don't care a grate deal about resolution.
I prefer to play single-player FPS, where I do want to have all the eye candy,
and I want to see the vegetation, desert, sky etc. The only advantage of a PC is
that it can provide better graphics, that is the main point.
Otherwise I could just go out, buy an 1080p TV, a Crapbox1, Crapbox360, or PlayStopper 4, and game on that thing in 1080p.
I think monitor technology is not moving forward (in fact moving backwards) exactly because people are happy to buy their 1080p crap for 500 Euros. -
InvalidError This seems a little weird to me: the panel uses constant-current to drive LEDs because some people claim to see flicker at ~20kHz PWM frequency yet the very same display uses backlight strobing to reduce blur and this would be occurring at 144-288Hz which is 100X lower.Reply -
DookieDraws Serious question. Why not just buy a quality HDTV with 120 (or greater) Hz for your gaming monitor? Especially if you'll be gaming at 1920x1080. A neighbor has his PC hooked up to a quality HDTV and it looks great to me. I've played Battlefield on it with no issues at all. It's pretty awesome!Reply -
Fierce Guppy ReplyMonster Cookie:
When do monitor manufacturers understand, that 1080p resolution is a JOKE,
especially on a large 27" screen?
In the early 2000s it might have been ok to have such resolution, but nowadays
it is no longer usable. Even for a 24" screen the minimal resolution is
1920x1200.
In the early 2000s CRTs were still the standard. 4:3 was the standard aspect ratio. There were no 1080p LCD monitors let alone large 1080p LCD monitors, and I paid ~$1200(NZD) for a 17" 1280x1024@60Hz (16ms) LCD display in 2003. That's how bad it was back then.
