System Builder Marathon, Q1 2013: System Value Compared
Deals
By
Thomas Soderstrom
published
Add us as a preferred source on Google
Results: Productivity
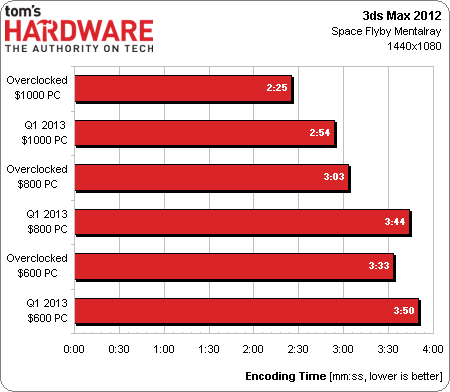
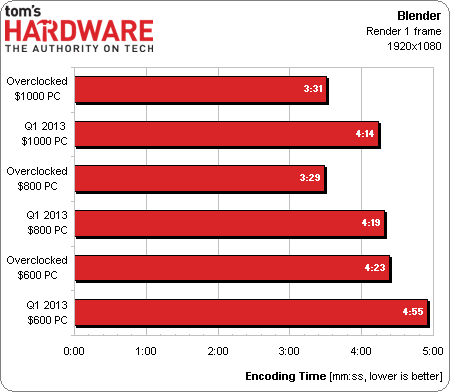
One of the few applications that benefits from the $1,000 PC’s better RAM settings and faster SSD, 3ds Max resurrects that machine’s position in the value race. Conversely, Blender shows little difference between two systems that have the same CPU.
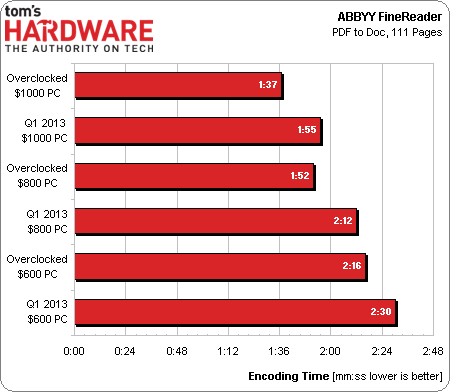
Hammering the value drum a little louder, the $600 machine shows that its price advantage just might be a little greater than its performance disadvantage.
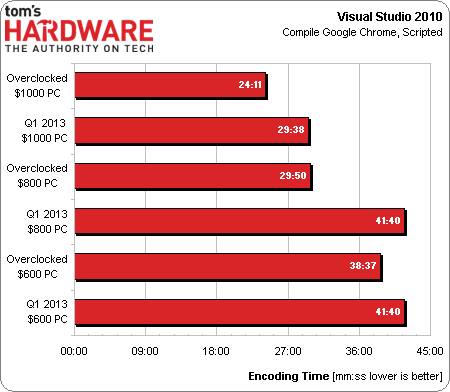
Like 3ds Max, Microsoft Visual Studio gets a noticeable performance bump from the $1,000 PC’s memory optimizations and its faster system drive.
Current page: Results: Productivity
Prev Page Results: Adobe Creative Suite Next Page Results: File CompressionStay On the Cutting Edge: Get the Tom's Hardware Newsletter
Get Tom's Hardware's best news and in-depth reviews, straight to your inbox.
Thomas Soderstrom is a Senior Staff Editor at Tom's Hardware US. He tests and reviews cases, cooling, memory and motherboards.
116 Comments
Comment from the forums
-
plasmaj12345 thymanbearpigYou would think with an extra $200 you can get a noticeable difference in fps..Reply
The only real difference between the $800 and $1000 PC is that the $1000 has an SSD. They both have the same CPU, RAM, and GPU. Gaming should be about the same on both.
-
saxplayingcompnerd @thymanbearpig They use the same GPU, most games are GPU bottle-necked. That's how they get nearly the same FPS.Reply -
mayankleoboy1 Something i posted last quarter too :Reply
Why would all the machines have same percent emphasis on games and productivity apps ? Why would a $600 gaming PC be evaluated similarly to a $800 enthusiast PC ? The percentwise distribution of each metric should be based on what usage the build was meant for.
Something like : games, apps, storage.
$600 build : 85%, 15% . (cheapest, best gaming. Very few apps. Doesnt need fast storage. )
$800 build : 55%, 35%, 10% (slightly better games over apps. Great apps. fast storage for OS + apps OR games)
$1000 build. : 42.5%, 42.5%, 15% (equally good games and apps. fast storage should be plenty for OS+apps+games) -
Crashman ankit0x1still waiting for 2000$ buildHow about building up the $1000 machine into a dual-GPU added-storage $1600 PC?Reply -
mayankleoboy1 can we have a chart of the combined totals of :Reply
1) FPS in games
2)time taken in apps
for each build?
so that we may draw our own conclusions from the data? I am not entirely satisfied with the conclusions you have drawn. -
Crashman mayankleoboy1can we have a chart of the combined totals of :1) FPS in games2)time taken in appsfor each build?so that we may draw our own conclusions from the data? I am not entirely satisfied with the conclusions you have drawn.Percentages are just as accurate, you'll find those on Page 13 along with power numbers.Reply
-
bdizzle11 For next SBM how about a $800, $1200, $1600. A little bit higher but more spread. I think that would better determine the sweet spot...Reply -
atomicWAR Honestly i would like to see an up-graders marathon. With price points of 600, 800, 1000, 1300, 1600, 2000 covered all using the same case, CD/dvd, and mech HDD (not included in cost). Those are the most common carry over parts besides my water-cooling that carries over build to build. I believe it would be a very useful and realistic application of funds many of your readers could relate to.Reply


