System Builder Marathon, Q1 2013: System Value Compared
Power Consumption And Efficiency
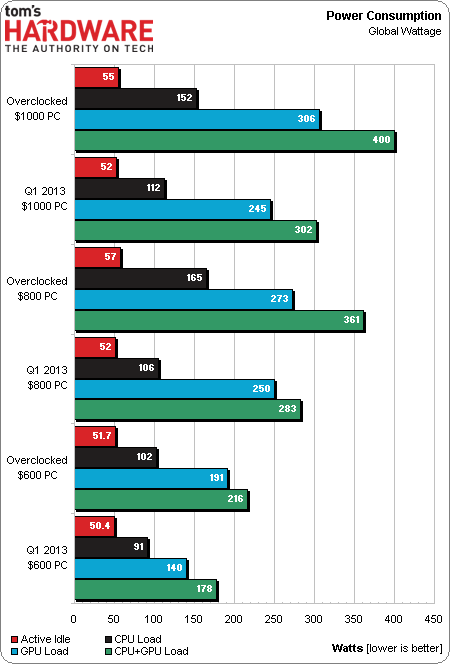
Our global wattage readings are taken at the power supply’s input, and some of that power is lost within the power supply itself. That means that all of today’s builds pull less than 400 W from the power supply, and any of these builds could have been made a little cheaper by using a less-capacious unit of similar quality.
SSDs typically draws less power than hard drives, so hardware similarities between the $1,000 and $800 machines should theoretically give the more expensive build a lower power signature. This isn't the case, though. So, the $1,000 machine’s excess power draw is probably due to its extra fan and higher memory voltage.
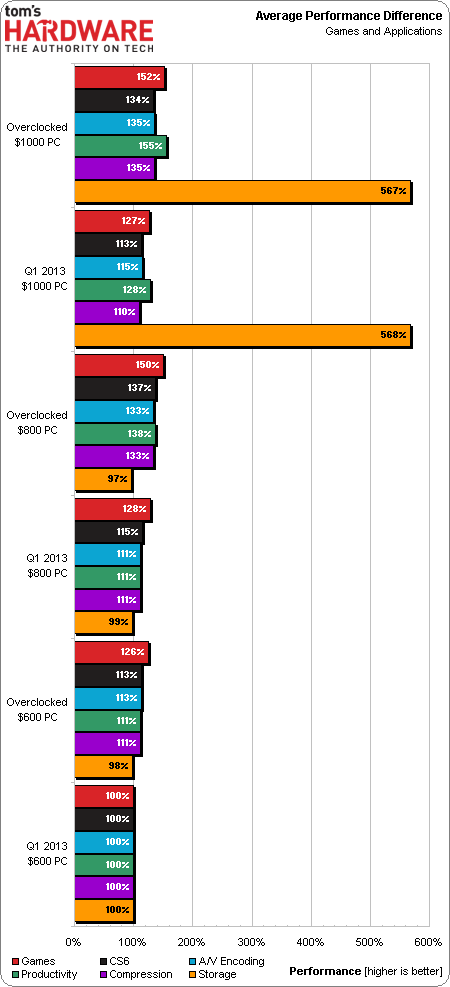
An SSD gives the $1,000 machine a huge boost in our storage-oriented metric. But that boost affects user experience more than program performance. Because of that, it represents only 10% of our total performance score.
The rest of our breakdown used to be: 30% games, 30% encoding, and 30% productivity. Changes to our benchmark suite now make the totals of 30% games, 15% creativity, 15% A/V encoding, 15% productivity, 15% compression, and 10% storage.
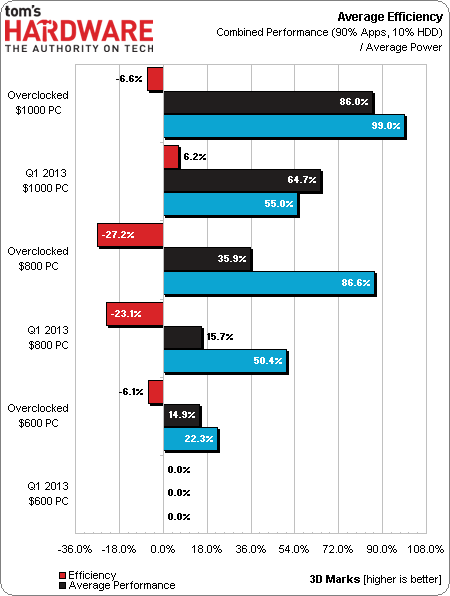
Using the slowest configuration as our baseline, we find this quarter's most-expensive machine on top of its efficiency curve by 6.2%. While overclocking can actually improve efficiency, overvoltage has the opposite effect. Each of our overclocked configurations loses this metric to the same system’s baseline operation.
Current page: Power Consumption And Efficiency
Prev Page Results: File Compression Next Page Where's The Value Sweet Spot?Get Tom's Hardware's best news and in-depth reviews, straight to your inbox.
-
plasmaj12345 thymanbearpigYou would think with an extra $200 you can get a noticeable difference in fps..Reply
The only real difference between the $800 and $1000 PC is that the $1000 has an SSD. They both have the same CPU, RAM, and GPU. Gaming should be about the same on both.
-
saxplayingcompnerd @thymanbearpig They use the same GPU, most games are GPU bottle-necked. That's how they get nearly the same FPS.Reply -
mayankleoboy1 Something i posted last quarter too :Reply
Why would all the machines have same percent emphasis on games and productivity apps ? Why would a $600 gaming PC be evaluated similarly to a $800 enthusiast PC ? The percentwise distribution of each metric should be based on what usage the build was meant for.
Something like : games, apps, storage.
$600 build : 85%, 15% . (cheapest, best gaming. Very few apps. Doesnt need fast storage. )
$800 build : 55%, 35%, 10% (slightly better games over apps. Great apps. fast storage for OS + apps OR games)
$1000 build. : 42.5%, 42.5%, 15% (equally good games and apps. fast storage should be plenty for OS+apps+games) -
Crashman ankit0x1still waiting for 2000$ buildHow about building up the $1000 machine into a dual-GPU added-storage $1600 PC?Reply -
mayankleoboy1 can we have a chart of the combined totals of :Reply
1) FPS in games
2)time taken in apps
for each build?
so that we may draw our own conclusions from the data? I am not entirely satisfied with the conclusions you have drawn. -
Crashman mayankleoboy1can we have a chart of the combined totals of :1) FPS in games2)time taken in appsfor each build?so that we may draw our own conclusions from the data? I am not entirely satisfied with the conclusions you have drawn.Percentages are just as accurate, you'll find those on Page 13 along with power numbers.Reply
-
bdizzle11 For next SBM how about a $800, $1200, $1600. A little bit higher but more spread. I think that would better determine the sweet spot...Reply -
atomicWAR Honestly i would like to see an up-graders marathon. With price points of 600, 800, 1000, 1300, 1600, 2000 covered all using the same case, CD/dvd, and mech HDD (not included in cost). Those are the most common carry over parts besides my water-cooling that carries over build to build. I believe it would be a very useful and realistic application of funds many of your readers could relate to.Reply


