System Builder Marathon, Q1 2013: System Value Compared
Results: 3DMark And PCMark
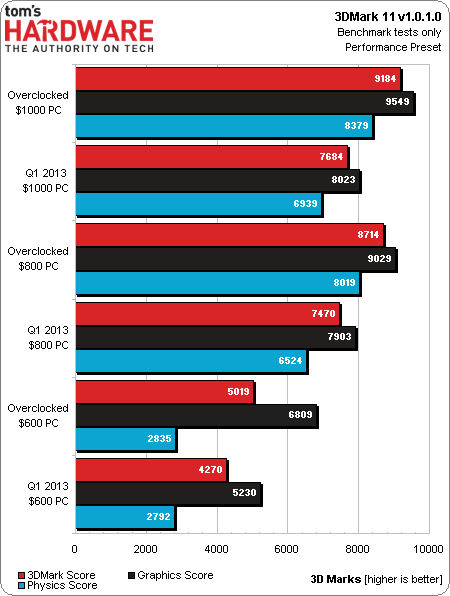
The biggest hardware difference between $800 and $1,000 PCs is the more expensive build’s SSD, and that doesn't affect 3DMark at all. The top-end system's next most-impressive advantage is its high overclocked memory data rate, which does appear to help facilitate a victory in this synthetic graphics-oriented benchmark.
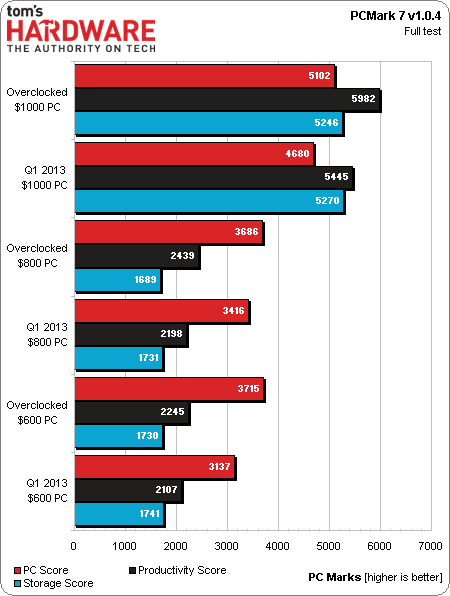
As we move to PCMark, the SSD becomes far more influential as an influencer of performance. Storage makes up a big part of the benchmark’s overall score, and the $1,000 PC’s solid-state storage stands out even more prominently when we look at its storage score specifically.
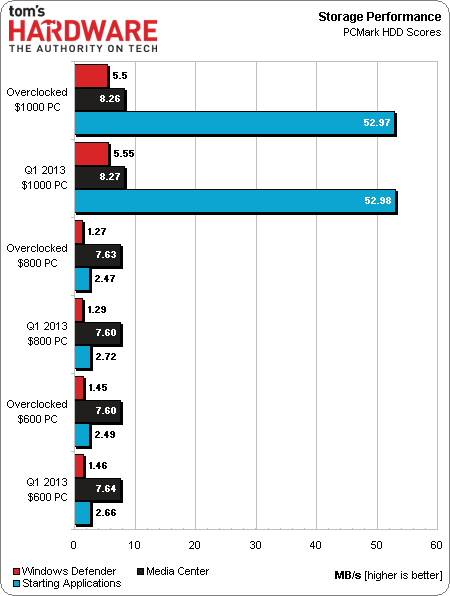
Storage benchmarks make up 10% of our final performance scores, and we use the above three test patterns to represent real-world use. This is the only time you'll see a synthetic impact our value analysis, since it's a practical way for us to quantify user experience.
Current page: Results: 3DMark And PCMark
Prev Page Hardware, Software, And Overclock Settings Next Page Results: SiSoftware SandraGet Tom's Hardware's best news and in-depth reviews, straight to your inbox.
-
plasmaj12345 thymanbearpigYou would think with an extra $200 you can get a noticeable difference in fps..Reply
The only real difference between the $800 and $1000 PC is that the $1000 has an SSD. They both have the same CPU, RAM, and GPU. Gaming should be about the same on both.
-
saxplayingcompnerd @thymanbearpig They use the same GPU, most games are GPU bottle-necked. That's how they get nearly the same FPS.Reply -
mayankleoboy1 Something i posted last quarter too :Reply
Why would all the machines have same percent emphasis on games and productivity apps ? Why would a $600 gaming PC be evaluated similarly to a $800 enthusiast PC ? The percentwise distribution of each metric should be based on what usage the build was meant for.
Something like : games, apps, storage.
$600 build : 85%, 15% . (cheapest, best gaming. Very few apps. Doesnt need fast storage. )
$800 build : 55%, 35%, 10% (slightly better games over apps. Great apps. fast storage for OS + apps OR games)
$1000 build. : 42.5%, 42.5%, 15% (equally good games and apps. fast storage should be plenty for OS+apps+games) -
Crashman ankit0x1still waiting for 2000$ buildHow about building up the $1000 machine into a dual-GPU added-storage $1600 PC?Reply -
mayankleoboy1 can we have a chart of the combined totals of :Reply
1) FPS in games
2)time taken in apps
for each build?
so that we may draw our own conclusions from the data? I am not entirely satisfied with the conclusions you have drawn. -
Crashman mayankleoboy1can we have a chart of the combined totals of :1) FPS in games2)time taken in appsfor each build?so that we may draw our own conclusions from the data? I am not entirely satisfied with the conclusions you have drawn.Percentages are just as accurate, you'll find those on Page 13 along with power numbers.Reply
-
bdizzle11 For next SBM how about a $800, $1200, $1600. A little bit higher but more spread. I think that would better determine the sweet spot...Reply -
atomicWAR Honestly i would like to see an up-graders marathon. With price points of 600, 800, 1000, 1300, 1600, 2000 covered all using the same case, CD/dvd, and mech HDD (not included in cost). Those are the most common carry over parts besides my water-cooling that carries over build to build. I believe it would be a very useful and realistic application of funds many of your readers could relate to.Reply


