Corsair RM750i Power Supply Review
Corsair is revamping its RM line, adding the letter "i" to highlight a more advanced digital interface — today we check out the RM750i.
Why you can trust Tom's Hardware
Cross-Load Tests And Infrared Images
Our cross-load tests are described in detail here.
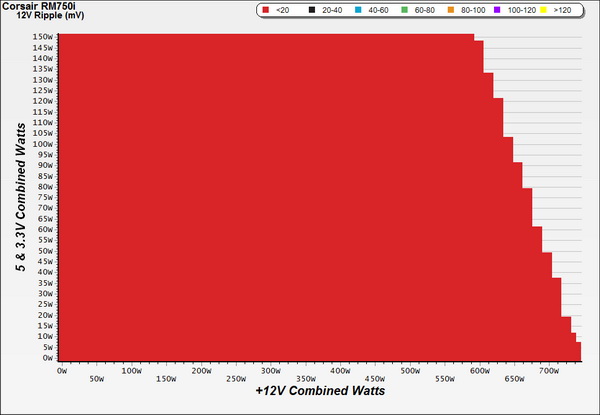
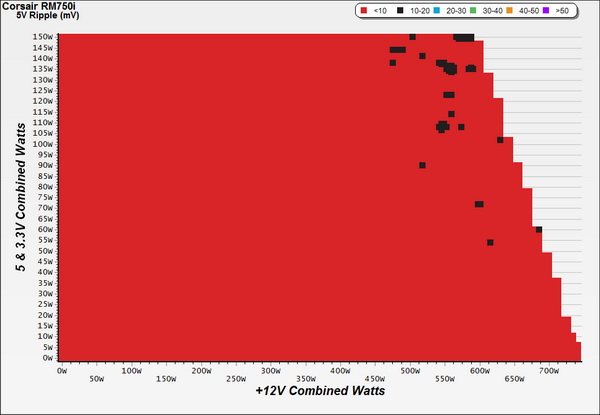
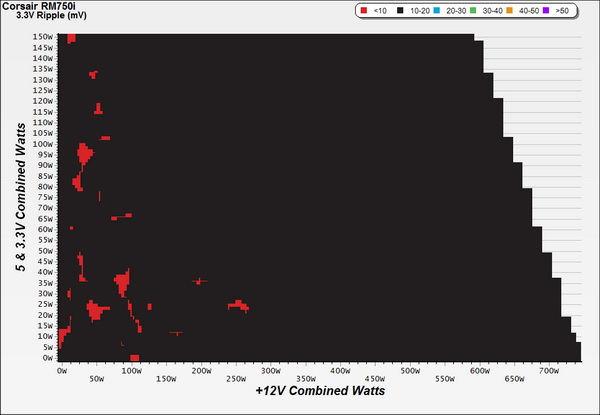
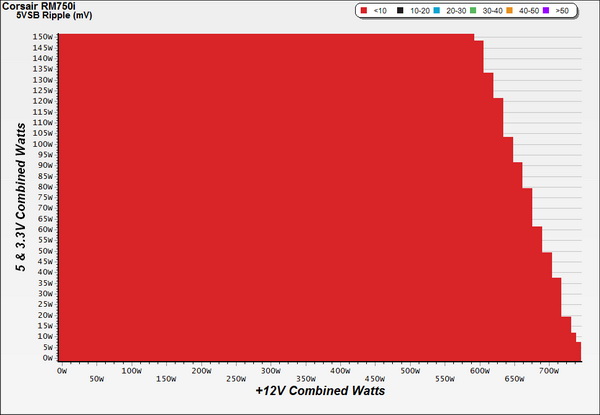
To generate the following charts, we set our loaders to auto mode through our custom-made software before trying more than 1,000 possible load combinations with the +12V, 5V and 3.3V rails. The load-regulation deviations in each of the charts below were calculated by taking the nominal values of the rails (12V, 5V and 3.3V) as point zero.
Load Regulation Charts
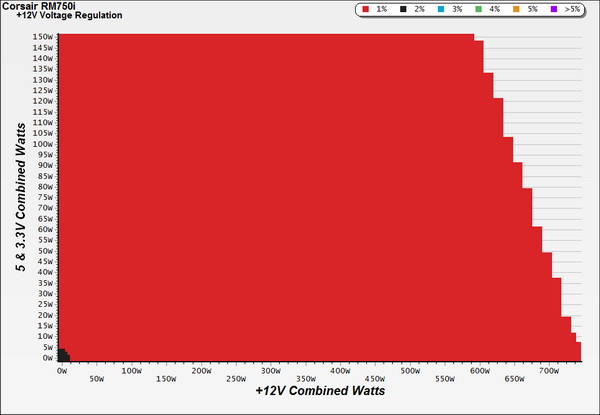
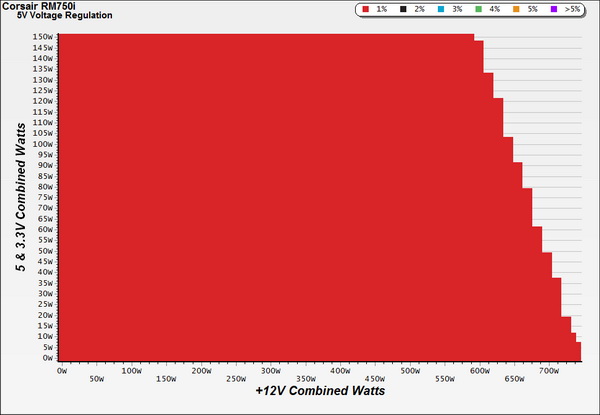
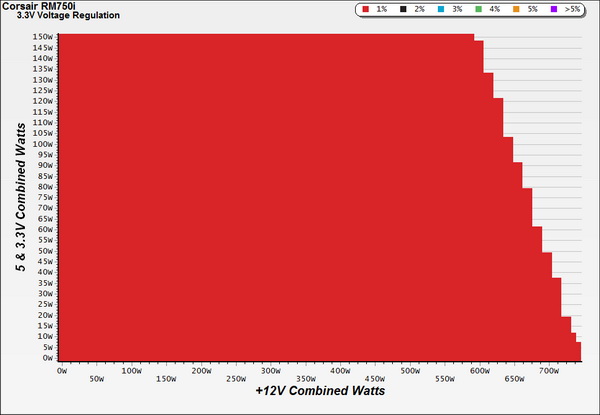
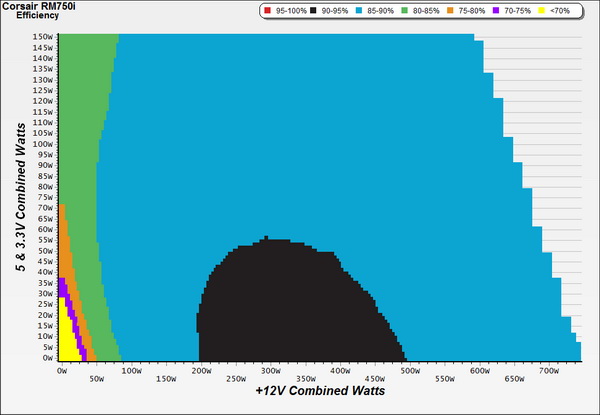
Efficiency Chart
Ripple Charts
Infrared Images
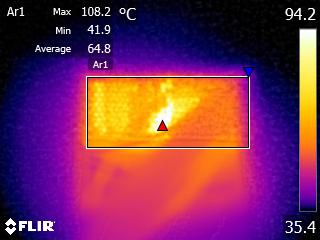
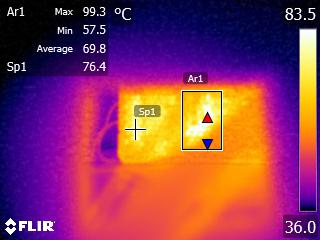
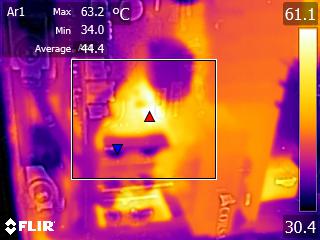
Toward the end of the hot-box tests, we took some photos of the PSU with our modified FLIR E4 camera that delivers 320x240 IR resolution (76,800 pixels).
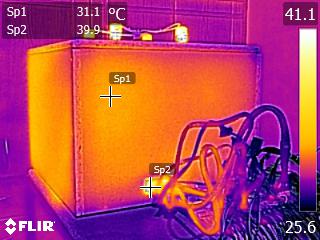
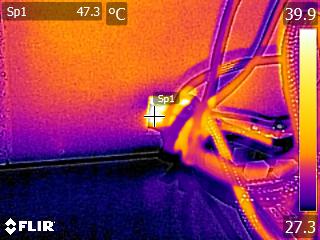
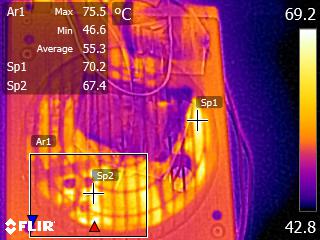
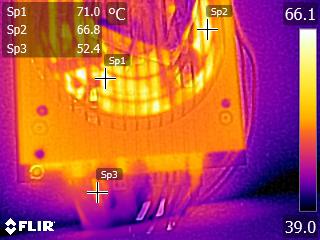
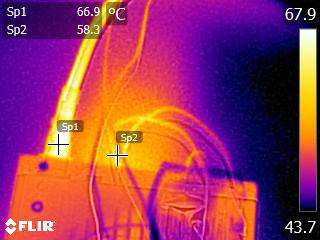
The thermal images shown above were taken during the overload test with an ambient temperature exceeding 47 C (116 F). As you can see, the temperature levels of the RM750i's internals were very high.
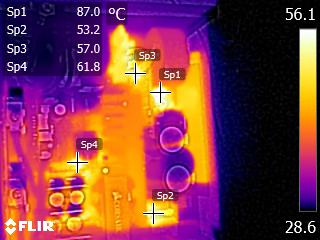
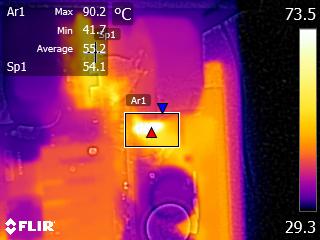
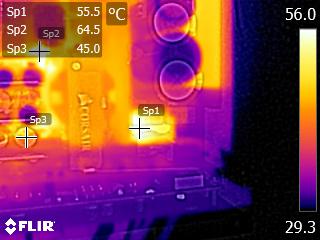
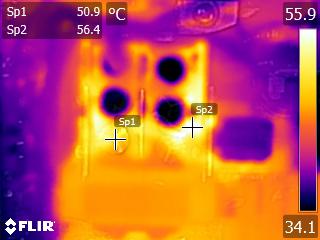
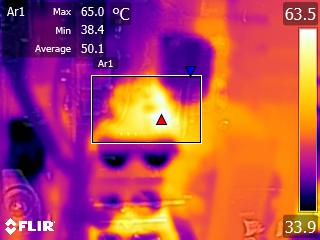
We also took some thermal images with the top cover removed and at 28 C (82 F) ambient temperature, with the PSU delivering 50 percent of its max-rated capacity for 10 minutes. We followed the above procedure simply out of curiosity, since we wanted to check how hot the +12V FETs would get, given the lack of an actual heat sink. As you will see, their temperatures stayed at low levels (65 C, or 149 F) taking into account the fanless operation. The very high operating temperature (90 C, or 194 F) of the NTC thermistor made quite an impression on us. On one hand, this means that very low energy levels are lost on it, since the higher its temperature, the lower its resistance. However, in a hot restart and with the APFC caps fully discharged, it won't provide efficient protection against large inrush currents.
Get Tom's Hardware's best news and in-depth reviews, straight to your inbox.
Current page: Cross-Load Tests And Infrared Images
Prev Page Efficiency, Temperature And Noise Next Page Transient Response Tests
Aris Mpitziopoulos is a contributing editor at Tom's Hardware, covering PSUs.
-
Luay ArisReply
Thanks for the thorough review.
The RM750i does beat the G2 750 at $10 more, which is a good trade for a mpore quite operation, and is $20 cheaper than the Snow Silent 750, but how does it compare to the $10 more expensive P2 750? -
Aris_Mp I am sorry but I haven't reviewed the P2 750 model yet. However since it is Platinum it should be compared with the HX750i.Reply -
Luay No I'm comparing it based on price.Reply
Since the gold rated RM750i and the platinum P2 750 are $10 apart, excluding the rebate, and as Jonny (The Jonny??) said, a few %s of efficiency isn't as important to me as something as tangible as emitting noise. -
Dan414 This seems like the droids/PSU I've been looking for. That or maybe the 850i. Also, I like the white lettering - that way it will match my case no matter what lighting I have inside.Reply -
synphul I'm confused, there's no other product that compares to the corsair rm750i except the evga g2 750 and the seasonic snow silent 750 which is a higher category and price. Yet isn't that the ss-750km3 sitting at $10 cheaper?Reply
Cwt may be improving but it's not ss quality. Hard to face the two off when they're so close in price or the seasonic is cheaper. I fail to see how it's a better option than the competition. A better option than their own lineup maybe, but that's not saying a ton.
I suppose it's true it comes with corsair link, though with psu's already this quiet not sure the need is there to control the fan beyond active variable control built in and silent mode at low draw. I've never needed to monitor my psu temp or control the fan speed even on a plain old active fan design. Comes off as a bit gimmicky to try and create added value. Don't get me wrong, this would be nice on an otherwise loud psu with no fan control and no silent operation mode at all but in the face of being quiet and having variable/silent fan operation it's a little redundant.
Idk, like I said it's nice to see they're trying to improve quality in some areas but they don't even come in under the competition. As of right now they're more expensive than the competition. Personally I'll stick with seasonic. -
trifler If any PSU companies read this, I want to see molex discontinued, at least on the non-modular power supplies. At least offer some power supplies that don't have molex.Reply -
fil1p It's good to see that all the caps a Japanese on this one. I like Corsair PSUs, but the last gen RM series had some lower quality caps in there, which quite frankly shouldn't have been in an enthusiast PSU at that price point in the first place.Reply -
jonnyguru Reply16336613 said:Cwt may be improving but it's not ss quality.
How do you know? ;-)
16336613 said:I suppose it's true it comes with corsair link, though with psu's already this quiet not sure the need is there to control the fan beyond active variable control built in and silent mode at low draw. I've never needed to monitor my psu temp or control the fan speed even on a plain old active fan design.
You can also monitor voltages and load and calculate efficiency. So it does a lot more than what you're stating.
