EVGA SuperNOVA 850 P2 Power Supply Review
EVGA recently enriched its P2 line with three new members, featuring 650W, 750W and 850W capacities. All three, like the other P2 models, are made by Super Flower and feature Platinum efficiency. Today we're testing the 850 P2.
Cross-Load Tests And Infrared Images
Our cross-load tests are described in detail here.
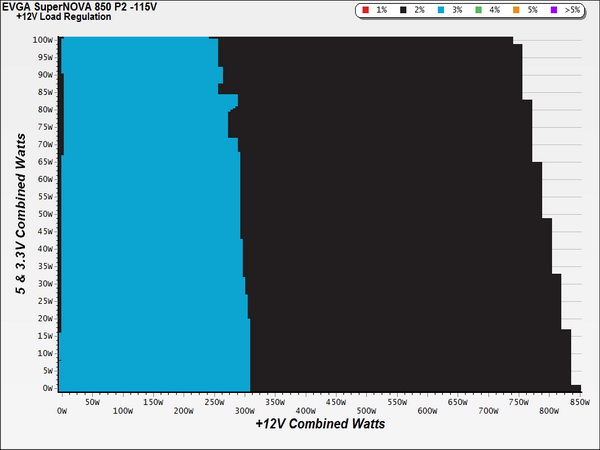
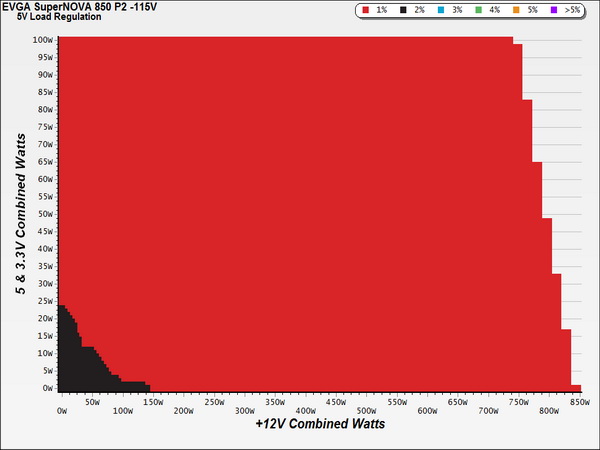
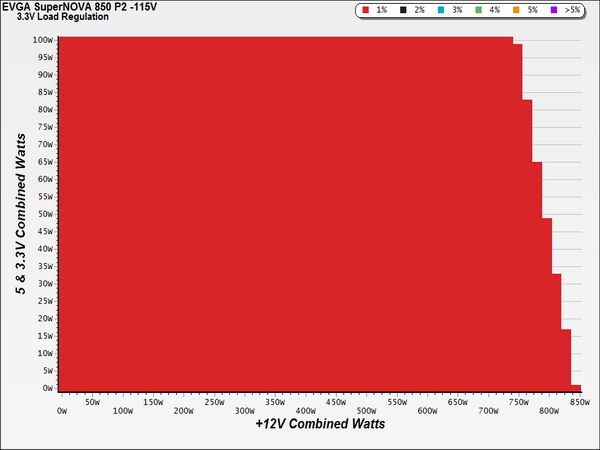
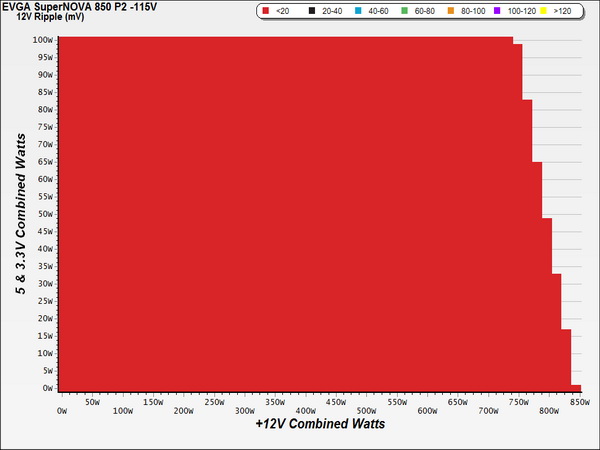
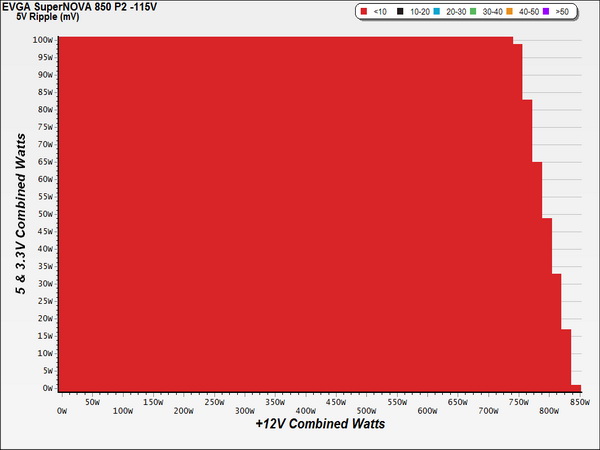
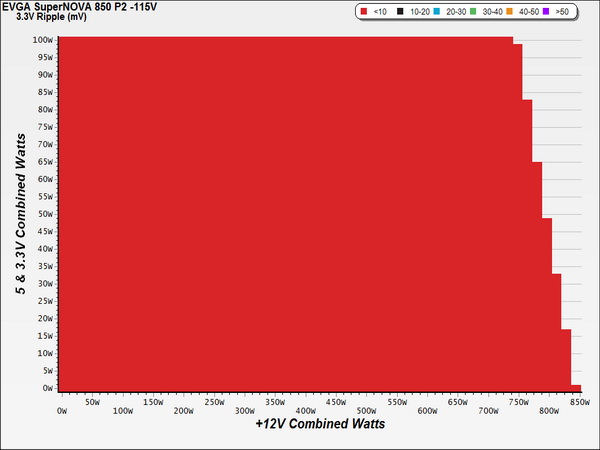
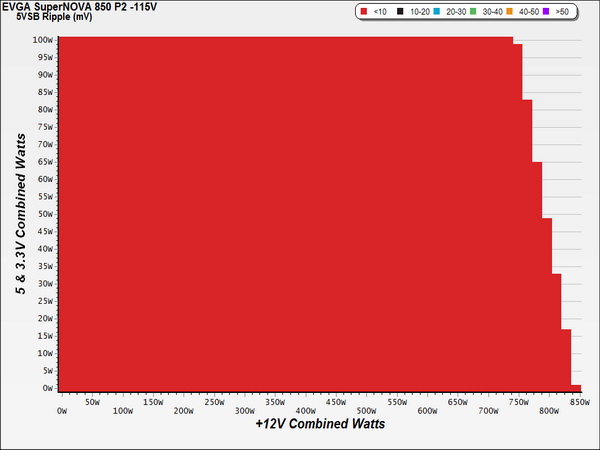
To generate the following charts, we set our loaders to auto mode through our custom-made software before trying more than 1500 possible load combinations with the +12V, 5V and 3.3V rails. The load regulation deviations in each of the charts below were calculated by taking the nominal values of the rails (12V, 5V and 3.3V) as point zero.
Load Regulation Charts
Efficiency Chart
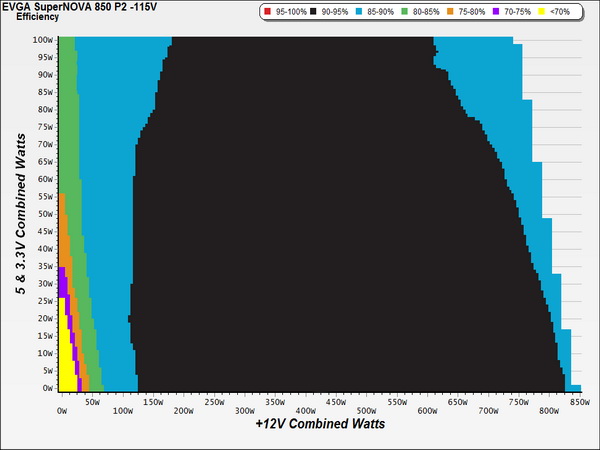
This is an efficient Platinum-rated unit, which the graph above shows. For much of this PSU's operating range, efficiency is above 90 percent. If you want to lower your electricity bills to save some money and a Titanium-class PSU is out of your budget, then the 850 P2 will do the job just fine at a lower price point.
Ripple Charts
Infrared Images
Toward the end of the cross-load tests, we took some photos of the PSU with our modified FLIR E4 camera that delivers 320x240 IR resolution (76,800 pixels).
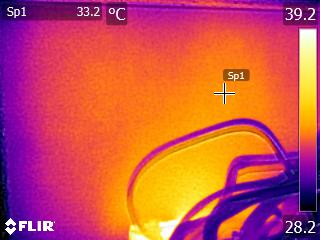
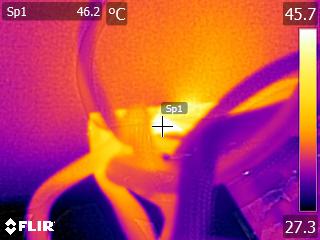
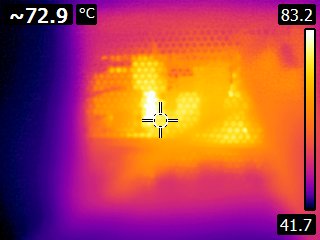
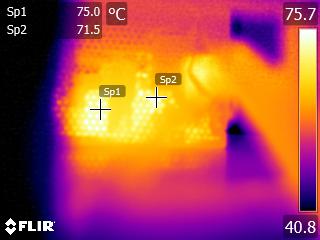
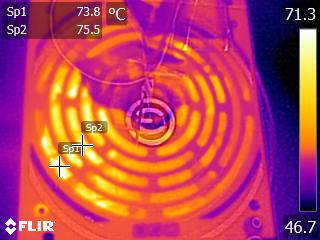
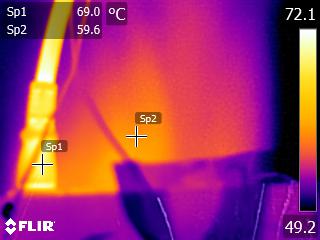
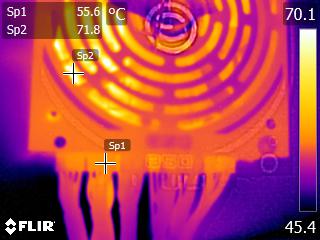
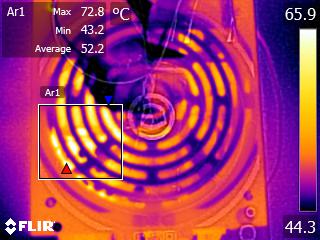
The IR camera showed that the APFC coil's temperature is around 75 °C, while the bridge rectifier operates at lower than 70 °C, despite the full load and 49 °C temperature inside the hotbox.
Even under these tough conditions, the filtering capacitors on the secondary side are only close to 60 °C. Given their specs, and with the help of the cap life formula, which you can find in our PSU 101 article, we estimate they'll last close to six years under continuous full load operation at 49 degrees. That's a long time for such an extreme hypothetical application.
Get Tom's Hardware's best news and in-depth reviews, straight to your inbox.
Current page: Cross-Load Tests And Infrared Images
Prev Page Efficiency, Temperature And Noise Next Page Transient Response Tests
Aris Mpitziopoulos is a contributing editor at Tom's Hardware, covering PSUs.
-
JQB45 ReplyWhy can't US use 220v, man so much more efficient.
Tradition... There is nothing (I believe) stopping you from running a 220v circuit. I know we have one 20amp NEMA circuit in this house specificity for the computer room. Its not common to see those in house holds either. -
cliffro Reply17550218 said:Tier-1 but on the low end of Tier-1 due to its hold up time.
Scores a 9.7 on Jonnyguru, but is low end of tier 1 got it.
I like Tom's in general, been coming here since Tom was actually doing reviews, but I'll take JonnyGuru's(or Oklahoma Wolf) word that this is an awesome PSU, it scored 10 of 10's in all but Value, where a couple of similar quality PSU were a tad cheaper.
I've got the G2 model(thanks to their review of it) and couldn't be happier with it. Well other than they now have Platinum and Titanium versions and would prefer one of those. But 80+ Gold is still good enough for me. -
powernod Reply17550218 said:Tier-1 but on the low end of Tier-1 due to its hold up time.
Scores a 9.7 on Jonnyguru, but is low end of tier 1 got it.
I like Tom's in general, been coming here since Tom was actually doing reviews, but I'll take JonnyGuru's(or Oklahoma Wolf) word that this is an awesome PSU, it scored 10 of 10's in all but Value, where a couple of similar quality PSU were a tad cheaper.
I've got the G2 model(thanks to their review of it) and couldn't be happier with it. Well other than they now have Platinum and Titanium versions and would prefer one of those. But 80+ Gold is still good enough for me.
Well, i think that you don't pay that much attention to Jonnyguru.com, as much as you claim.
Look here, at Jonny's tier list, and notice what tier is the EVGA's P2 line :
http://www.jonnyguru.com/forums/showthread.php?t=12947
-
dstarr3 ReplyWhy can't US use 220v, man so much more efficient.
The same reason so many regions have different plug types. They all designed these things before anyone had the idea to standardize these things across regions, and by now it's an incredible amount of work to have to redesign the infrastructure of entire countries. -
Adhmuz ReplyWhy can't US use 220v, man so much more efficient.
"Technology, current at the time of US electrification, locked the US into 110, then 120 volt outlets. Europe's electrification came later, and proceeded in response to advanced technology. The US was too deep into the 110/120 volt infrastructure to upgrade."
Gotta hand it to the Americans for inventing the concept of the grid and power distribution to the masses, they did it first, and Edison's equipment at the time ran best on 110v so it was the obvious choice. Currently it's at 120v, this was changed in the 50s. Don't forget houses are supplied with 240v, this is what runs our hot water heaters, ovens and air conditioners. Just the old way is still too set in stone to be changed, not to mention 120v is safer for human exposure (a shock from a 120v outlet is much less dangerous than that of a 240v outlet, having experienced the 120v shock I can't imagine how painful a 240v would be) -
10tacle Reply17552491 said:Just the old way is still too set in stone to be changed, not to mention 120v is safer for human exposure (a shock from a 120v outlet is much less dangerous than that of a 240v outlet, having experienced the 120v shock I can't imagine how painful a 240v would be)
Yep...I was popped by a 220v 3-prong washing machine plug wire that arced some two decades ago (when it was still known as a 220v power connection) and it knocked me on my butt. It makes getting hit by 120v (used to be 110v), which I've also experienced more recently, seem like carpet static electricity.
-
cliffro Reply17552081 said:17550218 said:Tier-1 but on the low end of Tier-1 due to its hold up time.
Scores a 9.7 on Jonnyguru, but is low end of tier 1 got it.
I like Tom's in general, been coming here since Tom was actually doing reviews, but I'll take JonnyGuru's(or Oklahoma Wolf) word that this is an awesome PSU, it scored 10 of 10's in all but Value, where a couple of similar quality PSU were a tad cheaper.
I've got the G2 model(thanks to their review of it) and couldn't be happier with it. Well other than they now have Platinum and Titanium versions and would prefer one of those. But 80+ Gold is still good enough for me.
Well, i think that you don't pay that much attention to Jonnyguru.com, as much as you claim.
Look here, at Jonny's tier list, and notice what tier is the EVGA's P2 line :
http://www.jonnyguru.com/forums/showthread.php?t=12947
This is the summary for my EVGA 850 G2 (Tier 2 according to his list, a WIP according to the post)
Performance
It scores a 9.9 of 10, and is somehow a Tier 2 according to that list. I have no clue as to what he is doing with his list on the forums. I cannot explain HOW a unit that scores 9.9 of 10 is anything less than Tier 1. There are some Corsair units that scored perfect 10's that are also listed as Tier 2 on it as well.
10
Functionality
10
Value
10
Build Quality
9.5
Total Score
9.9
Summary
Buy one. Do I really need to say anything else at this point? Once again, EVGA has something awesome here the competition can't seem to touch price wise. Performance? There are better units, yes. Not very many, but they exist. The real story here is how EVGA keeps managing to offer this kind of performance and still be more affordable than nearly everything else out there, and they have pretty much found perhaps the only OEM on Earth capable of doing it for them. It's got to be real nice being EVGA right now.
The Good:
outstanding ripple suppression
excellent voltage regulation
fully modular
semi-fanless mode
nice blacked out cablingThe Bad:
nothing at all
The Mediocre:
reviewing awesome units is getting dull... where's that gutless wonder in my pile? Second in line? Well, at least I'm guaranteed something interesting in all the wrong ways in a couple weeks...
If it's scoring that close to 10, or an actual 10 (his highest score), it's a Tier 1 to me. And I'd never second guess buying one regardless of brand. -
Amdlova you guys cry like a baby. i use 227v on the computer no ground. with a multimeter can see about 45v on chassis its nice to touch it. i use a ps3 power supply to drive a 400w car amplifier and the psu barely get warm, no fan only passive cooler. 127v as no good use anymore on non days.Reply
