HP ZR2740w Versus Asus PB278Q: QHD 27" Monitors, Tested
Until cutting-edge UHD (3840\00d72160) displays hit the mainstream, most enthusiasts have to be content with QHD monitors at 2560x1440 pixels. In the lab today, we have two more 27-inch QHD screens: the ZR2740w from HP and the PB278Q from Asus.
Results: Gamma And ANSI Contrast Ratio
Gamma is the measurement of luminance levels at every step in the brightness range from 0 to 100 percent. This is important because poor gamma can either crush detail at various points or wash it out, making the entire picture appear flat and dull. Correct gamma produces a more three-dimensional image, with greater depth and pop. Meanwhile, incorrect gamma can negatively affect image quality, even in monitors with high contrast ratios.
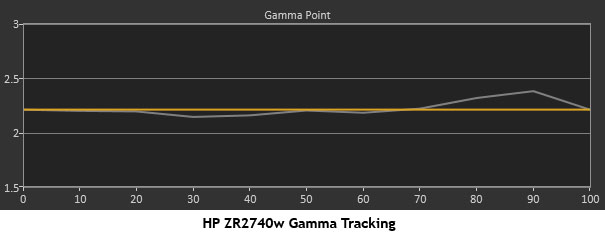
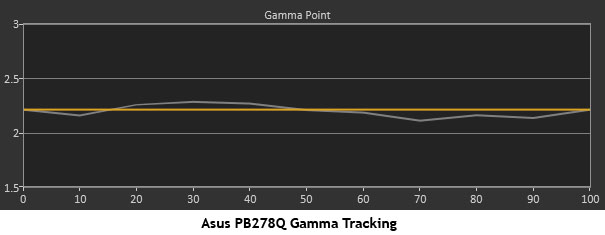
In the gamma charts below, the yellow line represents 2.2, which is the most widely-accepted standard for television, film, and computer graphics production. The closer the white measurement trace comes to 2.2, the better.
HP ZR2740w
The ZR2740w displays nearly perfect gamma tracking. Aside from a microscopic dip at 30 percent, and a slightly larger hump at 90 percent, it hugs the 2.2 mark very closely. The 90 percent measurement represents an output deficiency of less than 3 cd/m2; an invisible error. We measured the gamma at several brightness levels and achieved the same results regardless of the setting.
Asus PB278Q
The PB278Q also measures well in the gamma tracking test. The deviations seen in the chart are extremely minor, representing, at most, a five percent variation in light output. Like the HP, these errors are invisible to the naked eye.
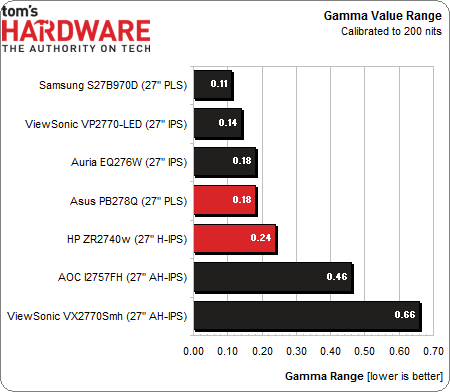
The gamma value range shows the quality of tracking from zero to 100 percent. A flatter gamma trace is obviously more desirable. This chart shows the distance between the highest and lowest gamma values. A smaller number indicates better tracking from minimum black to maximum white.
Get Tom's Hardware's best news and in-depth reviews, straight to your inbox.
Both panels finish mid-pack in this test, although they are quite a bit closer to the leaders than they are the bottom two monitors. None of the screens in our chart display more than a tiny error. So, for all intents and purposes, the HP and Asus panels are close to the best we’ve measured.
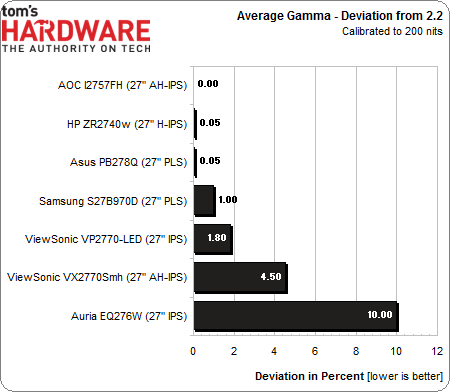
Beginning with the Auria EQ276W review, we’re expressing gamma error as a percent deviation from 2.2. This is the ideal value and will most closely match the mastered gamma of video, game, and business graphic content.
While the AOC I2757FH is still the leader with a perfect 2.2 gamma average, the HP and Asus monitors are less than one percent off the mark. You can see from the tracking charts above how slight the errors are. Essentially, both screens achieve perfection in this test.
ANSI Contrast Ratio
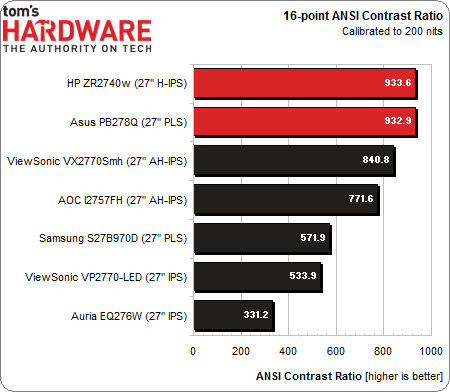
Another important measure of contrast is ANSI. To perform this test, a checkerboard pattern of sixteen 0 and 100 percent squares are measured. This is somewhat more real-world than on/off measurements because it tests a display’s ability to simultaneously maintain both low black and full white levels, which also factors in screen uniformity. The average of the eight full-white measurements is divided by the average of the eight full-black measurements to arrive at the ANSI result.
Given the superb on/off contrast numbers posted by both of today’s monitors, it’s no surprise to see them take the ANSI contrast crown, too. The ViewSonic VX2770Smh and AOC I2757FH are both only FHD displays, making the Samsung the next-best QHD monitor. For HP and Asus to post nearly double its ANSI contrast measurement is pretty impressive. In real-world viewing, this translates to greater image depth and more visible detail at the both extremes of the brightness range.
Current page: Results: Gamma And ANSI Contrast Ratio
Prev Page Results: Calibrated Brightness And Contrast Next Page Results: Grayscale Tracking
Christian Eberle is a Contributing Editor for Tom's Hardware US. He's a veteran reviewer of A/V equipment, specializing in monitors. Christian began his obsession with tech when he built his first PC in 1991, a 286 running DOS 3.0 at a blazing 12MHz. In 2006, he undertook training from the Imaging Science Foundation in video calibration and testing and thus started a passion for precise imaging that persists to this day. He is also a professional musician with a degree from the New England Conservatory as a classical bassoonist which he used to good effect as a performer with the West Point Army Band from 1987 to 2013. He enjoys watching movies and listening to high-end audio in his custom-built home theater and can be seen riding trails near his home on a race-ready ICE VTX recumbent trike. Christian enjoys the endless summer in Florida where he lives with his wife and Chihuahua and plays with orchestras around the state.
-
KOKing I've had one of these HPs at work for a couple of months (replacing an early 24" 1920x1200 IPS), which I've set fairly low), but as this review says, it's not really necessary. I was a little disappointed that, possibly because of the aspect ratio change to 16:9, it doesn't _feel_ like a lot more screen real estate.Reply -
SIDDHARTH MISHRA Useless review, the uniformity on these screens is pathetic, tried three of each, the color temp difference across the screen is over 1000K. Toms has very poor reviewers, only prad.de and overclockers.ru do reliable screen reviews. And btw the U2713HM is regularly on sale for $500 or so, the ZR2740W is now an overpriced relic lacking even an OSD.Reply -
cangelini SIDDHARTH MISHRAUseless review, the uniformity on these screens is pathetic, tried three of each, the color temp difference across the screen is over 1000K. Toms has very poor reviewers, only prad.de and overclockers.ru do reliable screen reviews. And btw the U2713HM is regularly on sale for $500 or so, the ZR2740W is now an overpriced relic lacking even an OSD.Screen uniformity is covered on page eight, and low points on both screens are discussed.Reply -
flong777 Am I right by saying that the Asus monitor has more accurate color and better grayscale performance.Reply -
Marcus52 Surprised that the Asus has slightly better lag results, as one of the reasons for not having an OSD is to reduce lag, and it can make a big difference. Of course, how you measure lag can get different results, and I've seen much lower numbers for the ZR2740w:Reply
http://www.tftcentral.co.uk/reviews/hp_zr2740w_v2.htm
tftcentral is showing the HP as having far less lag than the Asus panel. -
ceberle The Asus certainly calibrates better than the HP; mainly because it can be calibrated. The HP is slightly better out of the box for grayscale and its chromaticity is also a touch better. Both screens have identical color to the eye. Only the instruments can tell the difference.Reply
Christian -
ceberle Regarding the lag results: It's hard to compare numbers from one review to another when the testing methods are so different. With our high-speed camera procedure, the only fair comparison is between the monitors we've tested. I would defend our response test as definitive though. Actually watching the screen draw in slow motion leaves no room for interpretation. The lag test is also consistent since we use the same signal chain for every screen. There is never a change in video cards, drivers, peripherals or any other device that might affect the result.Reply
Christian -
dgingeri I have the HP ZR2740w, and have for over a year now. It's a great looking monitor, and it performas well by my standards, but suffers from a significant lack of both reliability and support. HP's support is massively fragmented. It took me over three hours on the phone to get to the department that actually handled the support for this monitor. (It is a "Commercial" monitor, not business or personal. It's splitting hairs mighty thin, but that's the way HP's support is separated out.) When I finally got through, they sent a tech with a replacement monitor the next day. However, it also has two major hardware issues that render it useless when they occur. Most of the first run monitors had the power supplies die within months. The second run monitors had a serious issue with the control boards. All of them have issues with the USB hub, but it least the monitor keeps working if you don't have the USB cable plugged in. As an owner of one, I would not, under any circumstances, recommend this monitor to anyone.Reply
HP: the perfect example of a company falling apart because it is both too big and too fragmented.
