Why you can trust Tom's Hardware
Comparison Products
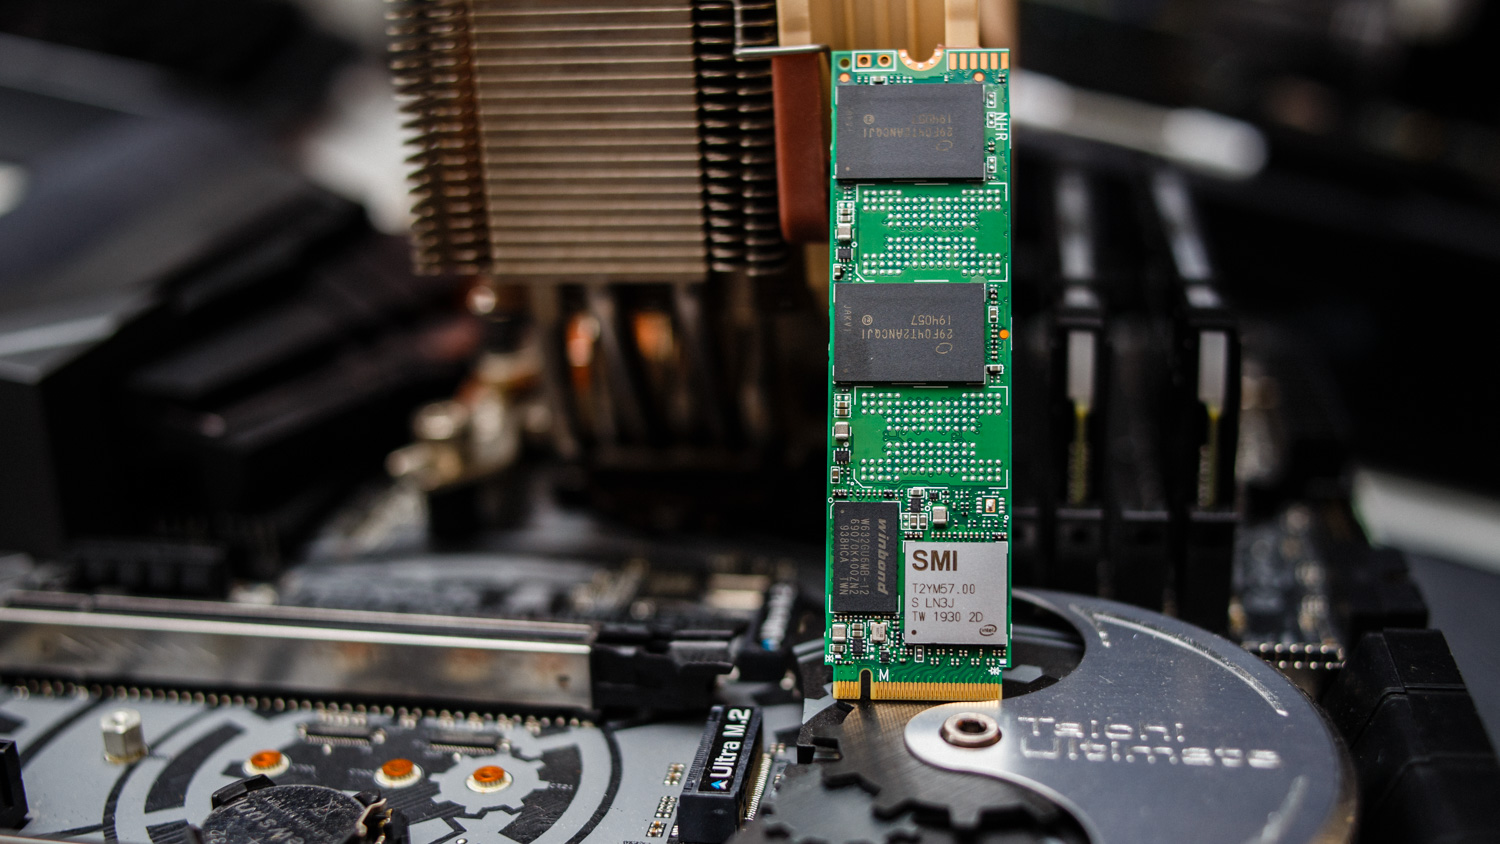
We put the Intel 665p up against its predecessor, the 660p, to see just how much Intel’s 6-series has improved. We also included Intel's most expensive consumer SSD yet, the Intel Optane 905P. We also threw in some direct competitors, too, with the Crucial P1 and WD’s Blue SN550.
To represent higher-end SSDs, we included the Samsung 970 EVO Plus, Adata XPG SX8200 Pro, and Corsair’s latest Force MP600, a PCIe Gen4 SSD. We also threw in a Crucial MX500 and WD Black HDD for good measure.
Game Scene Loading - Final Fantasy XIV
The Final Fantasy XIV StormBlood benchmark is a free real-world game benchmark that easily and accurately compares game load times without the inaccuracy of using a stopwatch.
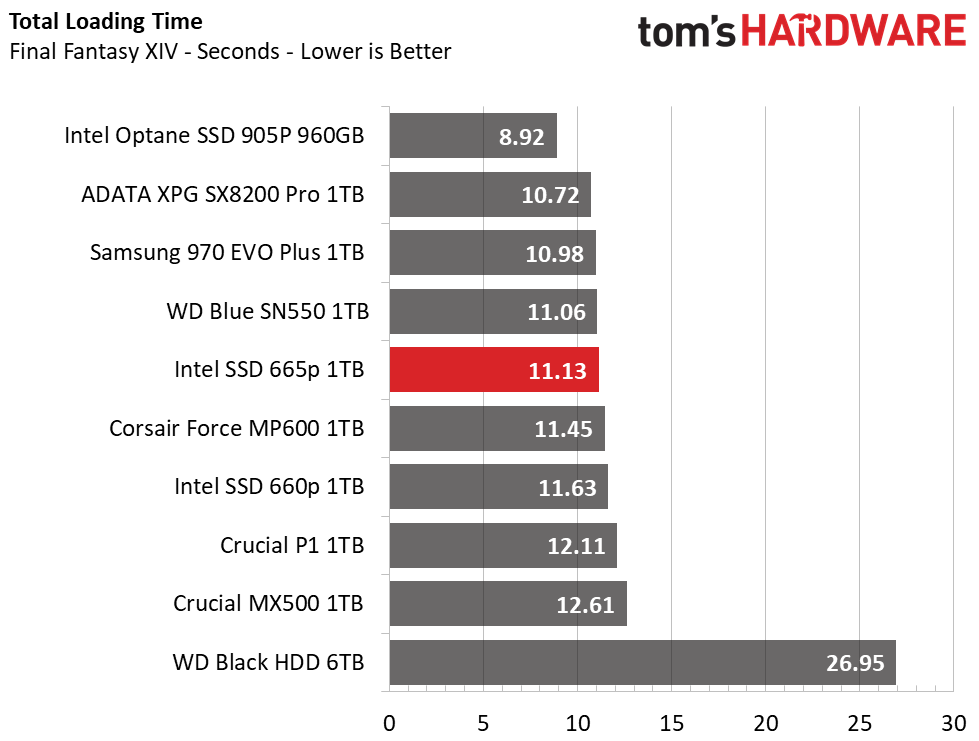
The Intel SSD 665p has improved load time performance with a total time that is exactly half a second faster than the 660p. Not groundbreaking, but it earns fifth place and is faster than the Corsair MP600 and Crucial P1.
System Restore – Macrium Reflect
A system clone or restoration isn’t something many people do often. But it can become a time-consuming task with slow storage devices like HDDs or entry-level SSDs - especially if you have a lot of data.
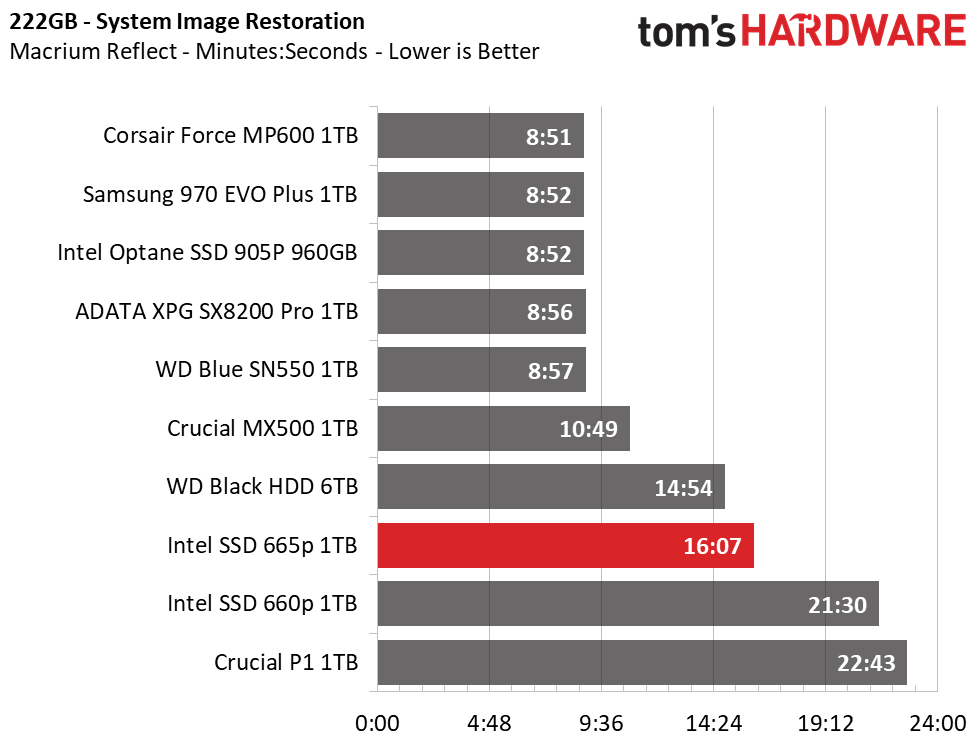
We don’t always include this test, but in the case of Intel’s 665p, we feel it is necessary. If you plan on cloning over or restoring a lot of data, the 665p will slow down more than other NVMe SSDs, but it is much faster than the previous-gen 660p (by over 5-minutes). Direct-to-QLC write performance looks improved, however. Notably, the HDD outperformed all three of the QLC SSDs in our comparison pool.
Transfer Rates – DiskBench
We use the DiskBench storage benchmarking tool to test file transfer performance with our own custom 50GB block of data. Our data set includes 31,227 files of various types, like pictures, PDFs, and videos. We copy the files to a new folder and then follow-up with a reading test of a newly written 6.5 GB file.
Get Tom's Hardware's best news and in-depth reviews, straight to your inbox.
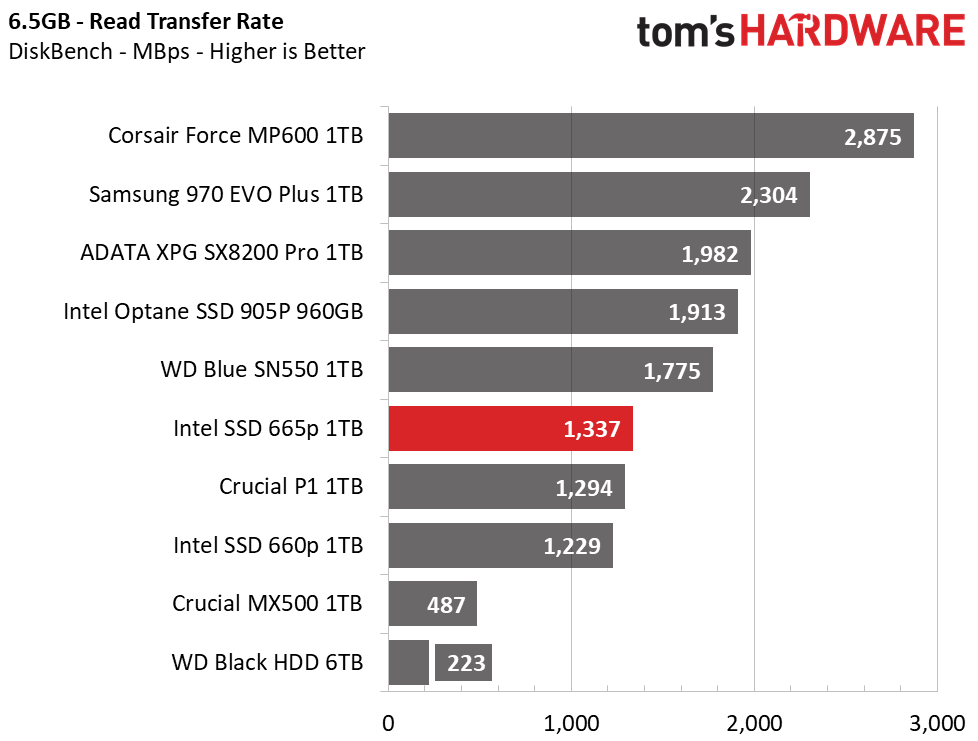
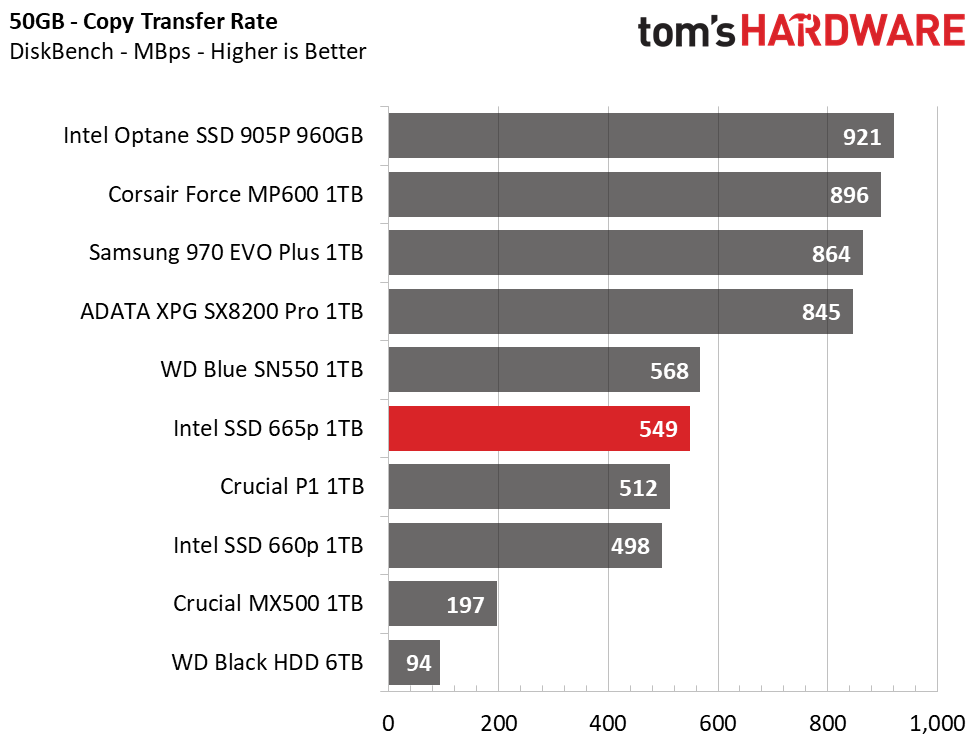
Intel’s SSD 665p lands in sixth place overall during a large-file reading test. The drive is slightly faster than the 660p, P1, MX500, and the HDD. WD’s Blue SN550 shows a clear advantage over it, however, and reads almost as fast as the Intel Optane 905p. During our file folder copy test, the Intel SSD 665p came in sixth place once again but narrowed the gap between it and the WD Blue SN550.
Trace Testing – PCMark 8 Storage Test 2.0
PCMark 8 is a trace-based benchmark that uses Microsoft Office, Adobe Creative Suite, World of Warcraft, and Battlefield 3 to measure the performance of storage devices in real-world scenarios.
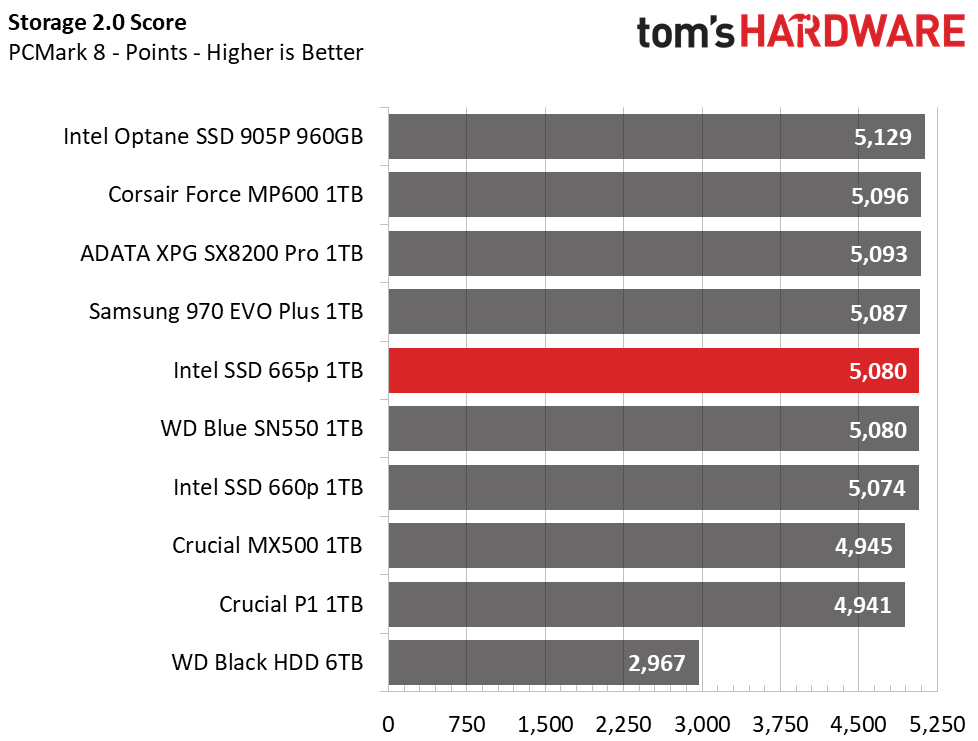
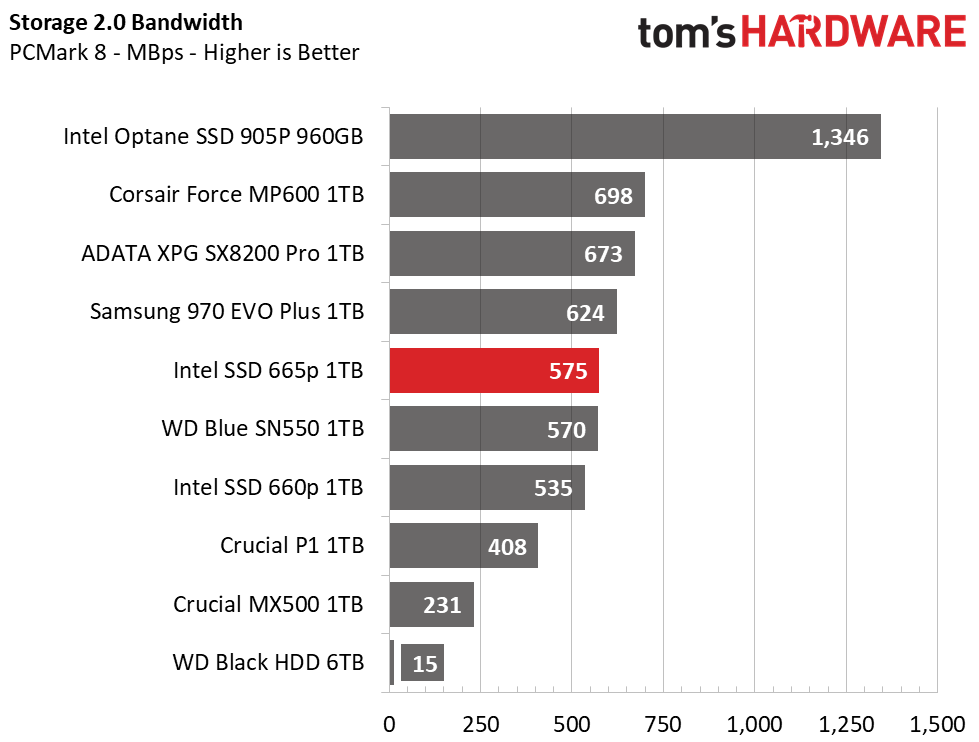
Intel’s SSD 665p trades blows with the WD Blue SN550: Both score 5080 points and average roughly 570 MBps of throughput. With scores like this, the 665p blows the HDD out of the water and provides a snappier experience than the MX500. It also closes the gap between entry-level SSDs and other higher-performance alternatives.
Trace Testing – SPECworkstation 3
Like PCMark 8, SPECworkstation 3 is a trace-based benchmark, but it is designed to push the system harder by measuring workstation performance in professional applications.
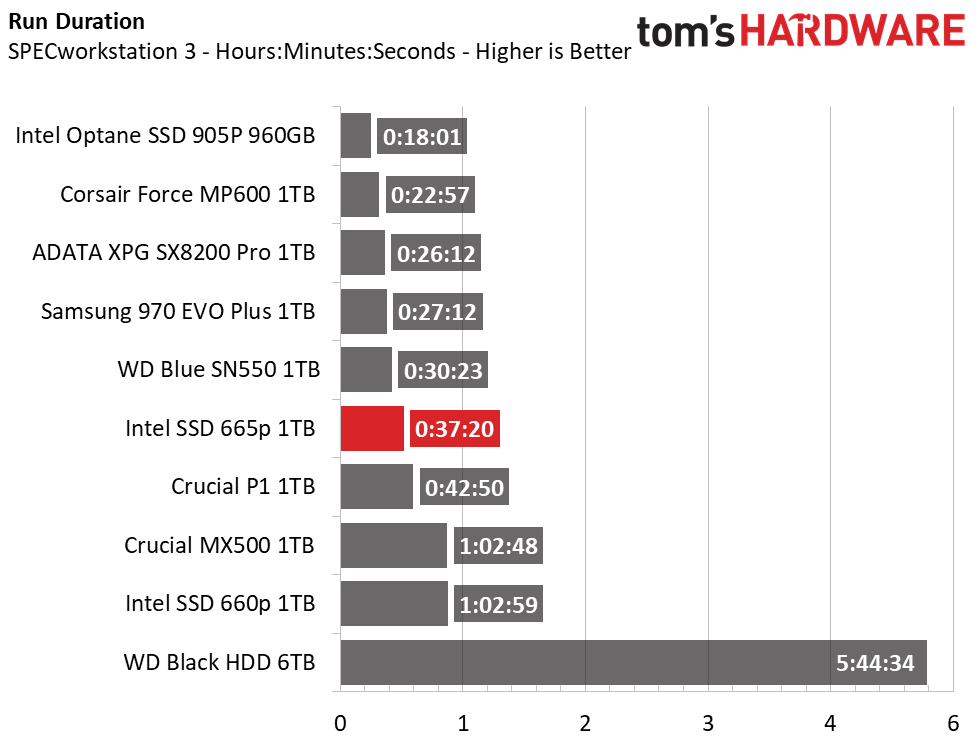
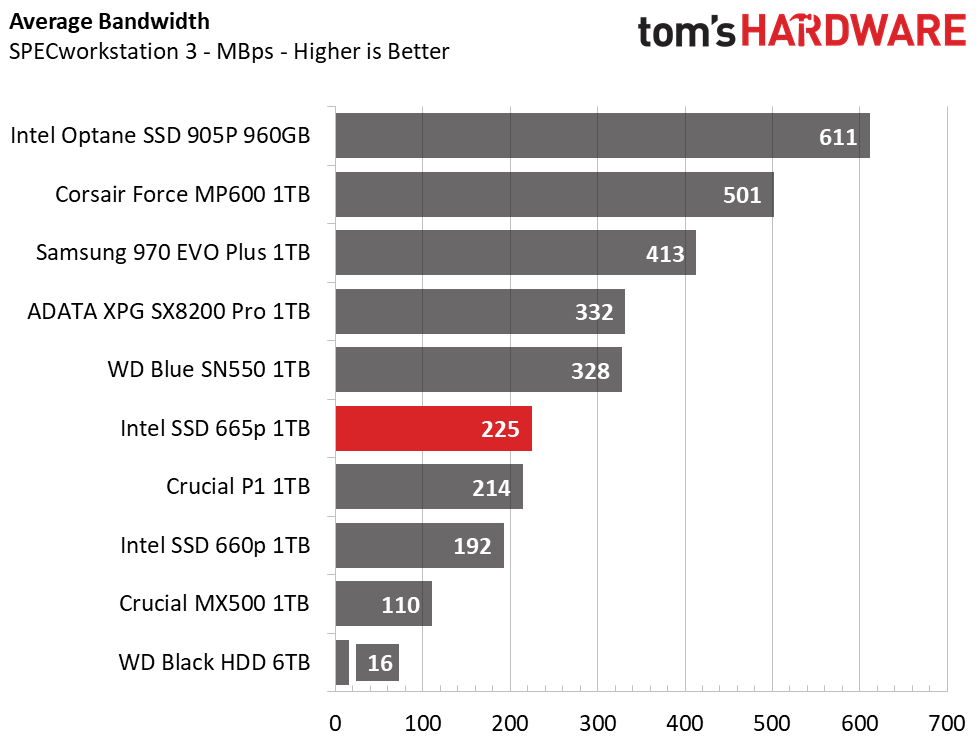
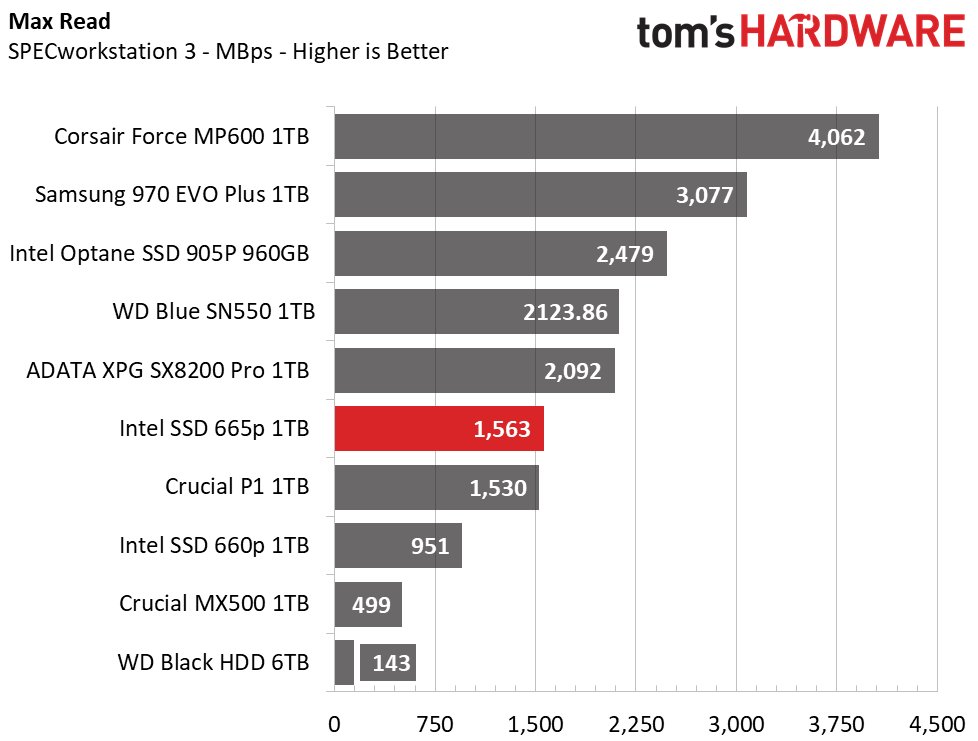
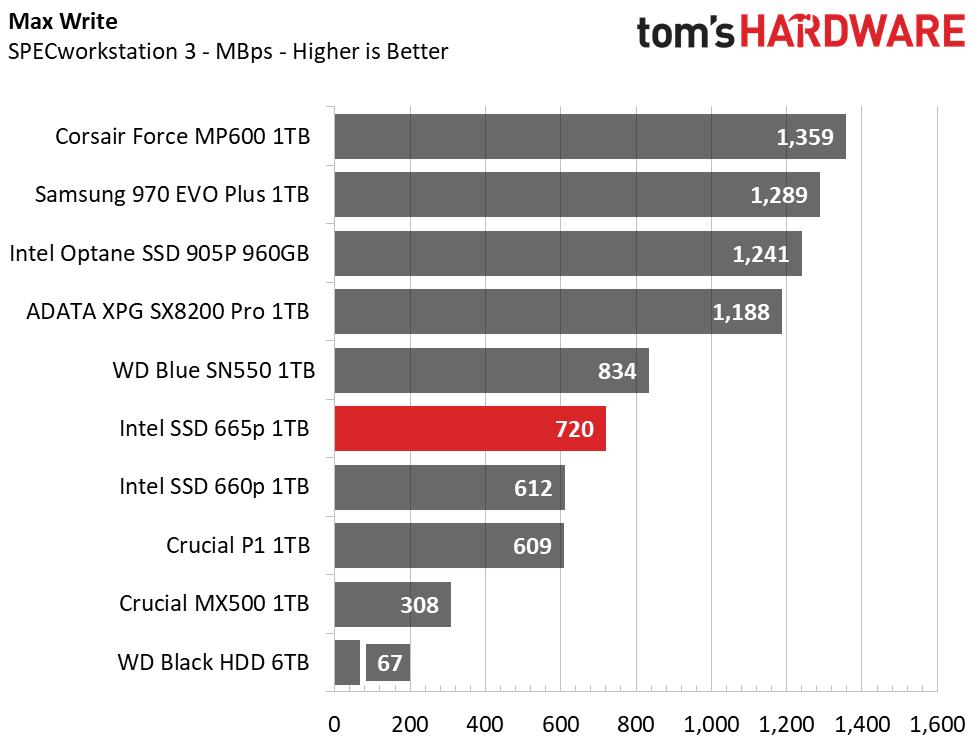
Intel’s 665p lands in sixth place, just behind the WD SN550. It is not the fastest SSD in the bunch, but even with QLC flash, it completes the test faster than the SATA SSD and is nearly twice as fast as the 660p. It absolutely dominates the HDD, with a completion time that is over 5 hours faster.
Synthetics - ATTO
ATTO is a simple and free application that SSD vendors commonly use to assign sequential performance specifications to their products. It also gives us insight into how the device handles different file sizes.
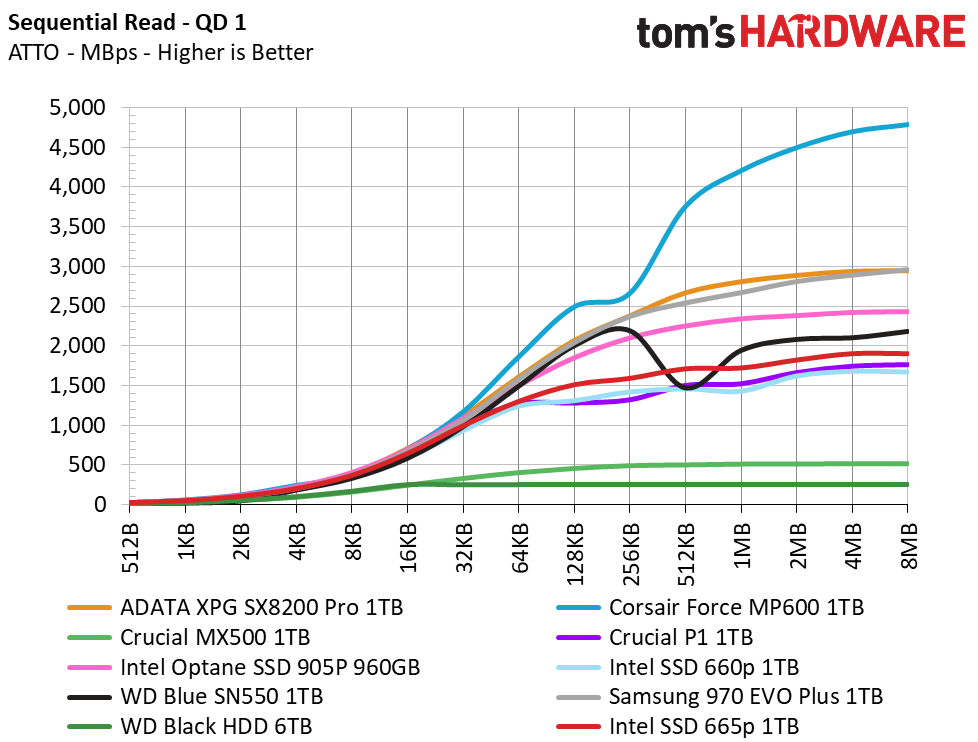

We tested Intel’s SSD 665p at a QD (queue depth) of 1 to represent most day-to-day file access at various block sizes. At small block sizes, the 665p rivals even Samsung’s 970 EVO in both reads and writes up to the 32KB size. Beyond that, it peaks at 1,900 MBps read and 1,840MBps write.
Synthetic Testing - iometer
iometer is an advanced and highly configurable storage benchmarking tool that vendors often use to measure the performance of their devices.
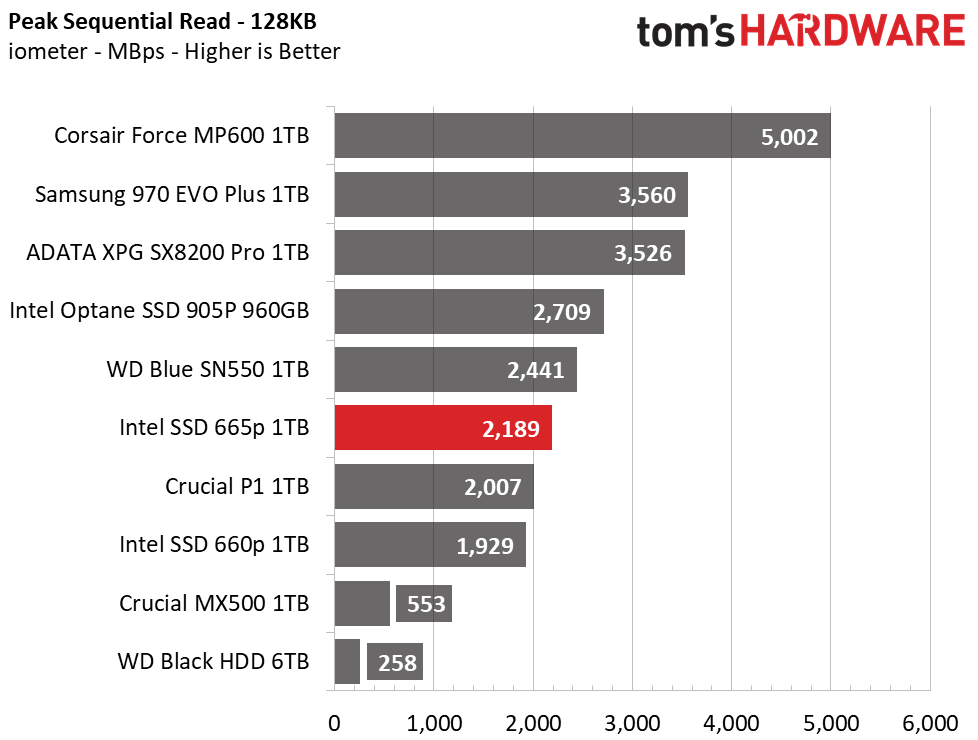
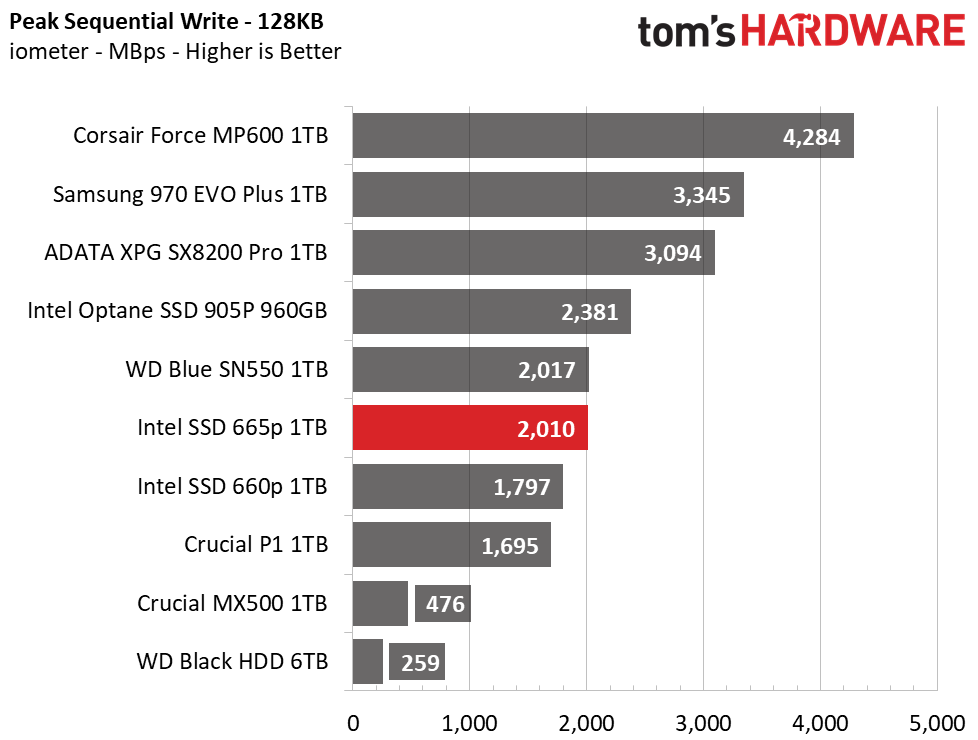
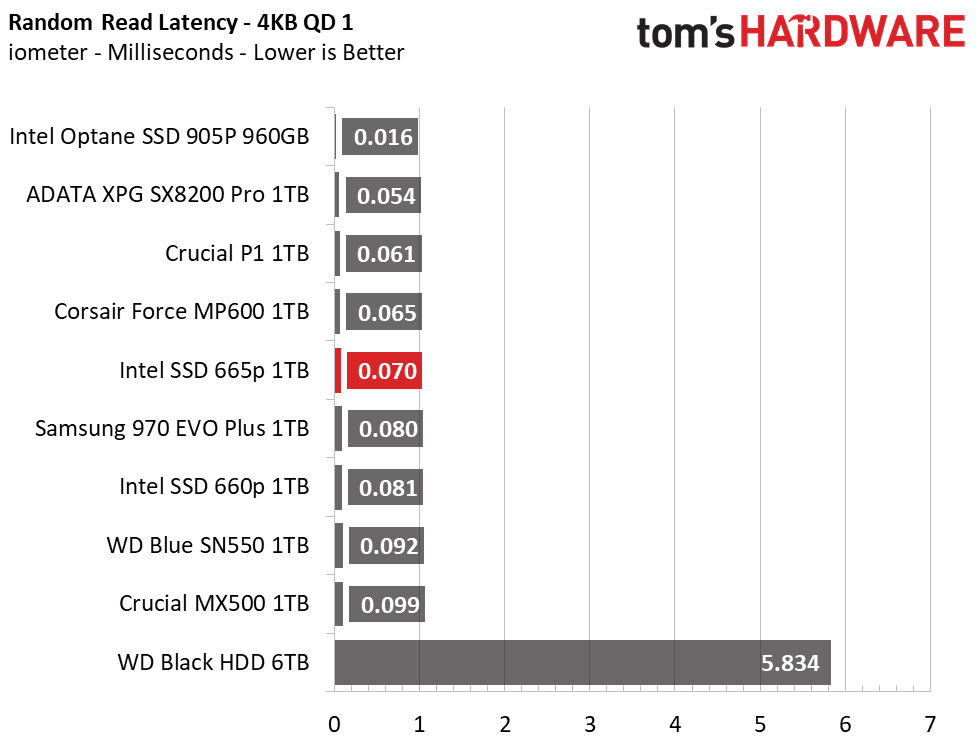
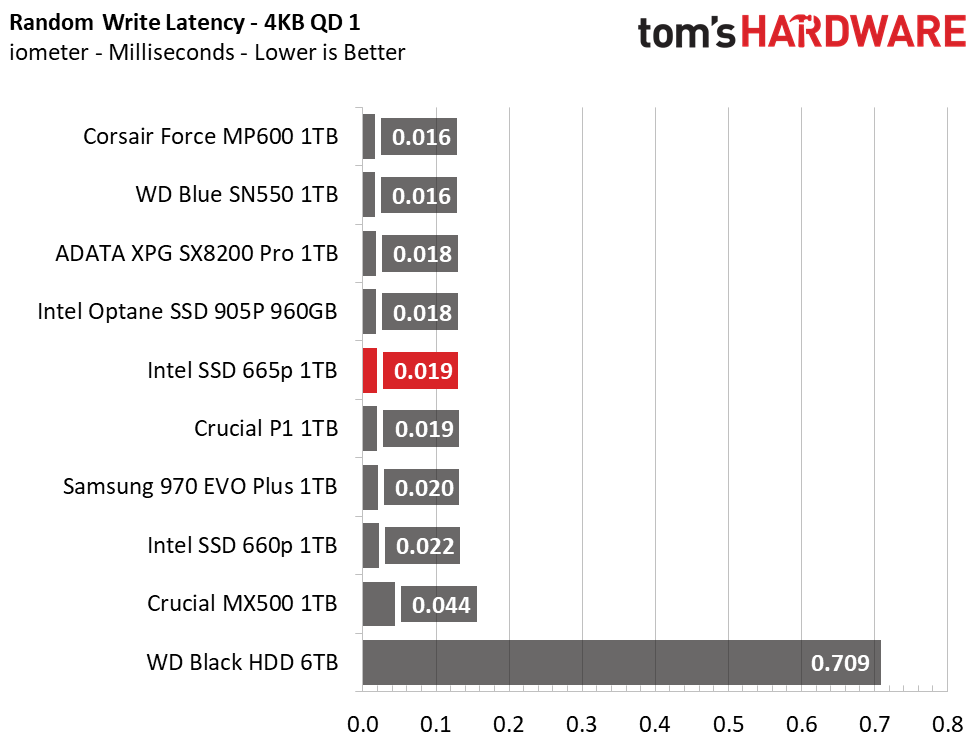
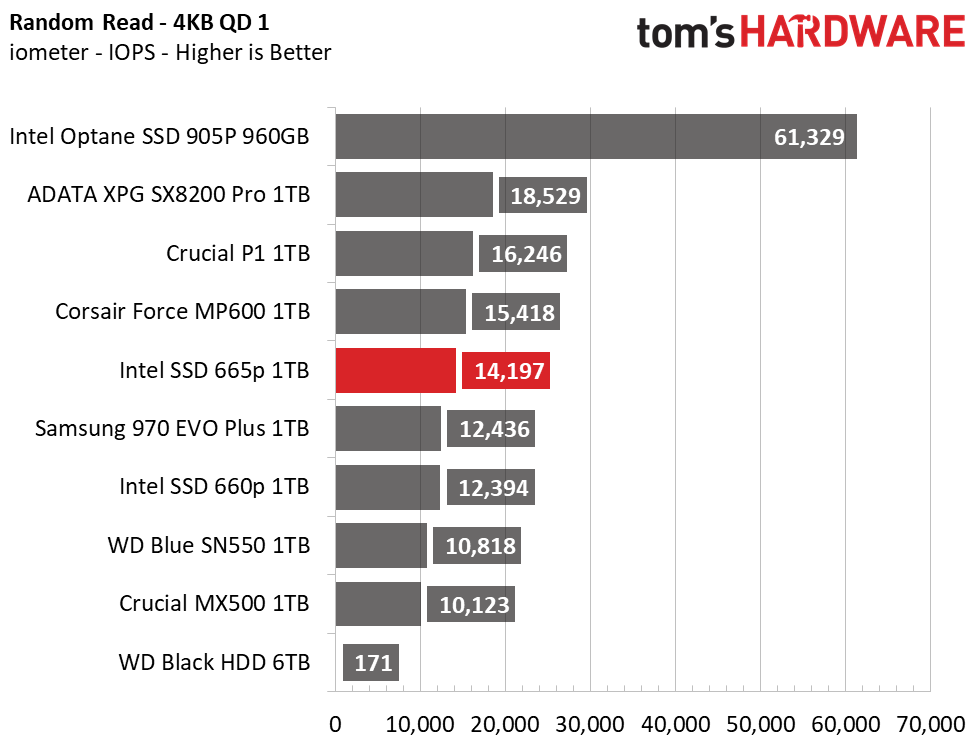
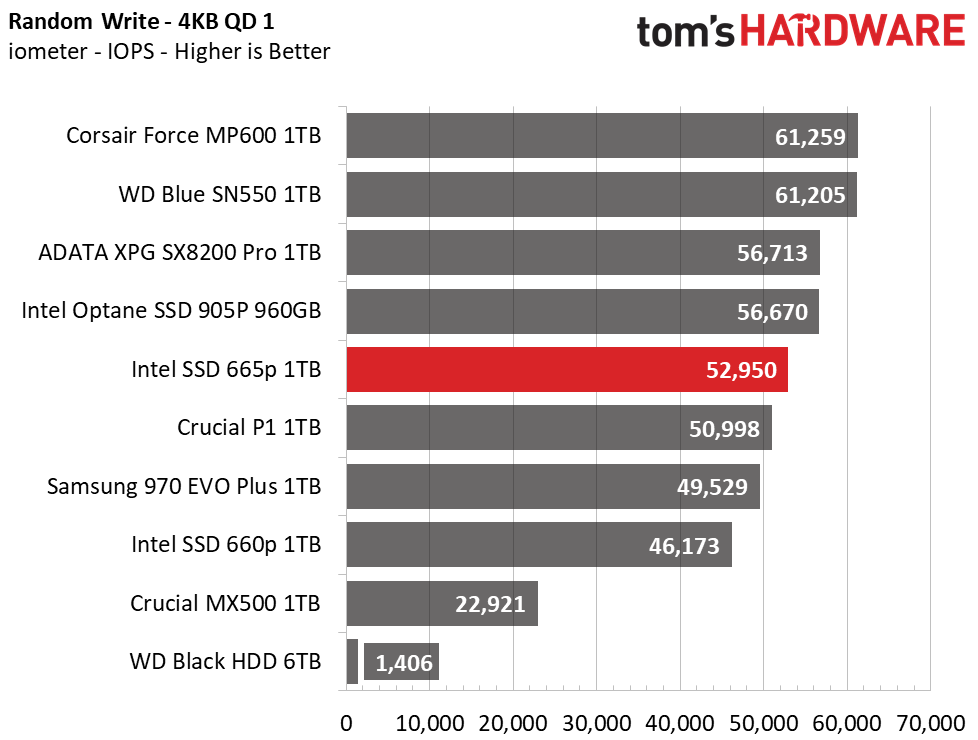
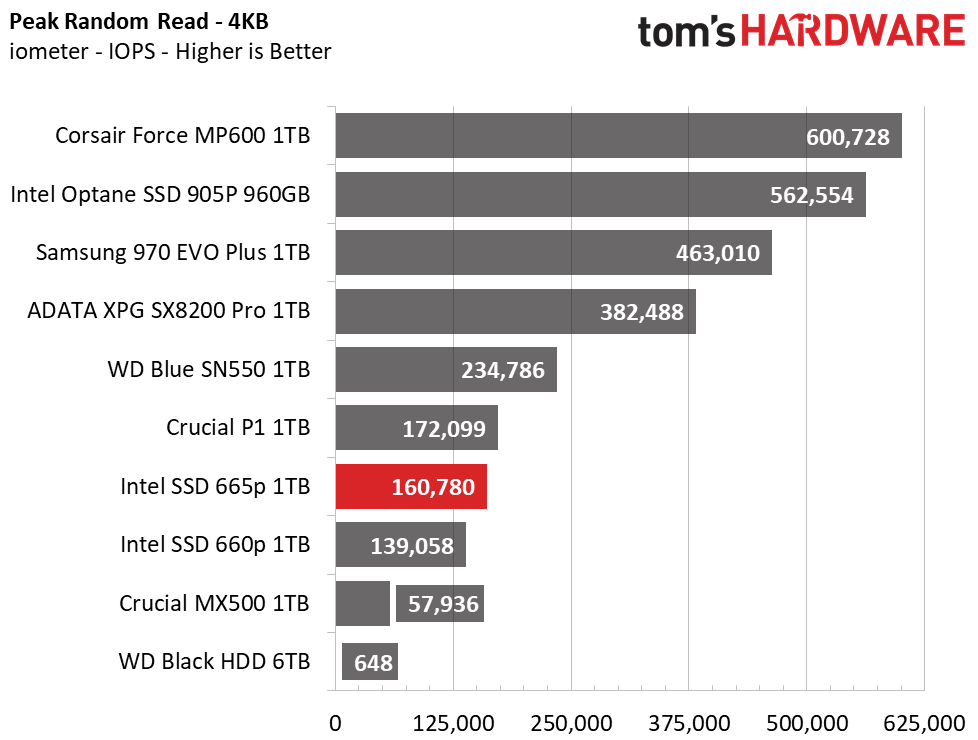
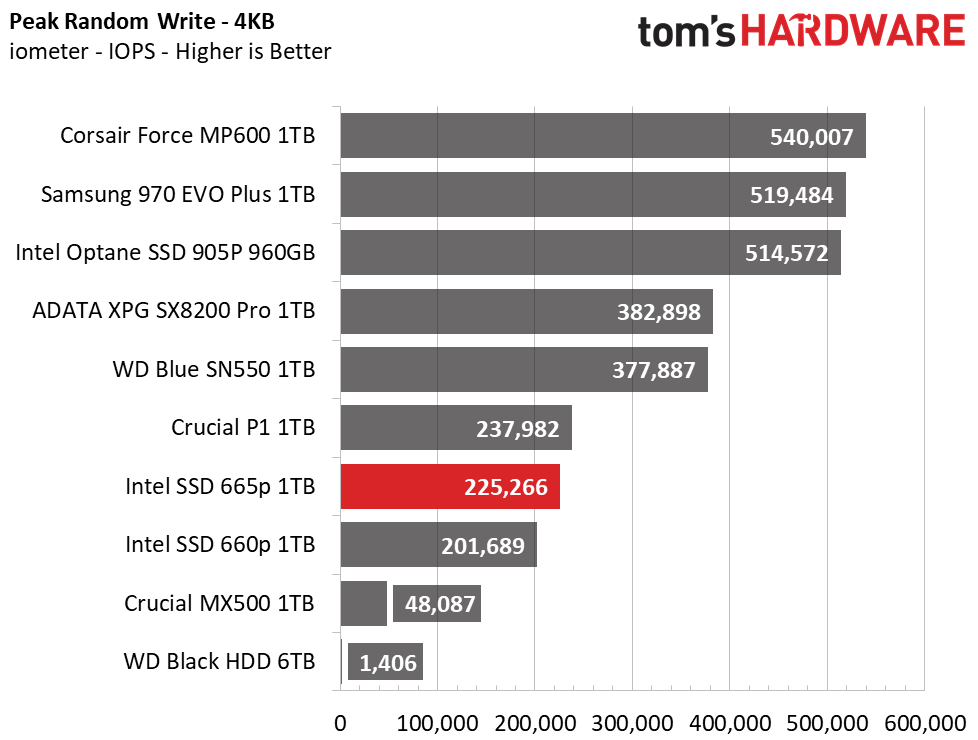
Testing for peak sequential speed, we measured top read throughput of 2,189 MBps and a max of 2,010 MBps of write throughput. WD’s SN550 has slightly faster performance, giving it the lead. But, when it comes to random performance, Intel tuned this QLC NAND to be quite responsive. At QD1, latency is lower than Samsung’s 9xL V-NAND. The Crucial P1 displayed even slightly lower latency, even under peak load.
Sustained Write Performance, Cache Recovery, and Temperature
When possible, we also log the temperature of the drive via the S.M.A.R.T. data to see when (or if) thermal throttling kicks in and how it impacts performance. Bear in mind that results will vary based on the workload and ambient air temperature.
Official write specifications are only part of the performance picture. Most SSD makers implement a write cache, which is a fast area of (usually) pseudo-SLC programmed flash that absorbs incoming data. Sustained write speeds can suffer tremendously once the workload spills outside of the cache and into the "native" TLC or QLC flash. We use iometer to hammer the SSD with sequential writes for 15 minutes to measure both the size of the write cache and performance after the cache is saturated. We also monitor cache recovery via multiple idle rounds.
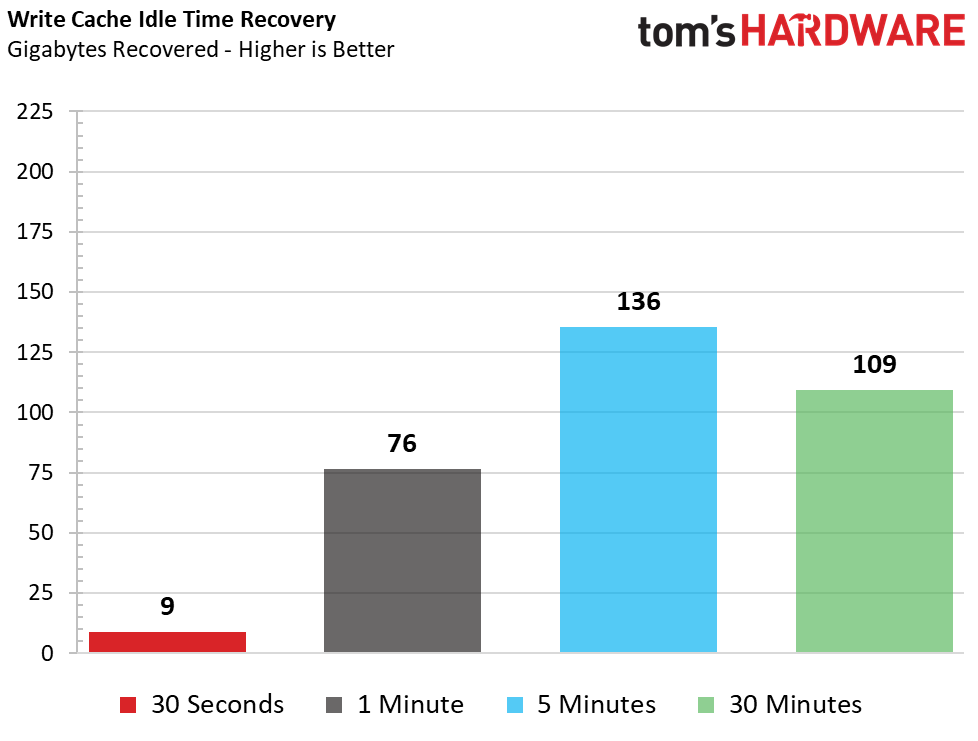
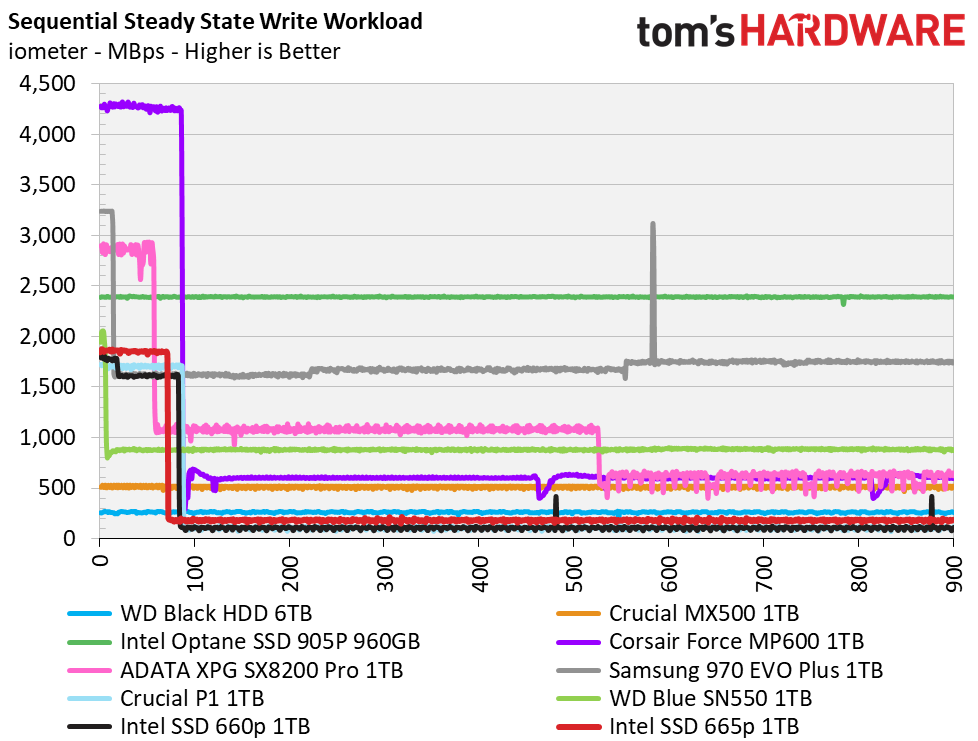
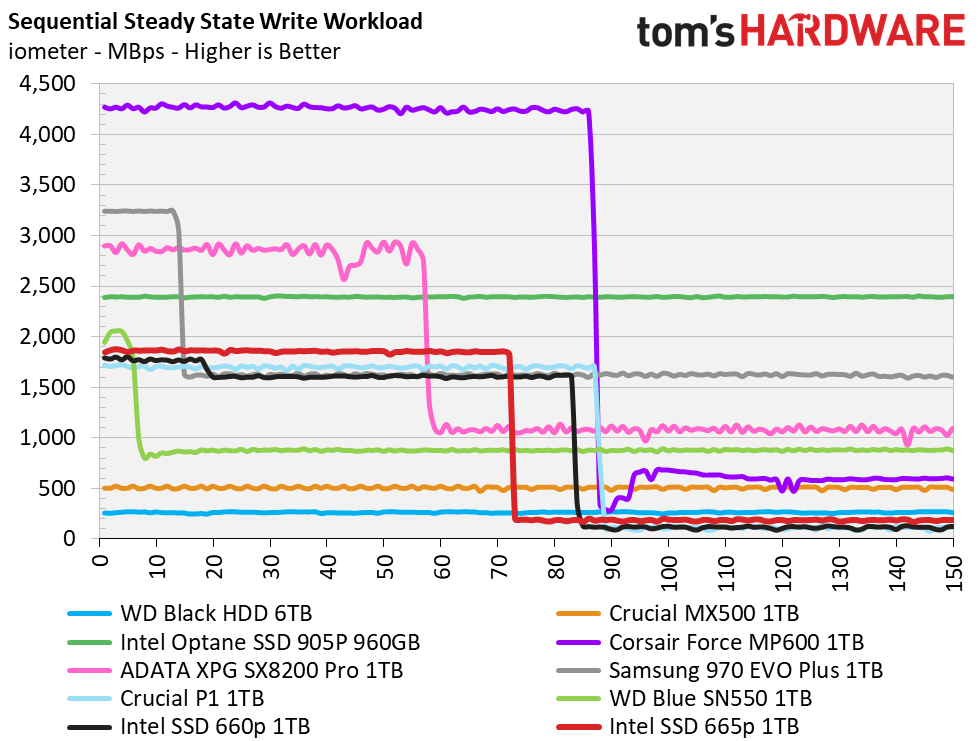
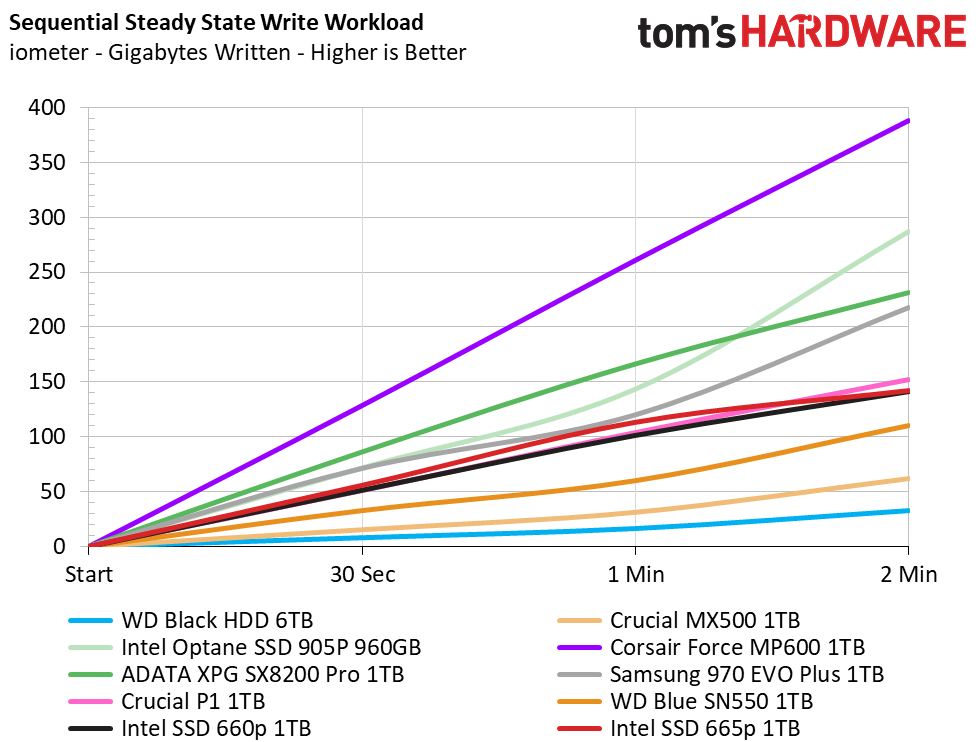
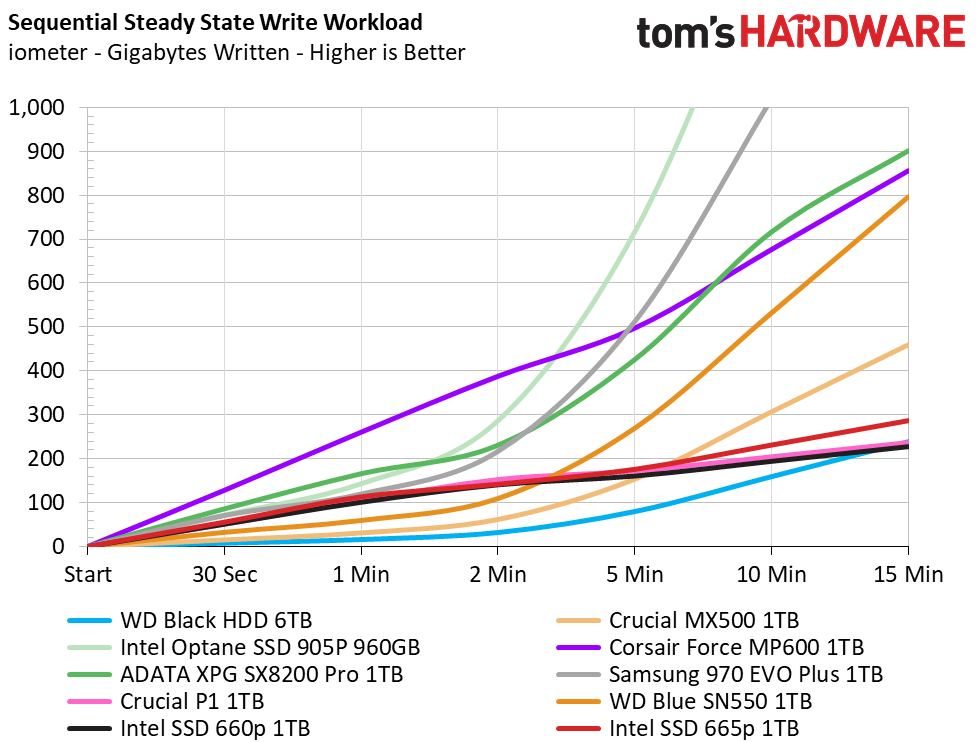
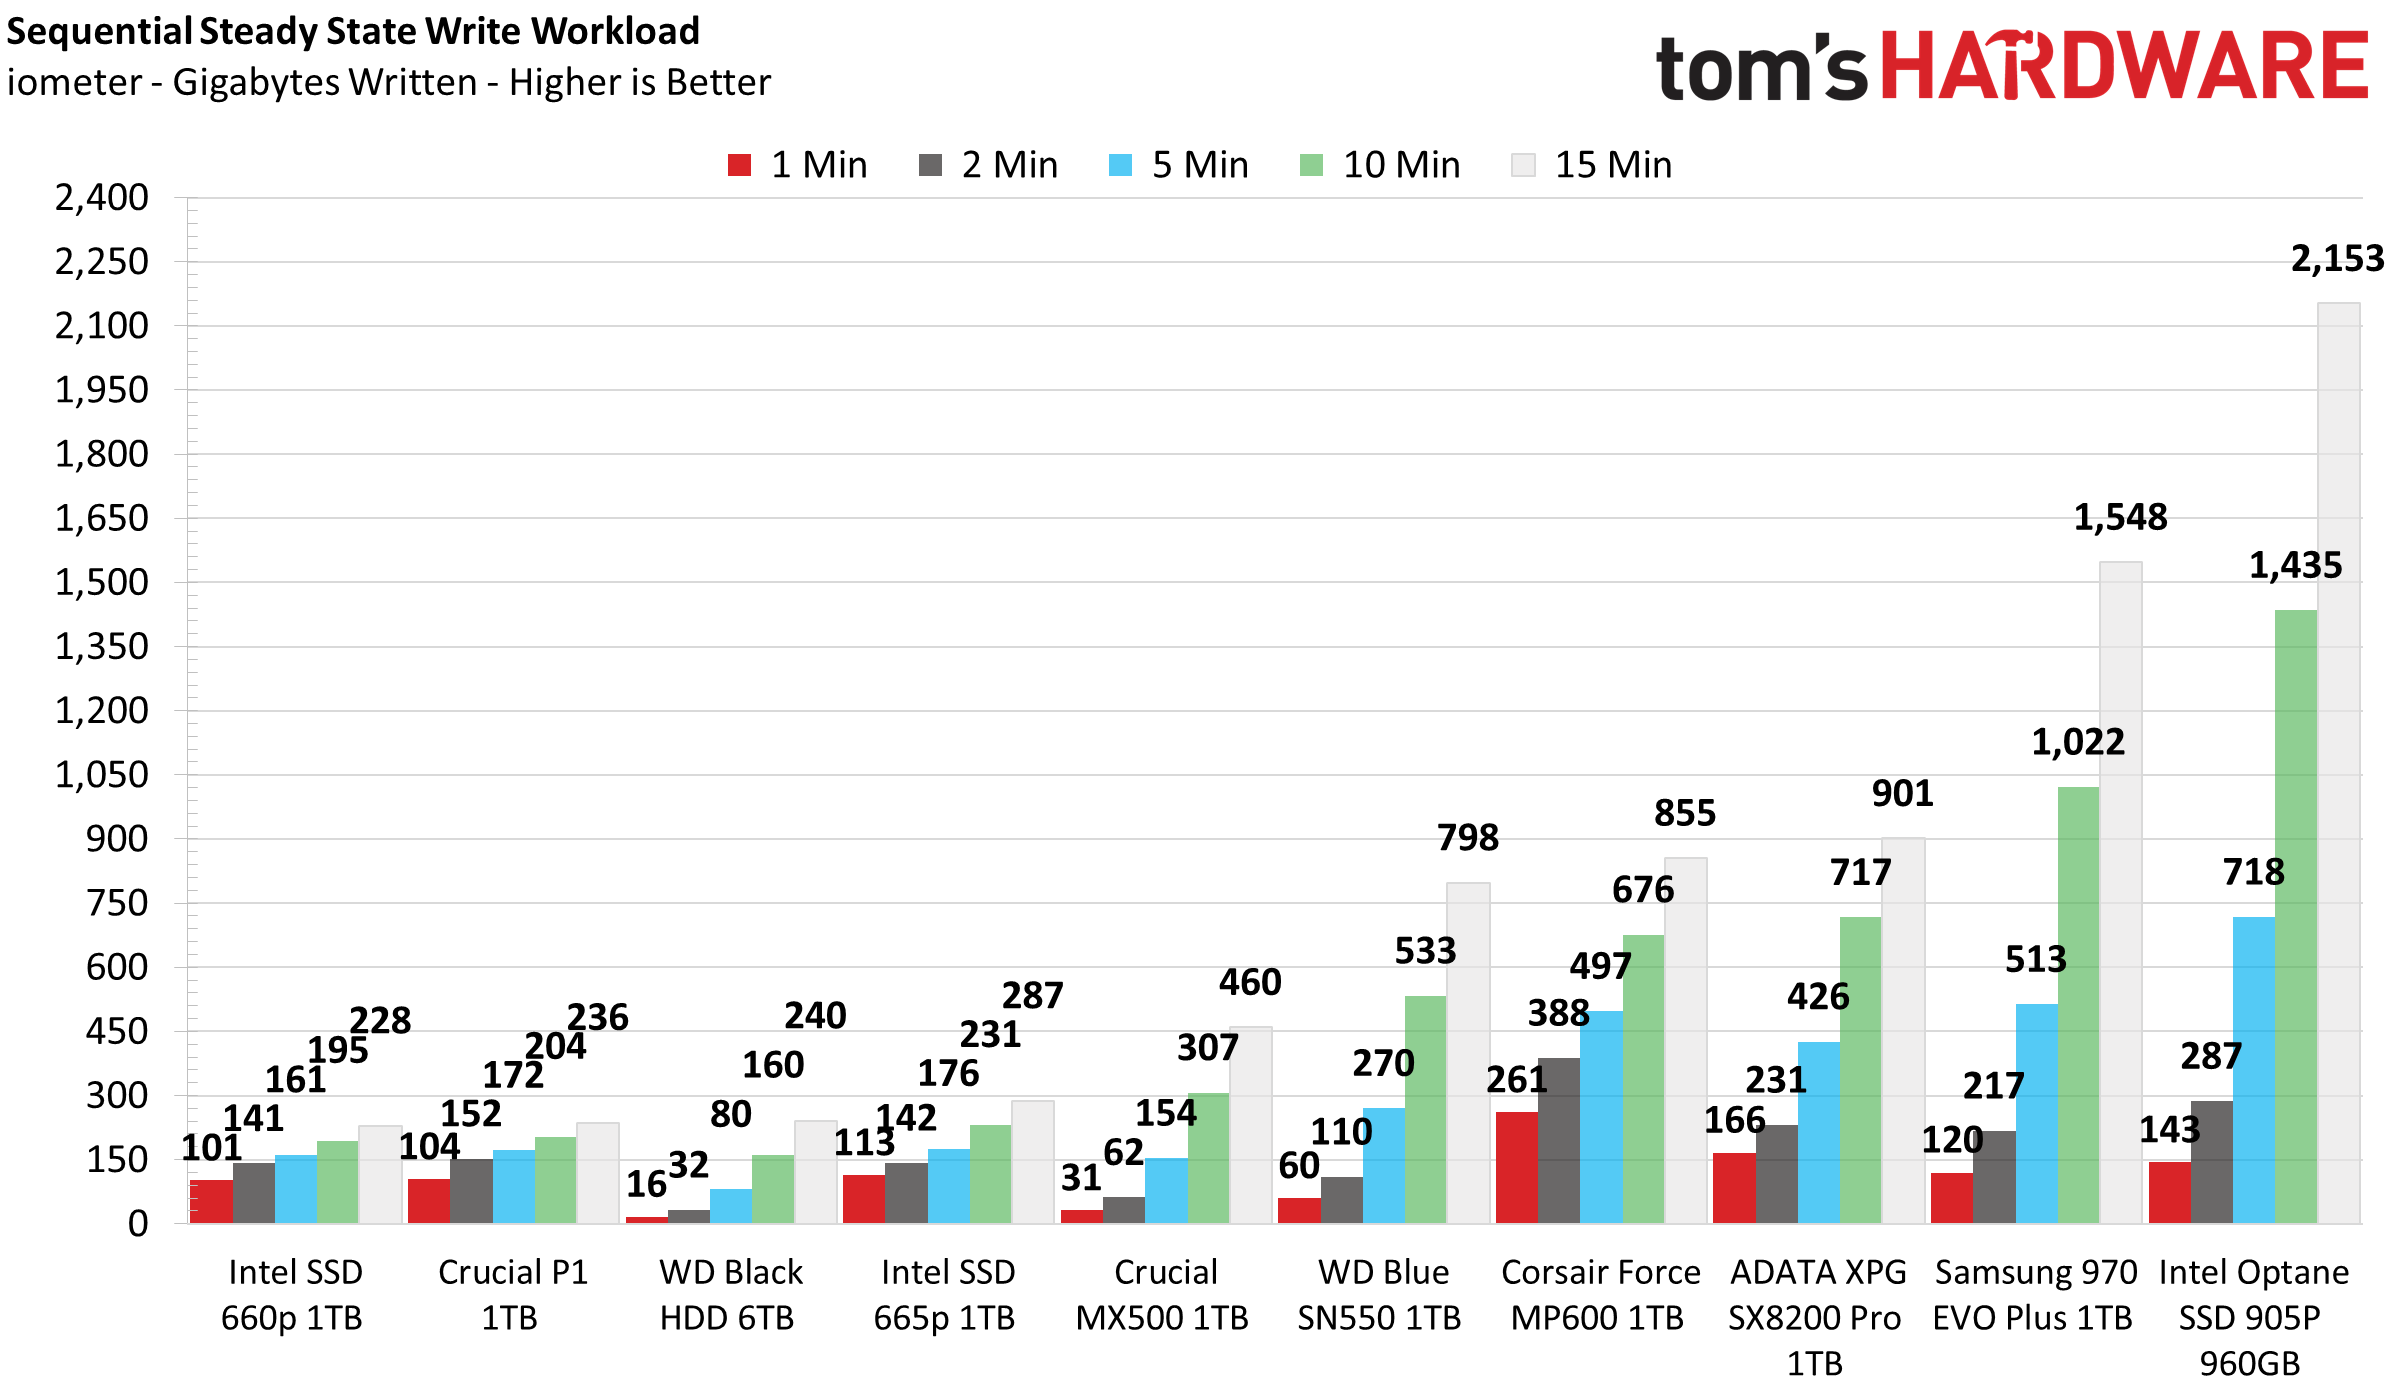
We measured the cache to be just shy of 140GB of capacity, like the previous-gen 660p. The difference here is that it was able to write that amount a bit faster. Also, after the cache exhausts, direct-to-QLC write speed has gone up from 125 MBps to 185MBps. The cache recovers quickly, too. The cache regained 76GB of space after a minute of idle time, and it only took five minutes to regenerate its entire write cache.
Maximum controller temps peaked at 61C during file transfers (without airflow). That means you won't need special cooling.
Power Consumption
We use the Quarch HD Programmable Power Module to gain a deeper understanding of power characteristics. Idle power consumption is a very important aspect to consider, especially if you're looking for a new drive for your laptop. Some SSDs can consume watts of power at idle while better-suited ones sip just milliwatts. Average workload power consumption and max consumption are two other aspects of power consumption, but performance-per-watt is more important. A drive might consume more power during any given workload, but accomplishing a task faster allows the drive to drop into an idle state faster, which ultimately saves power.
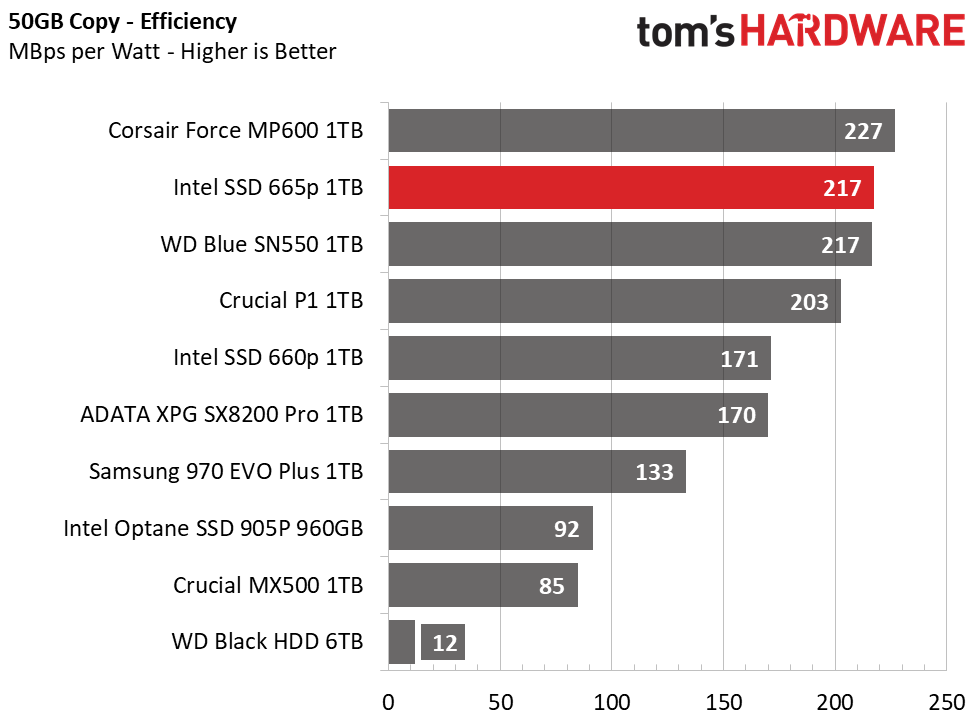
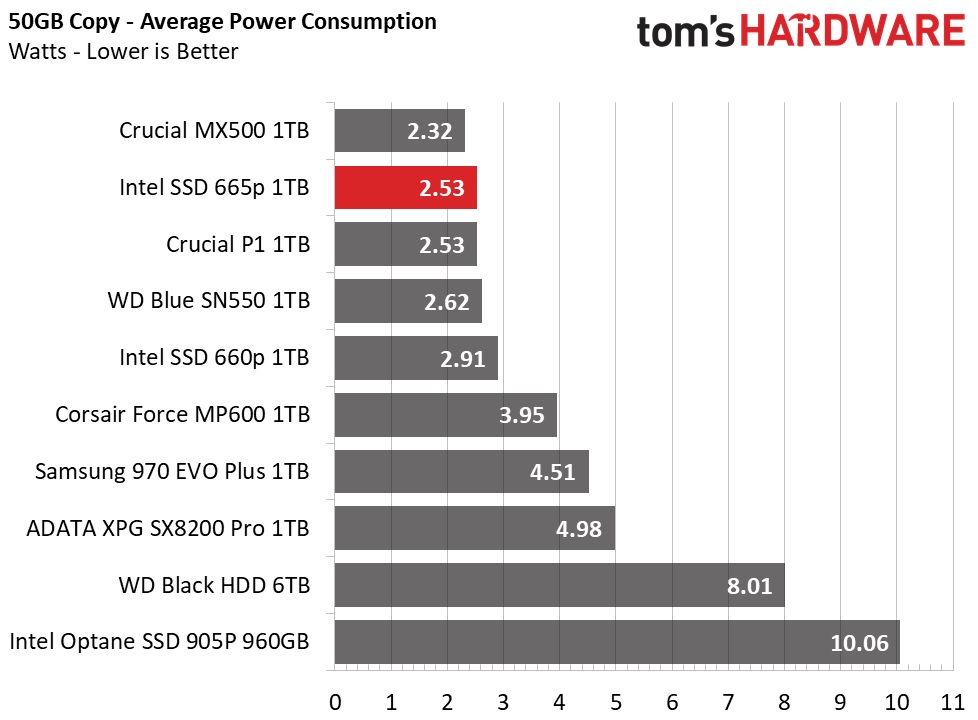
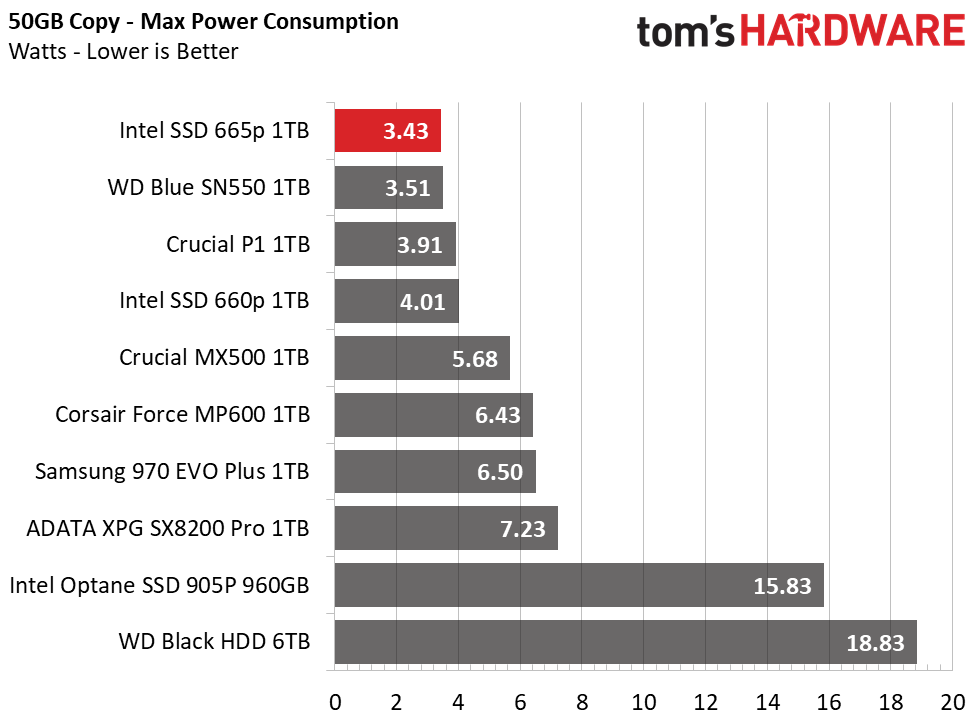
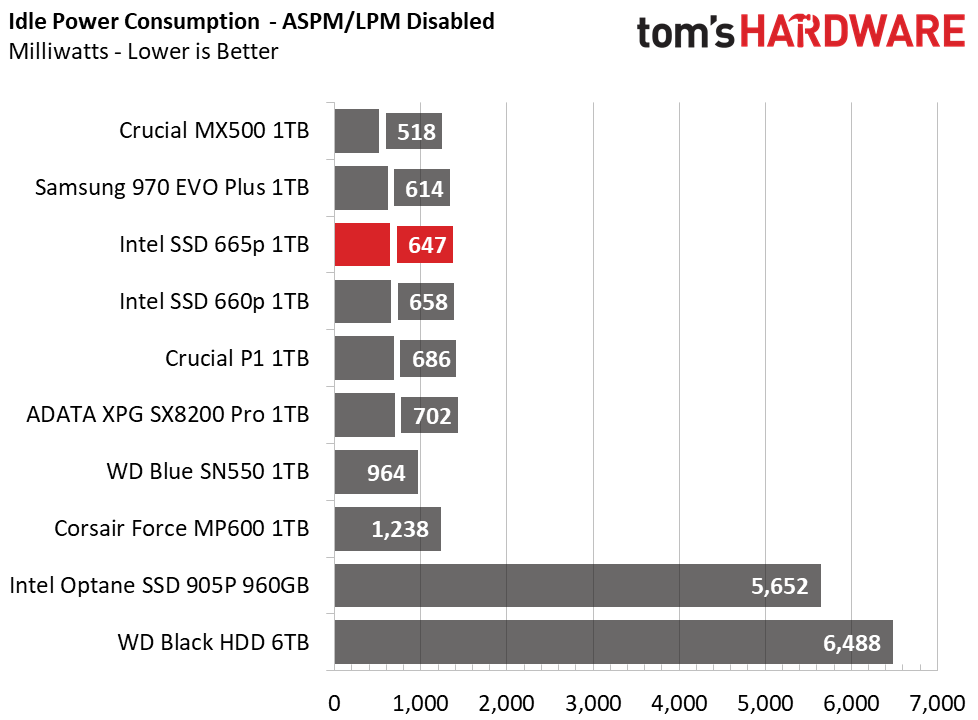
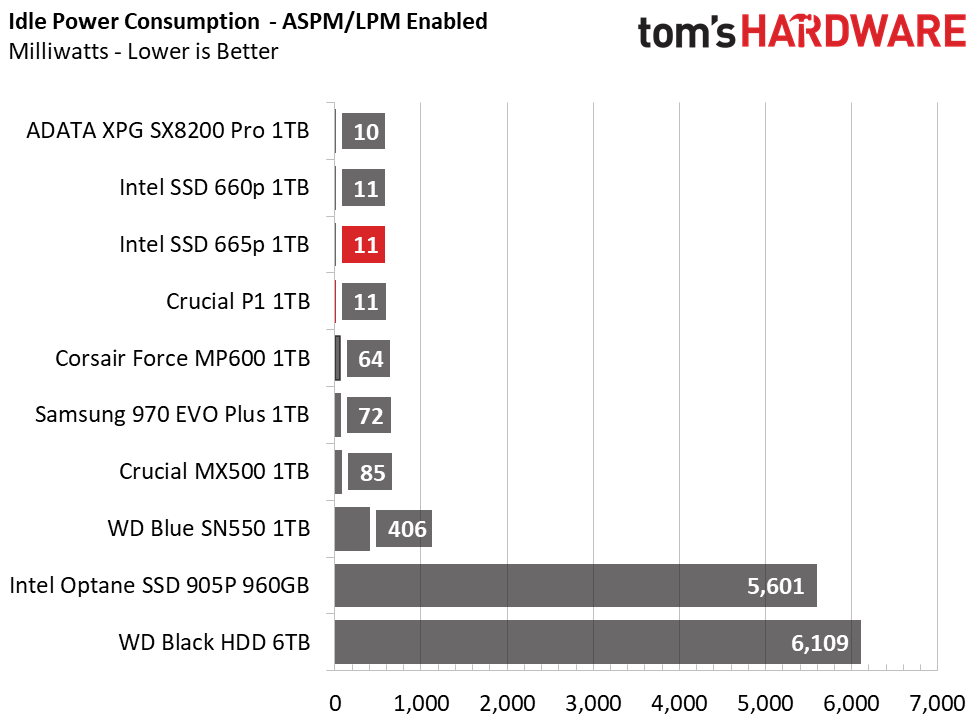
Intel’s SSD 665p is very efficient, too. Its average power consumption has gone down and its peak draw is even better than before. Overall, the 665p scores second on our transfer efficiency chart and it drops down to a very low power state when not in use.
MORE: Best SSDs
MORE: How We Test HDDs And SSDs
MORE: All SSD Content

Sean is a Contributing Editor at Tom’s Hardware US, covering storage hardware.
-
levijonesm Hi Sean, may I ask how the direct-to-QLC write speed of 185 MB/s was calculated? From the graph "Sequential Steady State Write Workload", I see 287 GB written after 15 minutes. This works out to 319 MB/s.Reply
Also, in your review of the 660p here, the sustained write speed of the 660p seems to be 175 MB/s (not 125 MB/s mentioned in this review). Just some points of clarification please. Thanks.
A direct-to-QLC speed of 185 MBps is perfectly acceptable to me, once the price drops a bit to 660p levels. The improvements in cache recovery and power efficiency are welcome too. Thanks for the very good review. -
seanwebster Replylevijonesm said:Hi Sean, may I ask how the direct-to-QLC write speed of 185 MB/s was calculated? From the graph "Sequential Steady State Write Workload", I see 287 GB written after 15 minutes. This works out to 319 MB/s.
Also, in your review of the 660p here, the sustained write speed of the 660p seems to be 175 MB/s (not 125 MB/s mentioned in this review). Just some points of clarification please. Thanks.
A direct-to-QLC speed of 185 MBps is perfectly acceptable to me, once the price drops a bit to 660p levels. The improvements in cache recovery and power efficiency are welcome too. Thanks for the very good review.
I write to the drive after a secure erase with iometer - 128KB sequential workload @QD32. I average the cache speed before performance drops and then after it drops I average the remaining writes. (the charts seem to be mixed up slightly - check the last iometer charts for the rest of the write saturation charts until it gets fixed - there you will see the write cliff and better understand the cache)
The 660p review you are referring to is the 2TB model. We don't have the write saturation chart on the 1TB 660p review because it was added into the performance testing in later reviews (along with some minor adjustments here and there). I included the missing data from the 660p review here, and it is included now in various other reviews I've done since. It has a slower base write speed than the 2TB model after its cache exhausts. The 1TB 660p has a base write speed that hovers around 110-130 for the most part.
We should be getting the 2TB 665p in the coming weeks so, it will be interesting to see how it has improved as well. -
thisisaname While 287 GB/900 seconds is 319MB/s he was talking about direct-to-QLC speed so you remove the first 142MB 120 seconds ( the filling of the cache) the sum becomes 143 GB / 780 seconds giving 185.9MB/sReply -
dimar Shouldn't you say 5 years or 300TBW /600TBW warranty, whichever comes first? Would Intel service the drive if it gets to the TBW point?Reply