Mass Effect Andromeda Performance Review
How We Test Mass Effect: Andromeda
Test configuration
| CPU | Core i5-6500 |
| Motherboard (LGA 1151) | Asus Z170-Deluxe |
| RAM | Klevv DDR4-2133 8GB |
| SSD | MX500 SSD |
| Controller | Intel Z170 PCH SATA 6 Gb/s |
| Power Supply | Cooler Master G450M |
| Case | Haf XB EVO |
| OS | |
| Operating System | Windows 10 x64 Pro 1607 (14393.969) |
| Graphics Drivers | Nvidia GeForce Game Ready 378.92AMD Radeon Crimson Edition 17.3.3 |
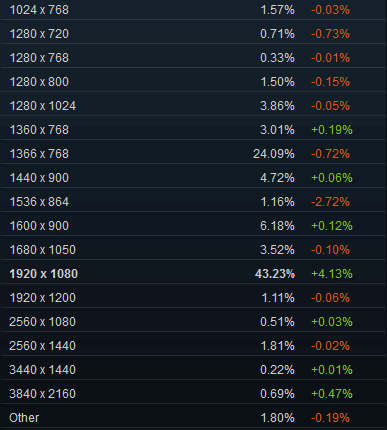
We're using a fairly mid-range gaming PC that we hope represents what a lot of our readers are running. If you're lucky enough to own faster hardware, you'll naturally enjoy higher frame rates. Steam's survey of hardware and software configurations offers us a view of the most prevalent components and settings (the data comes from February 2017):
- Windows 10 64-bit representing 47.7% of the market.
- 8GB RAM, present in 34% of surveyed gaming PCs (our configuration has 16GB).
- Full HD (1920x1080) is used by 43% of gamers, while 24% are still at 1366x768. QHD (2560x1440 pixels) is used by less than 2% of gamers, and 4K is anecdotal. As a result, we're testing at 1920x1080.
- Quad-core CPUs are installed in almost half of the examined systems (47.7%). Logically, our configuration is loaded with a mid-range quad-core Intel CPU.
Graphics Card Selection
We picked eight graphics cards to test. They're mostly mid-range, and they represent popular choices from current- and previous-generation architectures. Here are the competing cards:
The Radeon RX 480 “Core” from XFX is at a disadvantage, given its stock clock rate, compared to the Asus Strix OC and its GPU frequency of 1645 MHz. We're overclocking it +4% to the level of a factory-tuned model, yielding a 1340 MHz GPU and 2 GHz memory.
These two cards represent where the mid-range segment starts. The Radeon RX 470 should have an advantage with its additional gigabyte of memory.
Nvidia's GeForce GTX 970 and AMD's Radeon R9 390 are previous-gen cards, but they'll no doubt remain popular in mid-range gaming PCs for months to come. We picked them more for their popularity in existing gaming machines, rather than their retail prevalence, which is quite variable.
In past game performance stories, readers asked for even lower-end cards to gauge whether entry-level hardware is good enough for playable frame rates. As such, we're adding a couple.
Test Procedure
All performance data is collected using the PresentMon tool and our own custom front-end.
Get Tom's Hardware's best news and in-depth reviews, straight to your inbox.
In order to represent graphics card performance accurately, each test subject is warmed up to a stable temperature before measurements are collected. Most GPUs employ mechanisms to optimize clock rates based on variables like power and temperature. So, tests run during the warm-up period would convey better performance than you'd see in the real world.
We therefore run the benchmark sequence twice to warm up each card. Then we gather the data for our charts. For graphics options, we tested the game at Full HD with Medium and High settings. We also tested the RX 480 and GTX 1060 6GB with the Ultra preset, and the RX 460 and GTX 1050 with Low preset.
MORE: Best Graphics Cards
MORE: Desktop GPU Performance Hierarchy Table
MORE: All Graphics Content
Current page: How We Test Mass Effect: Andromeda
Prev Page The Game, Graphics Engine, And Settings Next Page Benchmarks: FPS, Frame Time, And Smoothness-
WINTERLORD glad to see tomshardware doing articles like this. i think it may of been cool to see a radeon fury in there since its 4gb limited ram i dont own one but am sure somebody does. however stickijg to the cards listed in the article would have been nice to see how it plays at 4k resolution. at Any rate great articleReply -
IceMyth Hmmm...I dont think this article is accurate when it comes to GPUs FPS . Yes, The 1050 and 460 are the worst for this game, but the other GPUs are not.Reply
The problem I see is that you didn't eliminate the CPU bottleneck which affects the GPU performance as well, for example PCGamer used different setup to eliminate the CPU bottleneck and all GPUs used where MSI. The results they got is that MSI RX 480 is slightly higher FPS than MSI 1060 (which is 300Mhz higher) on Ultra. While on Medium settings the Rx 480 is faster by around 10FPS.
I know this is not a GPU benchmark but since you include FPS/CPU/Memory it is a way to benchmark computer hardware.
http://www.pcgamer.com/mass-effect-andromeda-pc-performance-analysis/
Windows 10 has around 47% of market share, you sure about this? I mean so far all what I heard and by googling the 47% market share is for Windows 7 and not Windows 10. If you mean Win10-64bit vs Win10-32bit market share then this is something else.
1- https://www.neowin.net/news/windows-xps-market-share-takes-another-hit-as-windows-7-and-10-rise
2- https://www.wincert.net/microsoft-windows/windows-10/windows-10-market-share-without-changes/
3- https://betanews.com/2017/03/01/windows-10-loses-share-again/
Regards, -
brandxbeer Wheres the 2k and 4k benchmarks? If we wanted a 1080p 1050 review I'd look at a ps4 pro review. Stop being lazy with you're benchmarks.Reply -
rantoc Personally i'we disabled the motion blur (need to make a cfg file, google it).Reply
Changed to HALF16 instead of Compressed to get less washed out gfx that have more depth to it
Changed to Double-buffering from Trippe-buffering to get rid of the console like high latency in the game = Much faster response and it also appeared to give a better frame pacing.
3440x1440 running with around 80-90 fps depending on area (gsyned 100 hz), no stuttering after the above was fixed.
The above along with some minor tweaks to light/shadow and the game is both responsive yet really beautiful -
Jan_26 Reply19504927 said:Personally i'we disabled the motion blur (need to make a cfg file, google it).
Changed to HALF16 instead of Compressed to get less washed out gfx that have more depth to it
Changed to Double-buffering from Trippe-buffering to get rid of the console like high latency in the game = Much faster response and it also appeared to give a better frame pacing.
3440x1440 running with around 80-90 fps depending on area (gsyned 100 hz), no stuttering after the above was fixed.
The above along with some minor tweaks to light/shadow and the game is both responsive yet really beautiful
I think you mean you changed from double-buffering to tripple buffering. As tripple buffering is superior to double buffering in every aspect except gpu ram requirements :-)
-
Masterarms This game is a joke, a complete horribly rendered game with more bugs and glitches than content. The game is a flop, use something else.Reply -
bgunner Quote "Then again, 600 years have passed since Mass Effect 3, so perhaps evolution is to blame?"Reply
This could also be the reason of the horrible facial expressions used. After having their faces in one position for so long, 600+ years, they don't have much muscle control to express themselves properly. lol
As for physics engine issues they seem to pop up every where. From dead body's half in the ground, wild life materializing in the ground, floating objects and the occasional shooting the enemy and it not registering these all can be a turn off but when certain parts of terrain are rendered just plain wrong this is a full deal breaker.
This is most commonly seen by me on the Tempest's bridge and looking in to the escape pod room where Peebee hangs out. most times it will show space, stars nebula's and black, then slowly switch over to the actual room view.
GPU and CPU performance aside this thing needs some serious patch work. -
dstarr3 I'm hoping to get another year and a half or two years out of my 980Ti. And judging by the 1060/1070 here, it's good to see that I'll still be able to run this year's AAA games at 1080p/60/Ultra. Hang in there, buddy! Once the 1180Ti or whatever comes out, then you can take a well-deserved vacation!Reply -
bgunner Reply19504372 said:Wheres the 2k and 4k benchmarks? If we wanted a 1080p 1050 review I'd look at a ps4 pro review. Stop being lazy with you're benchmarks.
It is obvious the whole meaning to this actical is completely lost on you even though it was strait spelled out for you. And I quote "How does it run on mainstream gaming hardware? We benchmark it on eight different graphics cards to find out." This was not a benchmark of the top GPU's and top CPU's but a bench mark of mid range hardware.
For this the article served it purpose But I would have liked to see other CPU's added in to the mix to show the CPU bottlenecks at what points.
Because very few of those that use Steam use 2k and even less use 4k monitors the mid-range segment is in the 1920X1080 resolution. For this game to run at 4k resolution more than one GTX1080 will be necessary and again puts it well out of the mid-range hardware that this article was meant to cover. -
rantoc Reply19504995 said:19504927 said:Personally i'we disabled the motion blur (need to make a cfg file, google it).
Changed to HALF16 instead of Compressed to get less washed out gfx that have more depth to it
Changed to Double-buffering from Trippe-buffering to get rid of the console like high latency in the game = Much faster response and it also appeared to give a better frame pacing.
3440x1440 running with around 80-90 fps depending on area (gsyned 100 hz), no stuttering after the above was fixed.
The above along with some minor tweaks to light/shadow and the game is both responsive yet really beautiful
I think you mean you changed from double-buffering to tripple buffering. As tripple buffering is superior to double buffering in every aspect except gpu ram requirements :-)
Actually no, proper triple buffering as long as the vram can afford it runs great on one card and is usually what i recommend myself but me:a's implementation with multiple cards / temporal aa causes frame time issues.
Where double / temporal works quite ok considering temporal have to xfer prev frame back and forth between the cards and an nvidia double sli bridge seems to be enough for quite acceptable min/avg fps.


