NEC EA274WMi Monitor Review: Eco-Friendly At 2560x1440
The high pixel density of a 27-inch QHD monitor is fast becoming the desktop standard for power users. But prices are stalled in the $600 to $800 range. Today we check out NEC’s entry, the EA274WMi. Our hands-on review reveals what you get for your money.
Results: Brightness And Contrast
Uncalibrated
Before calibrating any panel, we measure zero and 100-percent signals at both ends of the brightness control range. This shows us how contrast is affected at the extremes of a monitor's luminance capability. We do not increase the contrast control past the clipping point. While that would increase a monitor’s light output, the brightest signal levels would not be visible, resulting in crushed highlight detail. Our numbers show the maximum light level possible with no clipping of the signal.
Our comparison group includes the last six monitors reviewed at Tom’s Hardware. The Asus PQ321Q, Dell UP3214Q, and UP2414Q are Ultra HD displays. The Samsung S27B971D is an sRGB panel with QHD resolution. And the ViewSonic VP2772 is a wide-gamut display, also QHD.
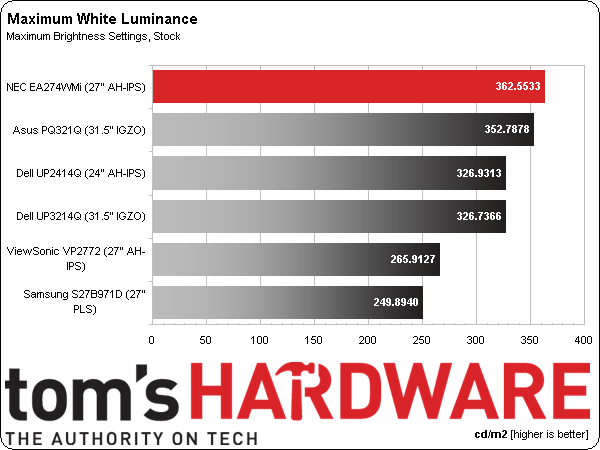
The max brightness result is measured in the EA274WMi’s Standard picture mode using the Native color temp preset. Contrast is set halfway through its range (50 out of 100). You can get a little more light by upping the slider, but clipping starts at 51. The result is a little higher than the panel’s rating of 350 cd/m2.
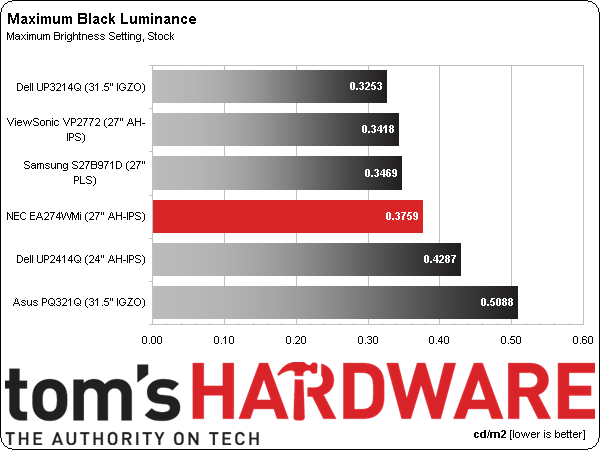
Our measured black level is pretty good, given the panel’s high brightness.
When the backlight is on full, most monitors won’t deliver a decent black level. NEC lands mid-pack; the EA274WMi is about average for our last 22 screens tested.
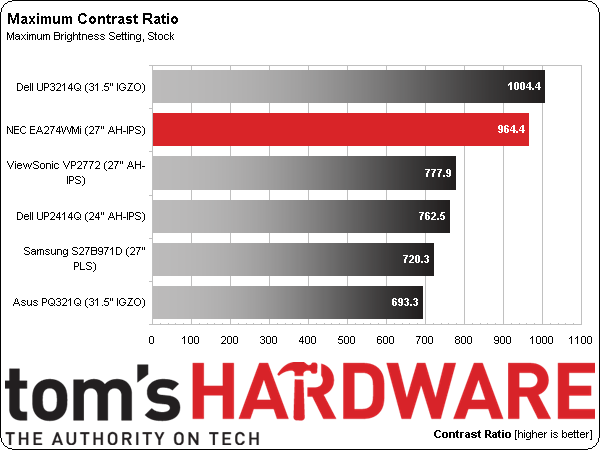
The resulting contrast ratio isn’t too bad thanks to a high white level.
The EA274WMi comes in second in this fairly expensive group. You could easily use it outdoors in bright sunlight and see a pretty decent image. Photographers on location might want to consider a display like this.
Get Tom's Hardware's best news and in-depth reviews, straight to your inbox.
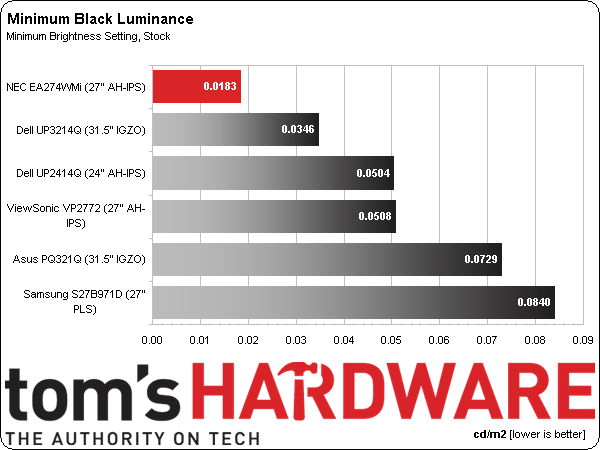
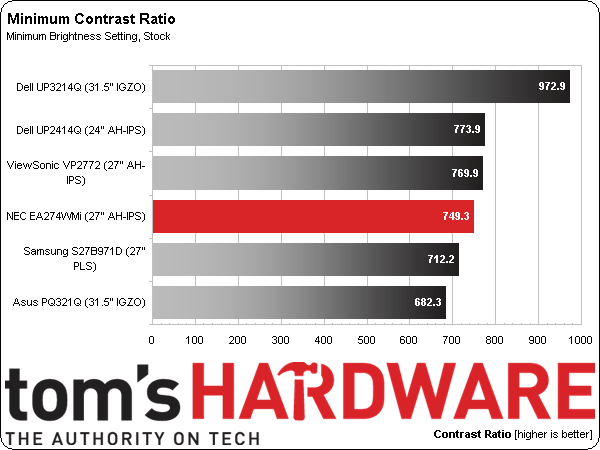
We believe 50 cd/m2 is a practical minimum standard for screen brightness. Any lower and you risk eyestrain and fatigue. Some monitors like the EA274WMi will measure under that level. We recorded a very low white level of 13.7128 cd/m2 with the backlight turned all the way down. This is a bit too dim for practical use. Raising the brightness to 12 gets you 50 cd/m2 with a black level of .0625 cd/m2 and a contrast ratio of 788.4 to 1.
Our measured minimum black level trounces the other monitors in the group, but that is mainly because of the extremely dim backlight. At 50 cd/m2 max, the black level would put NEC in fifth place, which is an otherwise typical performance for a 27-inch QHD screen based on an LED-lit IPS panel.
The contrast ratio is starting to look more like the rest.
The minimum contrast ratio drops around 22 percent from the max number, yielding a decent result (even if it's less consistent than the last few monitors we tested). The other five in this group all measured closely in their maximum and minimum contrast tests. Hopefully, the calibrated result will be somewhere in between.
After Calibration
Since we consider 200 cd/m2 to be an ideal point for peak output, we calibrate all of our test monitors to that value. In a room with some ambient light (like an office), this brightness level provides a sharp, punchy image with maximum detail and minimum eye fatigue. It's also the sweet spot for gamma and grayscale tracking on some monitors, which we'll consider on the next page. In a darkened room, many professionals prefer a 120 cd/m2 calibration. We find it makes little to no difference on the calibrated black level and contrast measurements.
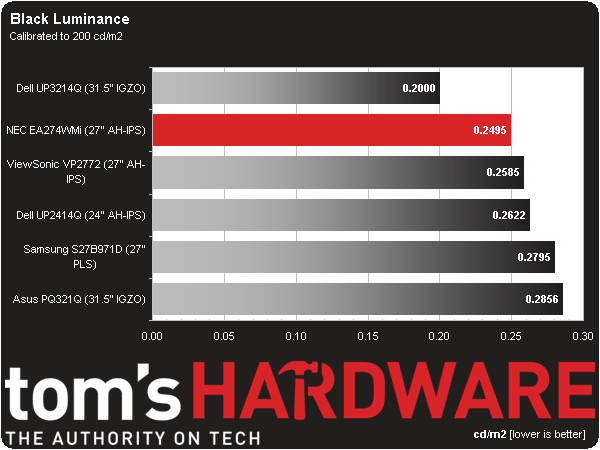
To calibrate the EA274WMi, you have to use one of the four adjustable color temp presets. We went with number three and the result is an excellent black level.
Calibration often raises the black level from its out-of-box state. But the EA274WMi doesn’t suffer from that phenomenon.
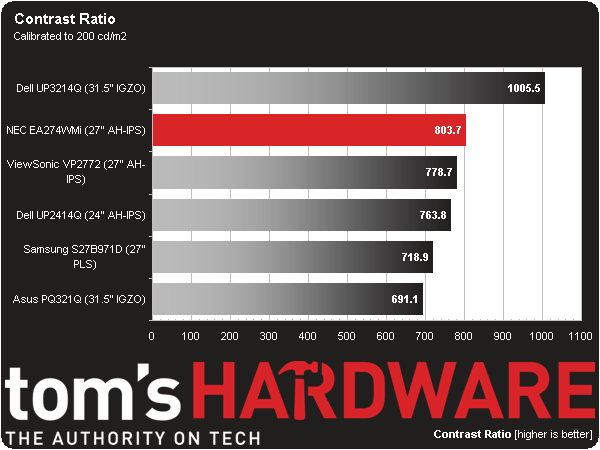
As we hoped, contrast is a little better after calibration than before. We’re now at over 800 to 1.
We’ve seen several monitors achieve better than 1000 to 1 contrast after calibration. However, the only screen that did this recently was Dell's UP3214Q. The NEC comes closer to that elusive figure than the other four screens in our group.
ANSI Contrast Ratio
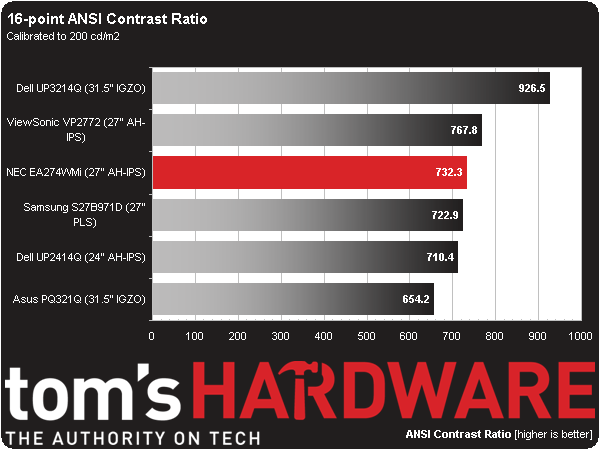
Another important measure of contrast is ANSI. To perform this test, a checkerboard pattern of sixteen zero and 100-percent squares is measured, giving us a somewhat more real-world than on/off measurements because it tests a display’s ability to simultaneously maintain both low black and full white levels, factoring in screen uniformity. The average of the eight full-white measurements is divided by the average of the eight full-black measurements to arrive at the ANSI result.
The ANSI value is a little lower than the on/off one, just like every other display that’s been in our lab. Obviously this is an extreme test. As mentioned, though, it's also more real-world. Intra-image contrast is what we see in a typical image. In the case of the EA274WMi, the drop is less than nine percent. I consider that to be excellent.
Current page: Results: Brightness And Contrast
Prev Page Measurement And Calibration Methodology: How We Test Next Page Results: Grayscale Tracking And Gamma Response
Christian Eberle is a Contributing Editor for Tom's Hardware US. He's a veteran reviewer of A/V equipment, specializing in monitors. Christian began his obsession with tech when he built his first PC in 1991, a 286 running DOS 3.0 at a blazing 12MHz. In 2006, he undertook training from the Imaging Science Foundation in video calibration and testing and thus started a passion for precise imaging that persists to this day. He is also a professional musician with a degree from the New England Conservatory as a classical bassoonist which he used to good effect as a performer with the West Point Army Band from 1987 to 2013. He enjoys watching movies and listening to high-end audio in his custom-built home theater and can be seen riding trails near his home on a race-ready ICE VTX recumbent trike. Christian enjoys the endless summer in Florida where he lives with his wife and Chihuahua and plays with orchestras around the state.
-
mikenygmail My 27" Monoprice IPS monitor was $300 total, with $10 in Rakuten credit to boot. So, it could be considered to be $290.Reply
I'm sure this monitor is slight better, but come on NEC, $800 is ridiculous.
Even more ridiculous is this quote from the review:
"At $800, this is the least-expensive high-res model in the line. "
haha! -
SessouXFX I'll be glad when the QHD's get down to a more affordable price. They've been out for quite some time now. There's no reason to keep building these monitors for such a high premium, when 4K is on the horizion. Also, they should build these QHD's with better refresh rates already, and bigger screens too. We should be able to go to the store and buy quality 30 in.+ QHD's at around $300-600.Reply -
airborne11b FFS! The ROG Swift is going to be coming out soon and it's sporting 144hz, 1ms response, 2560x1440 and G-sync... for like $799.Reply
The Korean 2560x1440's are in the $300 - $400 price range.
Who the hell is pricing these things? -
Jess Castro When you can buy a 4k monitor for about the same price wtf are they thinking? I would not pay over 300 dollars for a 1440p monitor, espeically one without g-sync. Give me a 4k 27in 120hz+ ips with gysnc for around a grand and Im all in. Tired of being asked to pay a stupid premium for 15 year old tech that is on its deathbed.Reply -
Bondfc11 Overlord Computer has been selling their Tempest OC monitor for 2 years now and it is at $450 shipping and warrantied out of California. The Tempest is the only IPS that can be overclocked up to 120Hz that I know of. If you want an IPS at 1440 they should be on your list to check out - I have 3!! They also will have a Gsync IPS panel that will run native around 96Hz - the only one on the planet - those are the rumors at least.Reply -
Bondfc11 As for this quote in the article: "There is still no factory support for refresh rates greater than 60 Hz. "Reply
Untrue Overlord warranties their OC model and is the only OEM making IPS panels specifically for gamers. Why Tom's doesn't have one of the Tempests to review I still don't understand. Oh wait - that's right - it's pay to review on this site! DOH! -
nebun everyone is talking about qhd this and qhd that....don't forget to upgrade your graphic cards...today's cards can't keep up...they are power hungry POS...AMD and eNvidia really need to work on power usage....i love my HD 7970 CF set up....man it rus hot...my room is wayyyy to hot when i start gaming.Reply -
somebodyspecial 1440p is not the standard nor is it fast becoming one. 1080p is the standard. 1440p is less than 1% of the user base and has been for 2yrs+. I remember Anandtech claiming this crap in the 660ti review which I bashed ~2yrs ago :) It was a dumb comment then (stupid way for Ryan to claim AMD the victor when most games were under 30fps AVG at that res...ROFL, most under 20fps min!...LOL) , and still is one now. That is about when AMD's portal showed up on anandtech (no bias there...LOL). Not only are these expensive as 1080p 24in can be had for far less, but you require tons of gpu power to run them without turning all kinds of stuff off for a LOT of games. Heck a 780ti can be brought to it's knees by 1080p maxed in some games. This will only get worse as engines up the gpu requirements. I'm not even sure 1440p will be doable (maxed in EVERYTHING) with maxwell 20nm.Reply
Let me know when 1440p hits 25% share of the market. At that point MAYBE you can claim it's the standard. I expect an email in 3-4yrs...ROFL.
http://store.steampowered.com/hwsurvey/
scroll down to primary monitor resolution. .93%...
Note 1080p=32.91%
Ideally for it to be standard it has to be the highest percent right? 1080p. GET IT?
Yes I want us to get to higher res monitors being standard ASAP (with GPU's that can actually push this res without the need for 2+ cards), but reality is that day hasn't arrived so quit saying this BS.
Also understand that .93% is the penetration of gamers. I'm guessing it is far less if you include the non-gamers who mostly have no need to splurge on an $400-800 monitor to view the web or email and anything under $490 or so I wouldn't touch at 27in/1440p, and not at all without Gsync. I wouldn't buy a monitor without that (put the purchase off) unless mine DIED today forcing me to upgrade. The cheapest NAME you'd recognize on newegg is asus at $490. -
cangelini ReplyAs for this quote in the article: "There is still no factory support for refresh rates greater than 60 Hz. "
Untrue Overlord warranties their OC model and is the only OEM making IPS panels specifically for gamers. Why Tom's doesn't have one of the Tempests to review I still don't understand. Oh wait - that's right - it's pay to review on this site! DOH!
This is absolutely not true. Our editorial and advertising departments are purposely kept very separate. In fact, I couldn't even tell you if there are display vendors advertising on the site. We review monitors because they're an important part of the computing experience.
If you or another representative of Tempest would like to submit a display for review, please contact us! Alternatively, we can reach out to you, also :)
