Update: Nvidia Titan X Pascal 12GB Review
Power Consumption Results
Measurement Methodology & Graphical Illustration
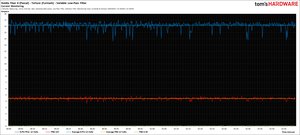
The measurement and analysis software we're gradually transitioning to, PresentMon, integrates a whole host of sensor data with the frame time measurements. This allows us to chart how individual characteristics of a graphics card’s performance (like temperature) influence others (such as power consumption) in real time. We’re including the reader-friendly version of our oscillography measurement graphs as well, of course.
The measurement intervals are twice as long. There's also a hardware-based low-pass filter and software-based variable filter in place (the latter is a feature of the software used to analyze data; it's designed to evaluate the plausibility of very short load peaks and valleys). The resulting curves are a lot smoother than the old ones; we hope you derive more value from them as a result.
Power consumption is measured according to the processes outlined in The Math Behind GPU Power Consumption And PSUs.
You'll find a larger number of bar graphs, and higher-resolution versions of our power consumption charts that you can expand by clicking on them. We restructured our topic sections, added more comparison bar graphs, and, finally, added different scenarios to our measurements. In addition to power consumption, we also examine current to determine whether the graphics card stays within all of its relevant specifications. Our test equipment doesn't change, though:
| Power Consumption Measurement | |
|---|---|
| Test Method | Contact-free DC Measurement at PCIe Slot (Using a Riser Card) Contact-free DC Measurement at External Auxiliary Power Supply Cable Direct Voltage Measurement at Power Supply |
| Test Equipment | 2 x Rohde & Schwarz HMO 3054, 500 MHz Digital Multi-Channel Oscilloscope with Storage Function 4 x Rohde & Schwarz HZO50 Current Probe (1 mA - 30 A, 100 kHz, DC) 4 x Rohde & Schwarz HZ355 (10:1 Probes, 500 MHz) 1 x Rohde & Schwarz HMC 8012 Digital Multimeter with Storage Function |
Power Consumption and Temperature Problems
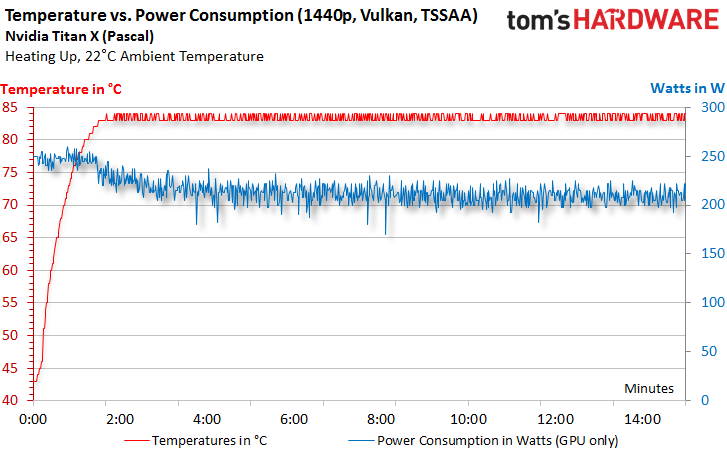
We already mentioned the fascinating new capabilities of our measurement and analysis software. This is why we’re jumping ahead a bit and presenting the card’s power consumption during our Doom benchmark in relation to its temperature. Without thermal throttling, power consumption would land at almost 249 W, regardless of whether we tested at QHD or UHD. We chose to conduct our temperature-related measurements at the lower resolution, since it allows the card to warm up a bit more slowly, making the curves a bit easier to interpret.
The new Titan X hits its thermal limit after only two minutes of full load. Consequently, we set the fan speed to 75% in order to avoid having the better cooling negatively influence our measurement results. Otherwise, power consumption would drop by approximately 30 W to under 220 W during the gaming loop!
Power Consumption at Different Loads
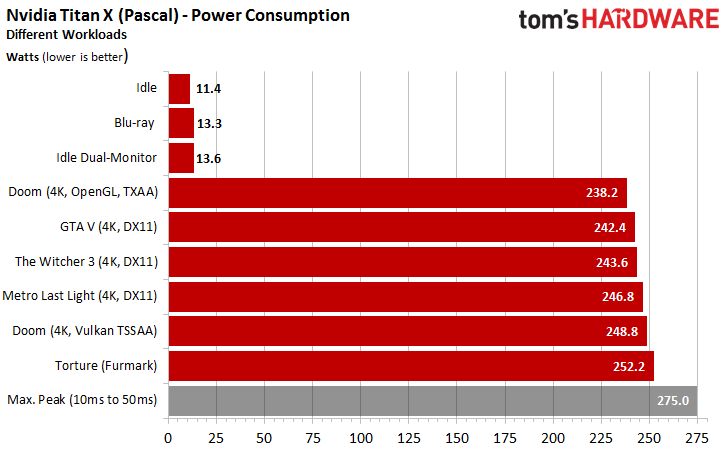
In addition to the usual benchmarks, we include a few different games that rely on a variety of rendering paths and graphics settings. Doom at 4K with TSSAA (8TX) proves to be the most challenging benchmark, pushing the card to 249 W, just shy of its 250 W power limit. The torture loop tops that number with 252 W. However, there aren't many enthusiasts who enjoy playing FurMark.
Get Tom's Hardware's best news and in-depth reviews, straight to your inbox.
The lowest power consumption during the gaming loop also comes from Doom. To achieve this, it’s set to OpenGL and TXAA (1TX), though. All of the other games fall somewhere between the two extremes. As you can see, Metro: Last Light loses its position as the highest-power title in our suite.
The gray bar represents power consumption based on those load peaks that made it through our filters to the smoother curve. That bar doesn't have any practical significance since the peaks we measured are too brief for them to matter (even if the shortest-duration ones were already filtered out by this point).
Power Connector Load Distribution
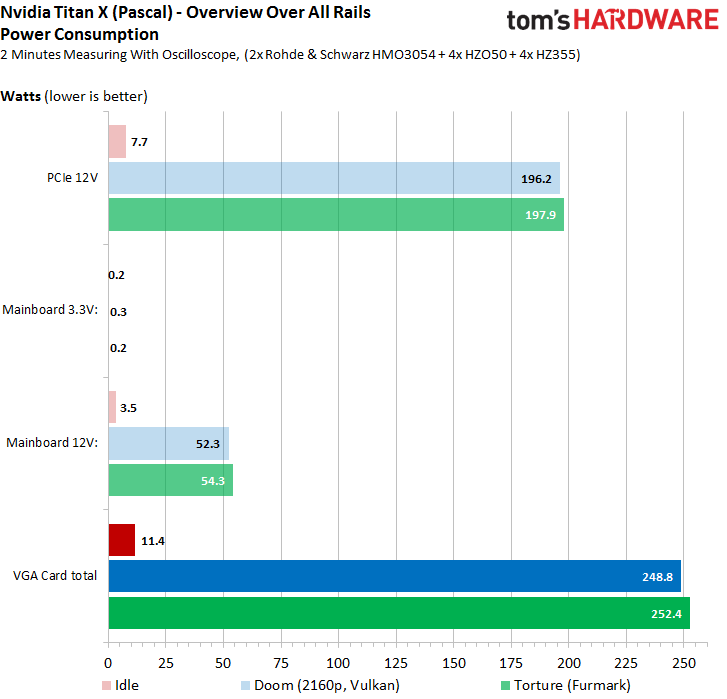
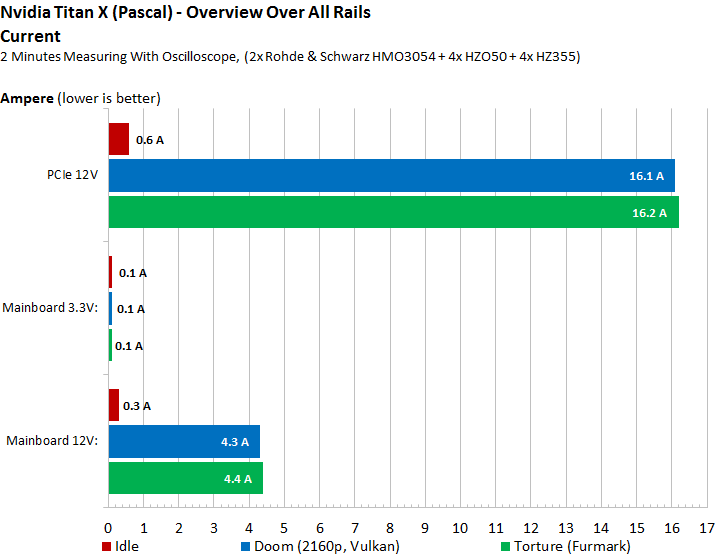
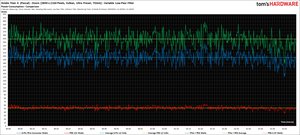
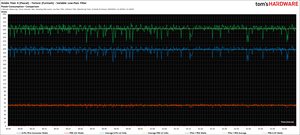
The following chart looks at how the load is distributed across the power rails during a taxing, but realistic, gaming load and stress test. What’s important is that the overall load is balanced well between the motherboard slot connector and six-pin power connector. This is certainly being achieved; Nvidia's Titan X draws less than 55 W via the motherboard’s slot.
Here are the corresponding graphs for gaming and our stress test. Click on them for a larger version.
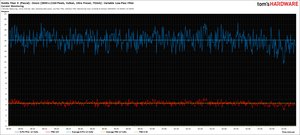
The PCI-SIG’s specifications only apply to current, meaning power consumption results on their own don't tell the whole story. Our readings put the motherboard slot significantly below 4.5 A. Given a ceiling of 5.5 A, this is most certainly on the safe side with lots of room to spare. This result’s hardly surprising in light of our low power consumption measurements for this connector.
Of course, there are larger graphs for the current measurements as well.
Power Consumption Comparison with Other Graphics Cards
Finally, we’d like to know how the Titan X with its GP102 GPU stacks up against other graphics cards. We're using the peak power consumption numbers for this comparison because they're what the previous results consisted of.
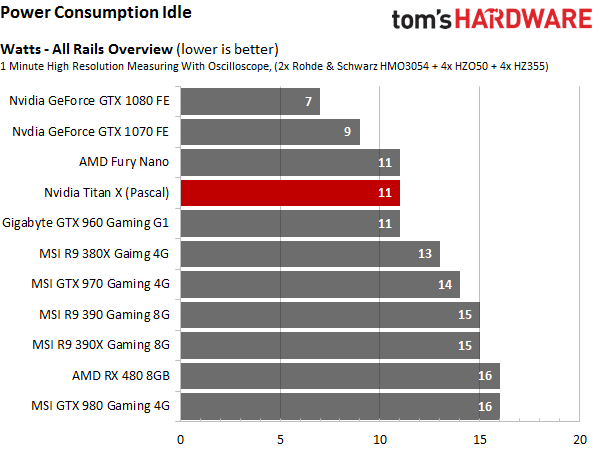
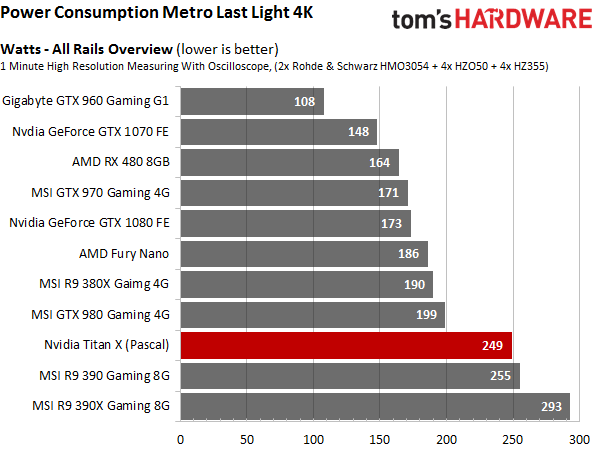
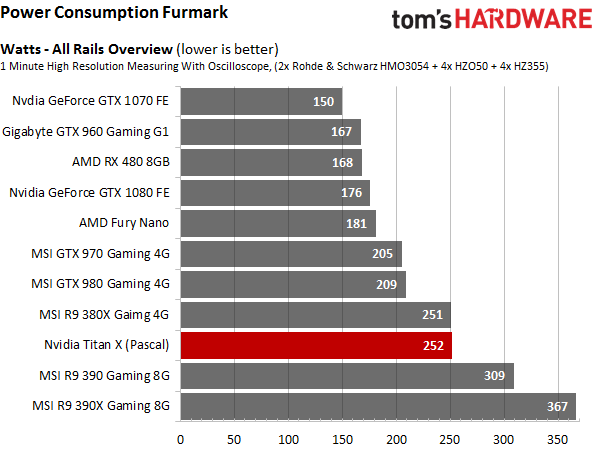
Nvidia stays true to form and sets a hard power target of 250 W. The card’s performance could be increased tremendously by getting rid of that cap. Unfortunately, our German lab doesn't have a second sample of the card, so we can’t run the usual overclocking tests or reconfigure the card for our customary water cooling setup.
MORE: Best Graphics Cards
MORE: Desktop GPU Performance Hierarchy Table
MORE: All Graphics Content
Current page: Power Consumption Results
Prev Page Rise of the Tomb Raider, The Division And The Witcher 3 Next Page Frequency, Temperature And Noise Results-
adamovera Archived comments are found here: http://www.tomshardware.com/forum/id-3142290/nvidia-titan-pascal-12gb-review.htmlReply -
chuckydb Well, the thermal throttling was to be expected with such a useless cooler, but that should not be an issue. If you are spending this much on a gpu, you should water-cool it!!! Problem solvedReply -
Jeff Fx I might spend $1,200 on a Titan X, because between 4K gaming and VR I'll get a lot of use out of it, but they don't seem to be available at anything close to that price at this time.Reply
Any word when we can get these at $1,200 or less?
I wish I was confident that we'd get good SLI support in VR, so I could just get a pair of 1080s, but I've had so many problems in the past with SLI in 3D, that getting the fastest single-card solution available seems like the best choice to me. -
ingtar33 $1200 for a gpu which temp throttles under load? THG, you guys raked AMD over the coals for this type of nonsense, and that was on a $500 card at the time.Reply -
Sakkura Interesting to see how the Titan X turned into an R9 Nano in your anechoic chamber. :DReply
As for the Titan X, that cooler just isn't good enough. Not sure I agree that memory modules running 90 degrees C is "well below" the manufacturer's limit of 95 degrees C. What if your ambient temperature is 5 or 10 degrees higher? -
hotroderx Basically the cards just one giant cash grab... I am shocked toms isn't denouncing this card! I could just see if Intel rated a CPU at 6ghz for the first 10secs it was running. Then throttled it back to something more manageable! but for those 10 secs you had the worlds fastest retail CPU.Reply -
tamalero Does this means there will be a GP101 with all core enabled later on? as in TI version?Reply -
hannibal TitanX Ti... No, 1080ti is cut down version. Most full ships will go to professinal cards and maybe we will see TitanZ later...Reply
-
blazorthon An extra $200 for a gimped cooler makes for a disappointing addition to the Titan cards.Reply
