Why you can trust Tom's Hardware
Comparison Products
Up for comparison, we threw in a handful of entry-level NVMe competitors, including the WD Blue SN550 1TB, Intel SSD 665p 1TB, and Crucial P1 1TB. We added in Team Group’s MP33 1TB, which is close to what the non-US version of the P300 would perform like with its SM2263XT controller and 96L NAND flash. Additionally, we threw in Adata’s XPG SX8200 Pro and Corsair’s Force MP600, two top-ranking NVMe SSDs as well as Crucial’s MX500 and WD’s Black HDD, SATA based competitors, for good measure.
Game Scene Loading - Final Fantasy XIV
The Final Fantasy XIV StormBlood and Stormbringer are two free real-world game benchmarks that easily and accurately compare game load times without the inaccuracy of using a stopwatch.
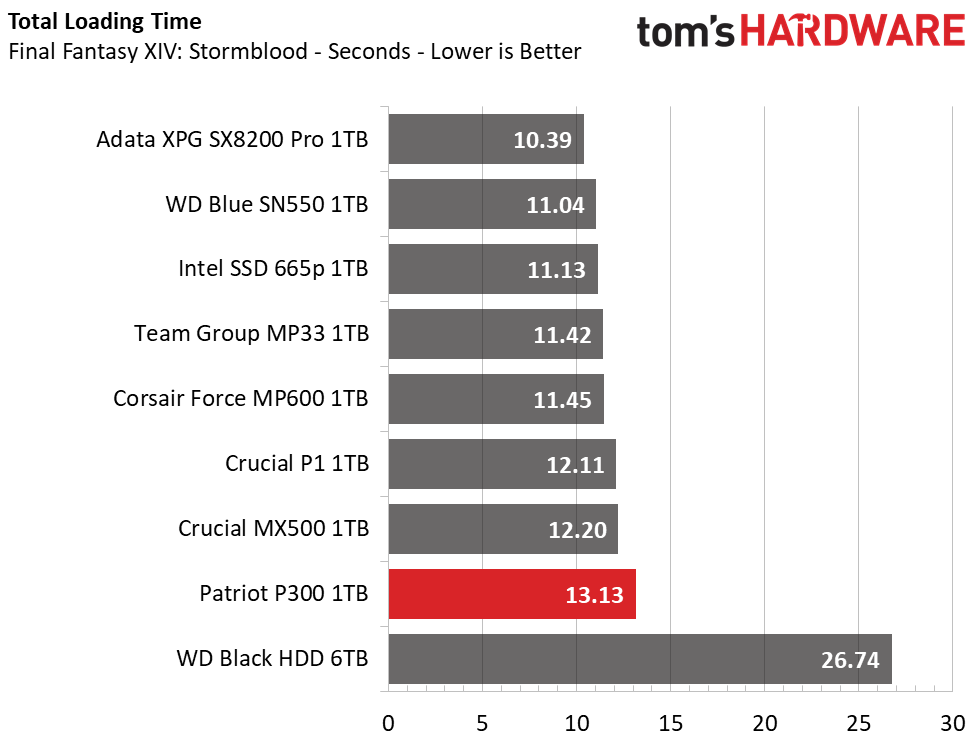
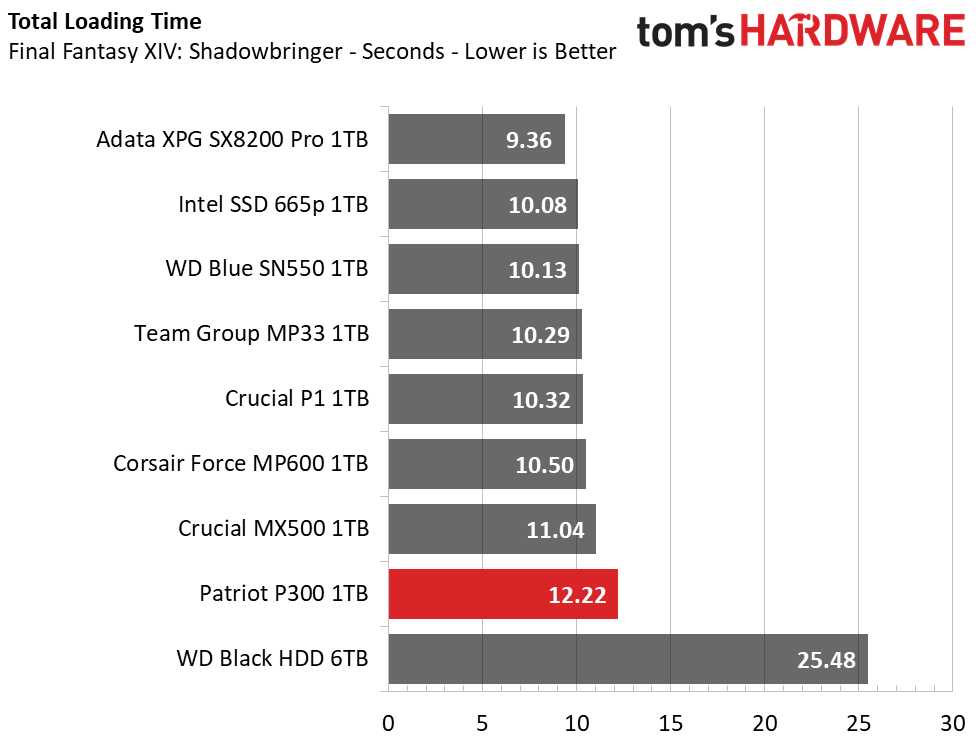
Patriot’s P300 lags the competition when it comes to serving up game data. With total load times that exceed the SATA-based Crucial MX500, it falls into eighth place. That doesn't exactly make the drive slow though. It still offers significantly faster performance than an HDD.
Transfer Rates – DiskBench
We use the DiskBench storage benchmarking tool to test file transfer performance with our own custom blocks of data. Our 50GB data set includes 31,227 files of various types, like pictures, PDFs, and videos. Our 100GB includes 22,579 files with 50GB of them being large movies. We copy the data sets to new folders and then follow-up with a reading test of a newly written 6.5GB zip file, 8GB test file, and a 15GB movie file.
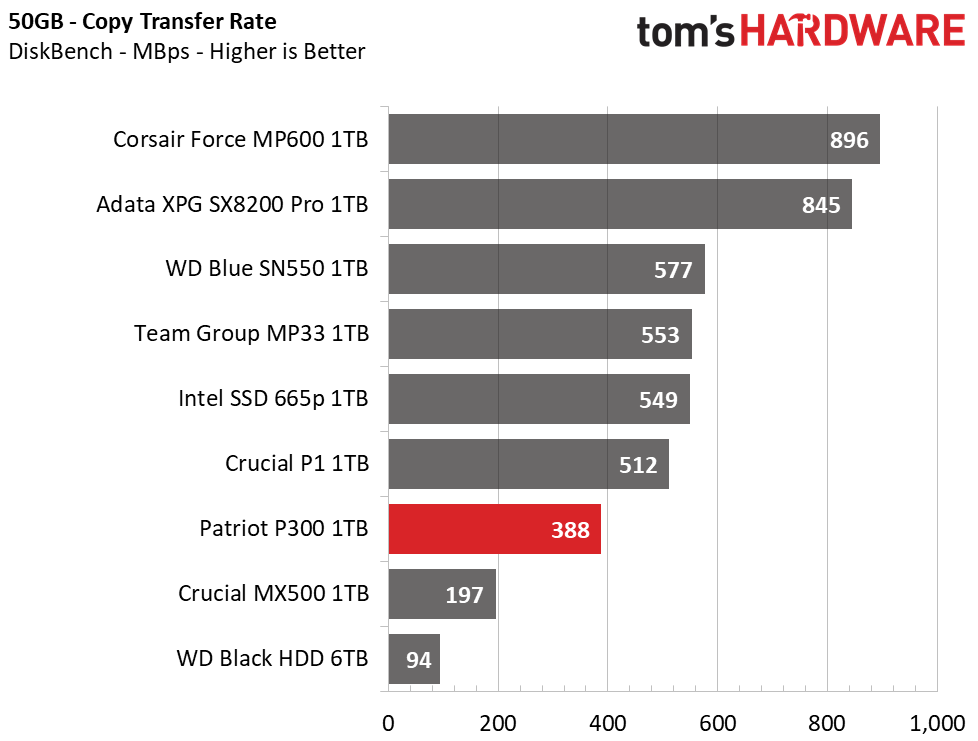
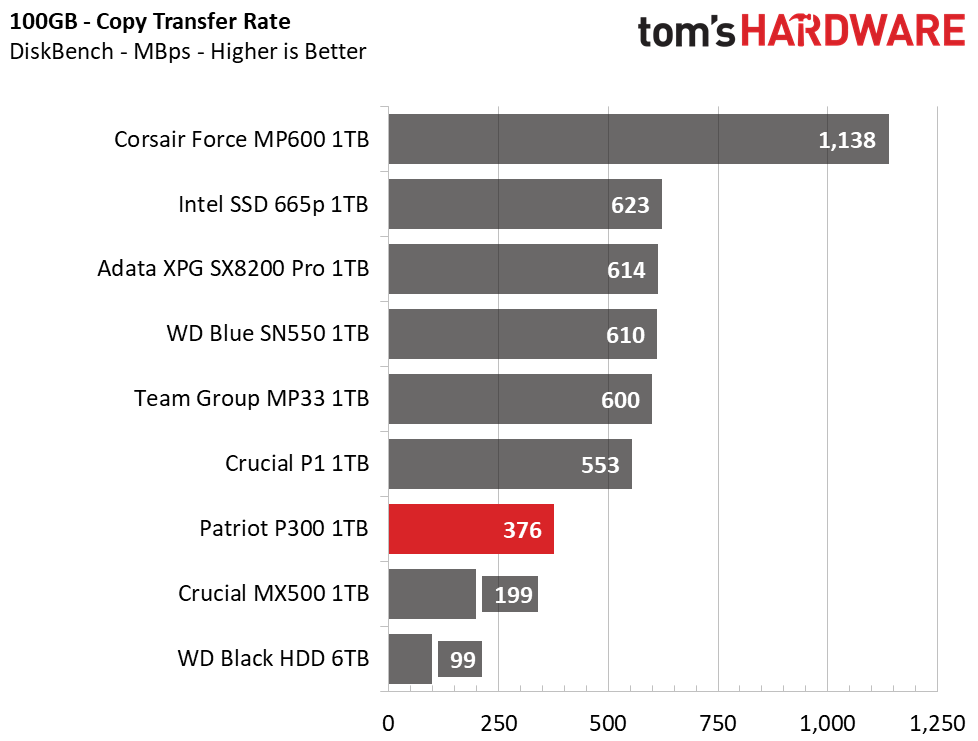
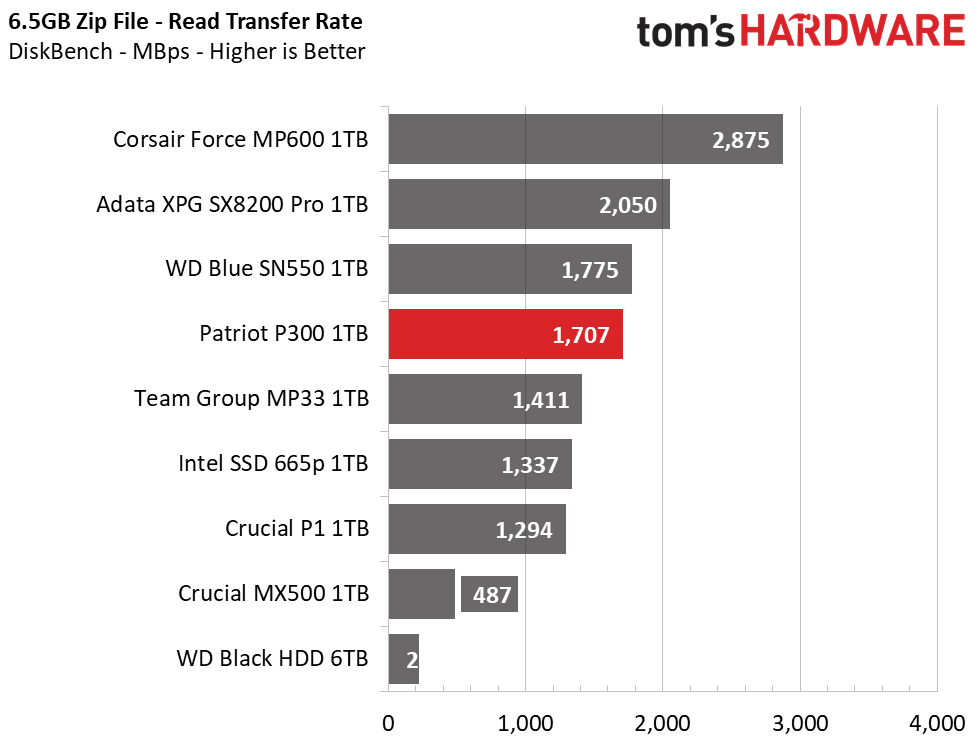
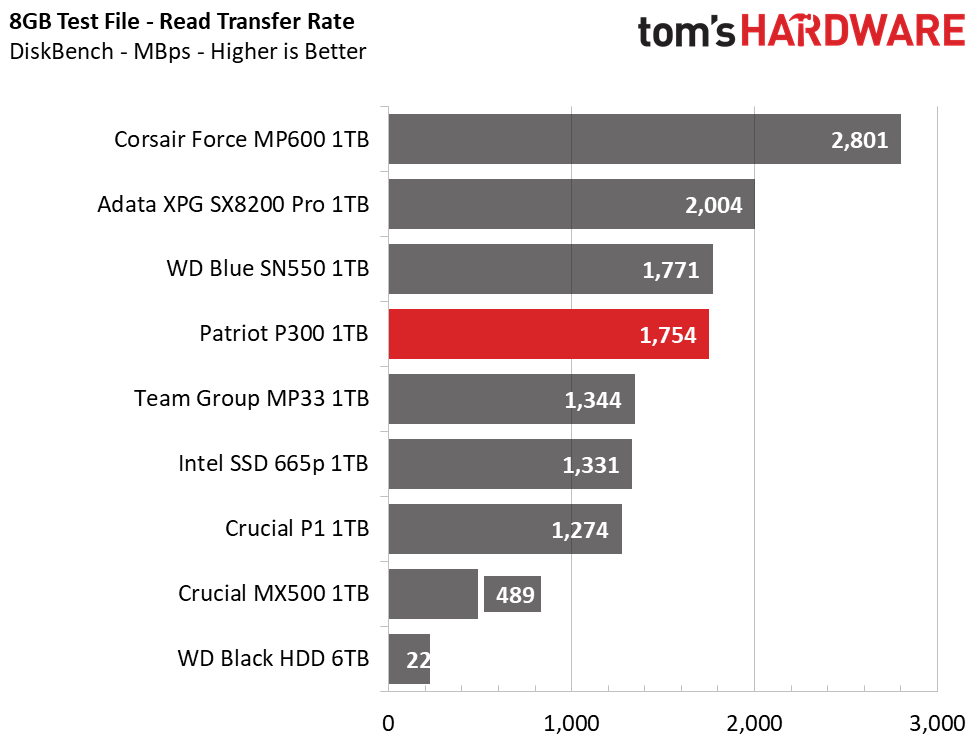
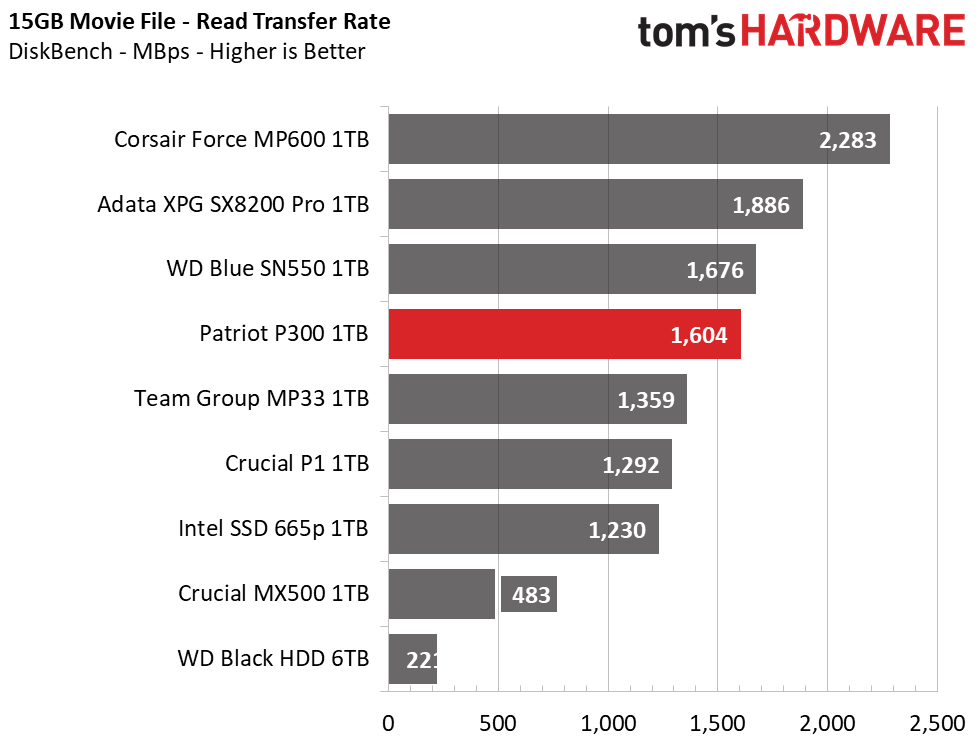
When reading large files from Patriot’s P300, the performance was snappy and much faster than the Crucial MX500, closer to that of the WD Blue SN500. But, while large file reads were quick, large folder copy tests show sluggish performance in comparison to the rest of the NVMe-based competitors. Still, it was about twice as fast as the MX500 at copying our large test folders and 4 times faster than the WD Black HDD.
Trace Testing – PCMark 10 Storage Tests
PCMark 10 is a trace-based benchmark that uses a wide-ranging set of real-world traces from popular applications and common tasks to measure the performance of storage devices. The quick benchmark is more relatable to those who use their PCs lightly, while the full benchmark relates more to power users. If you are using the device as a secondary drive, the data test will be of most relevance.
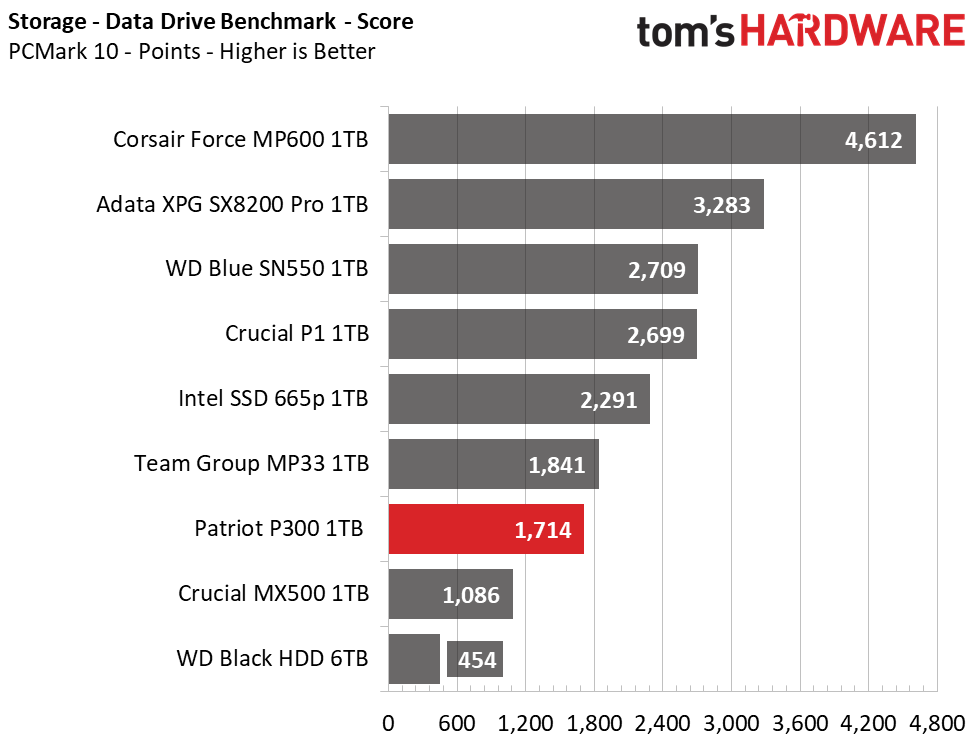
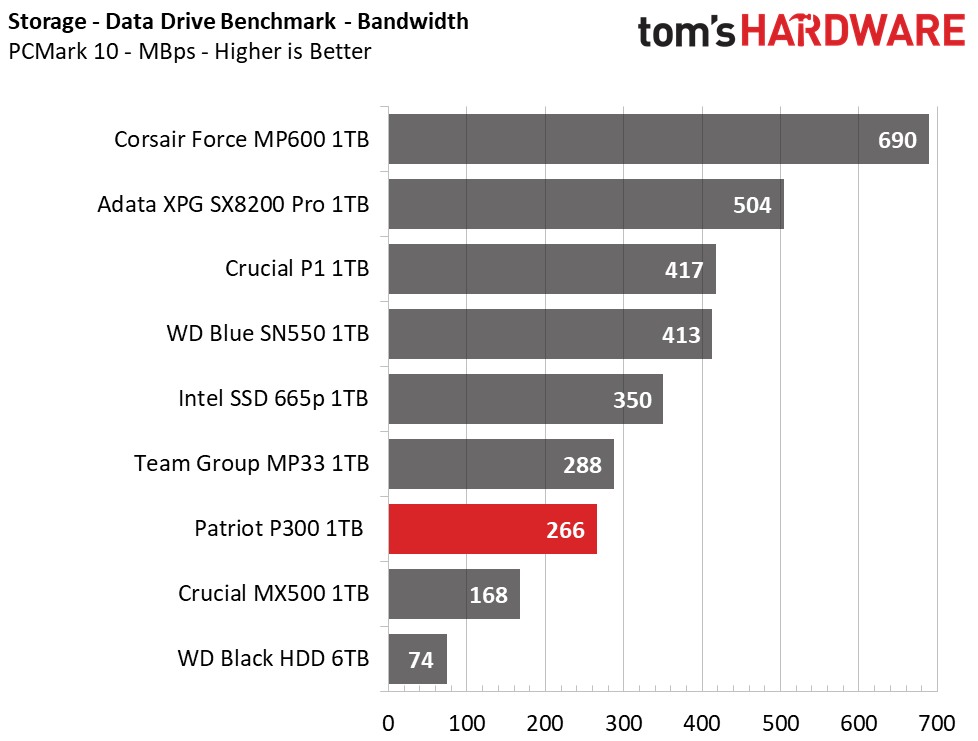
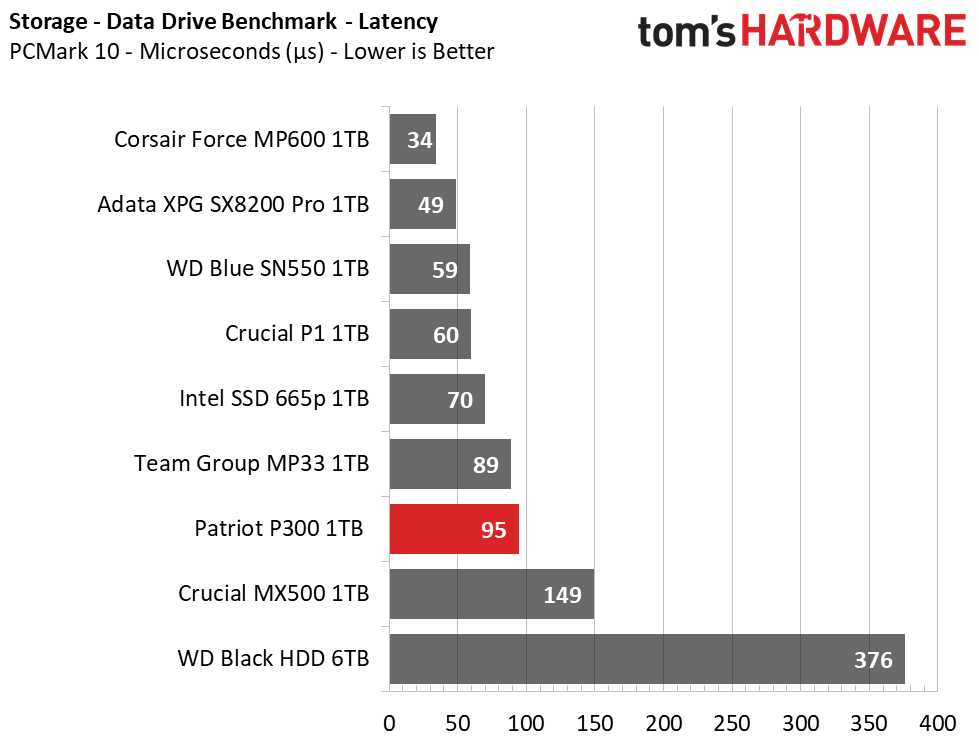
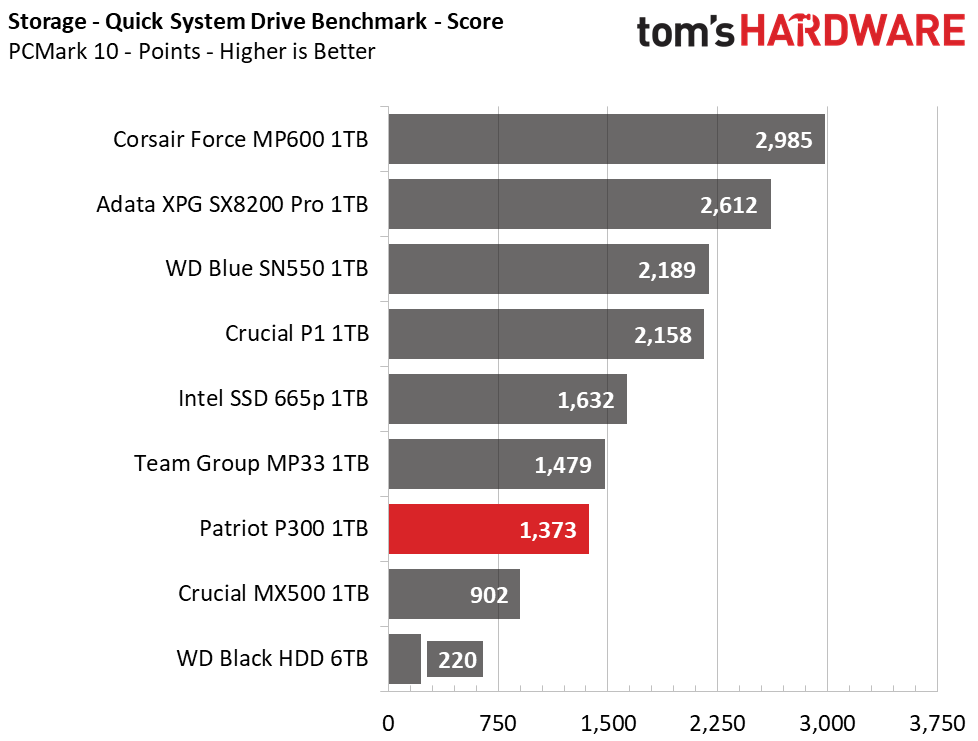
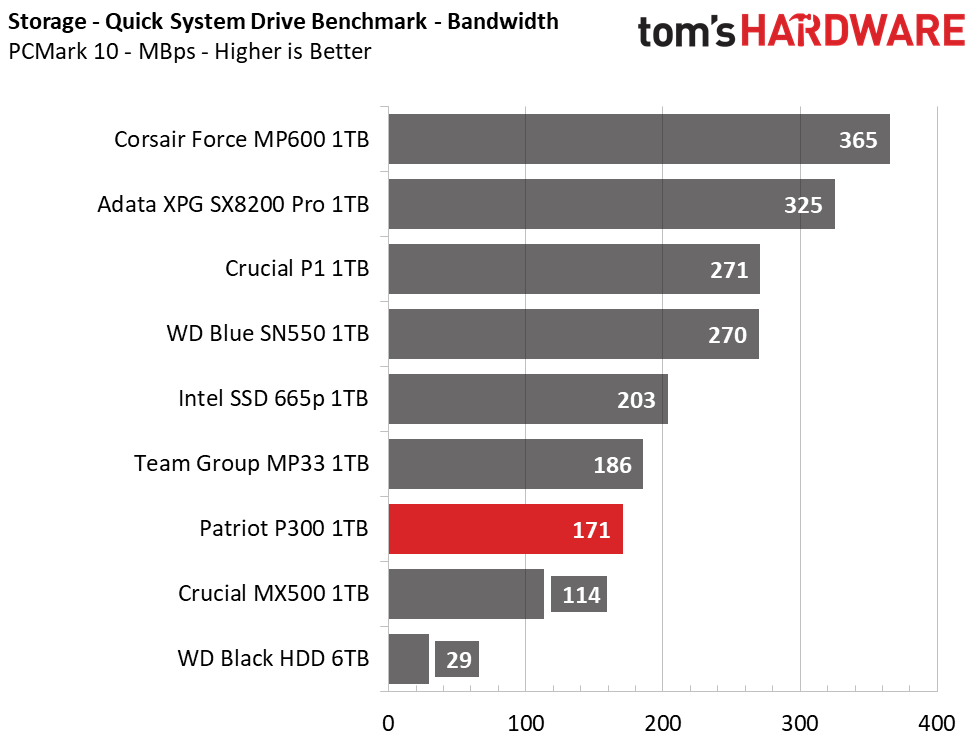
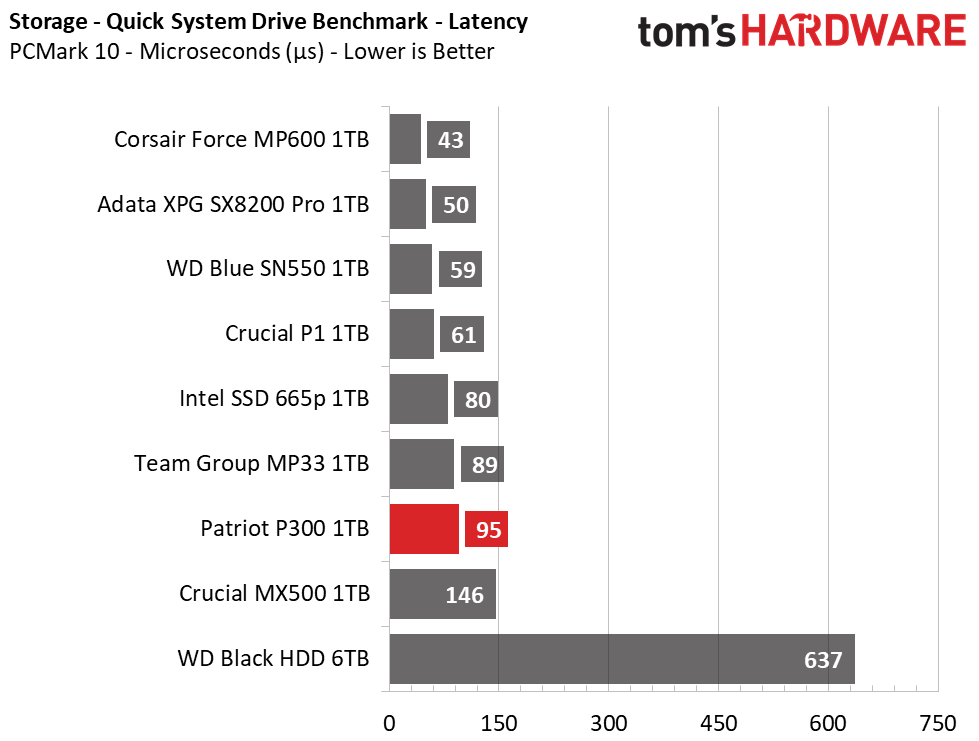
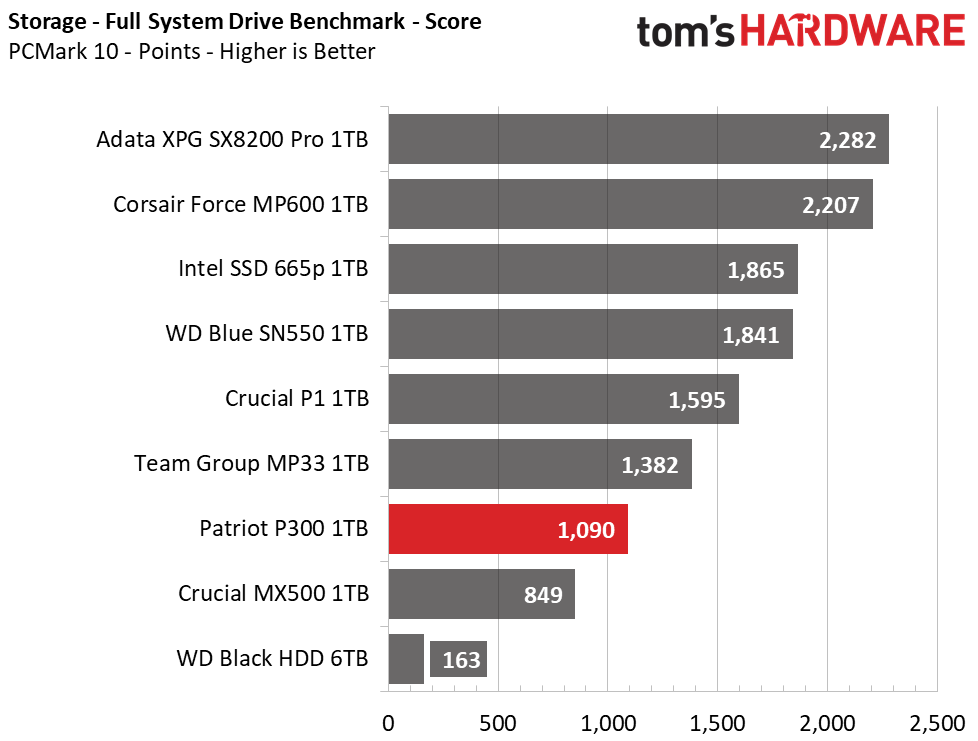
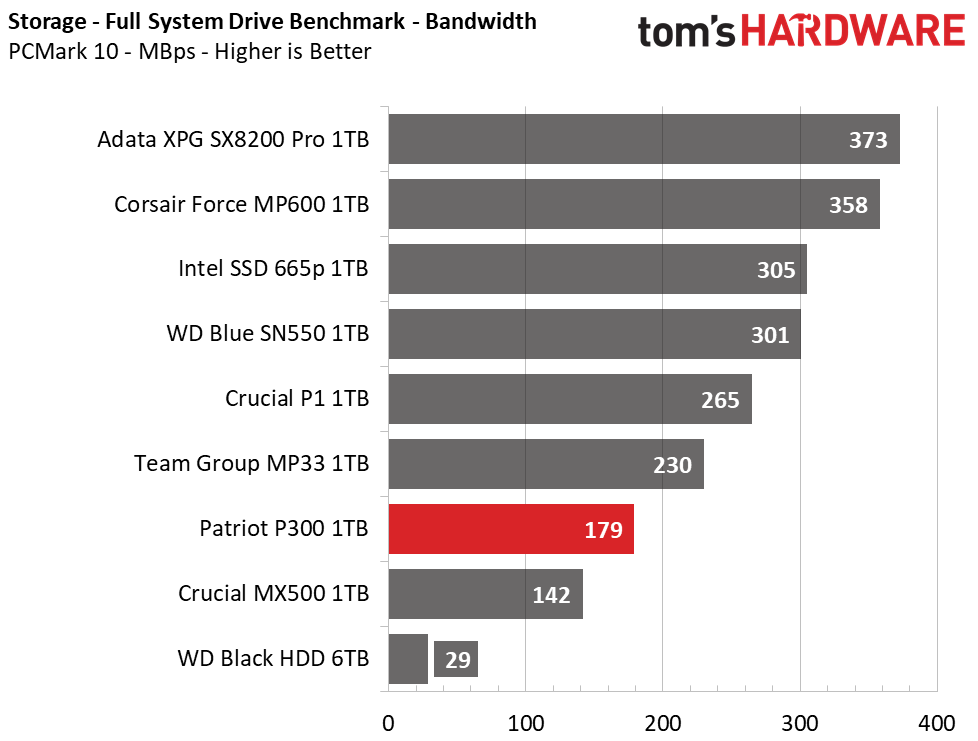
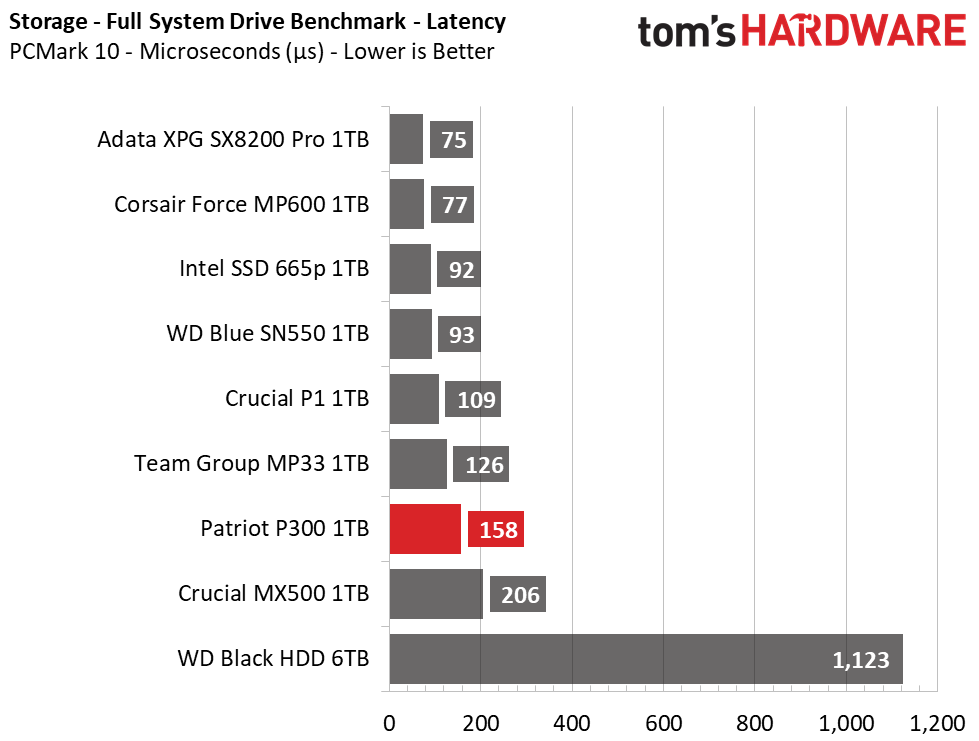
Like Team Group’s DRAMless MP33, the P300 ranks slower than any of the DRAM-based SSDs. Both perform relatively similar overall, but SMI’s SM2263XT is a bit more responsive here. Again, the P300 maintains a lead over the MX500, meaning that when dealing with application data, the P300 will offer a snappier user experience over SATA competitors.
Get Tom's Hardware's best news and in-depth reviews, straight to your inbox.
Trace Testing – SPECworkstation 3
Like PCMark 10, SPECworkstation 3 is a trace-based benchmark, but it is designed to push the system harder by measuring workstation performance in professional applications.


In contrast to its performance in PCMark 10, Patriot’s P300 shows a bit stronger performance than the Team Group MP33 here. Completing the test about 14 minutes quicker, it showed stronger read and write performance when pressed with heavier loads. Both the P1 and 665p, QLC-based competitors, deliver faster performances, however, with the additional DRAM buffers onboard their PCBs.
Synthetics - ATTO
ATTO is a simple and free application that SSD vendors commonly use to assign sequential performance specifications to their products. It also gives us insight into how the device handles different file sizes.
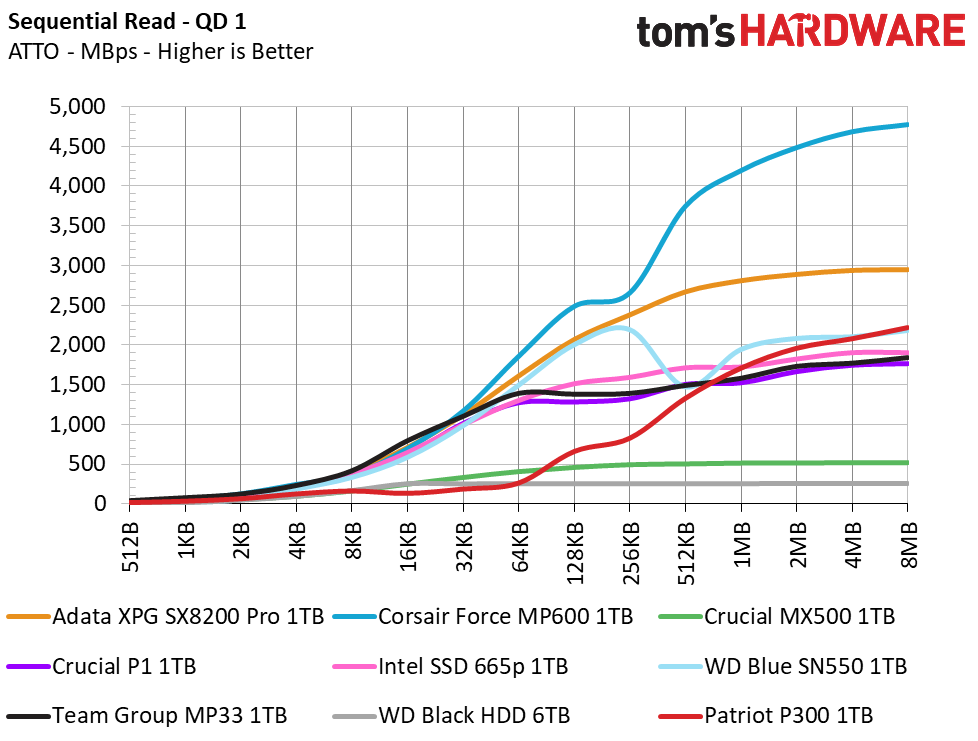
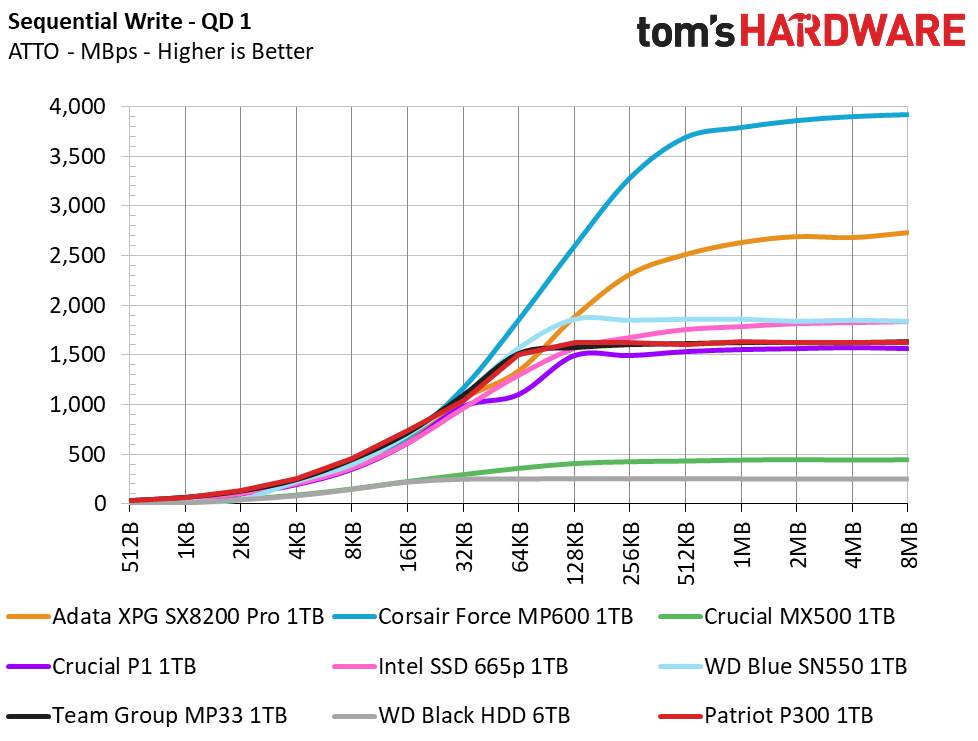
In ATTO, we tested Patriot’s P300 at a QD of 1, representing most day-to-day file access at various block sizes. The device’s read performance at small file sizes leaves it clearly lagging behind the competition. Patriot’s P300 display’s responsive sequential write performance, however. These differences may explain why PCMark 10 favored the Team Group MP33 while SPEC workstation 3 favored the Patriot P300.
Synthetic Testing - iometer
iometer is an advanced and highly configurable storage benchmarking tool that vendors often use to measure the performance of their devices.
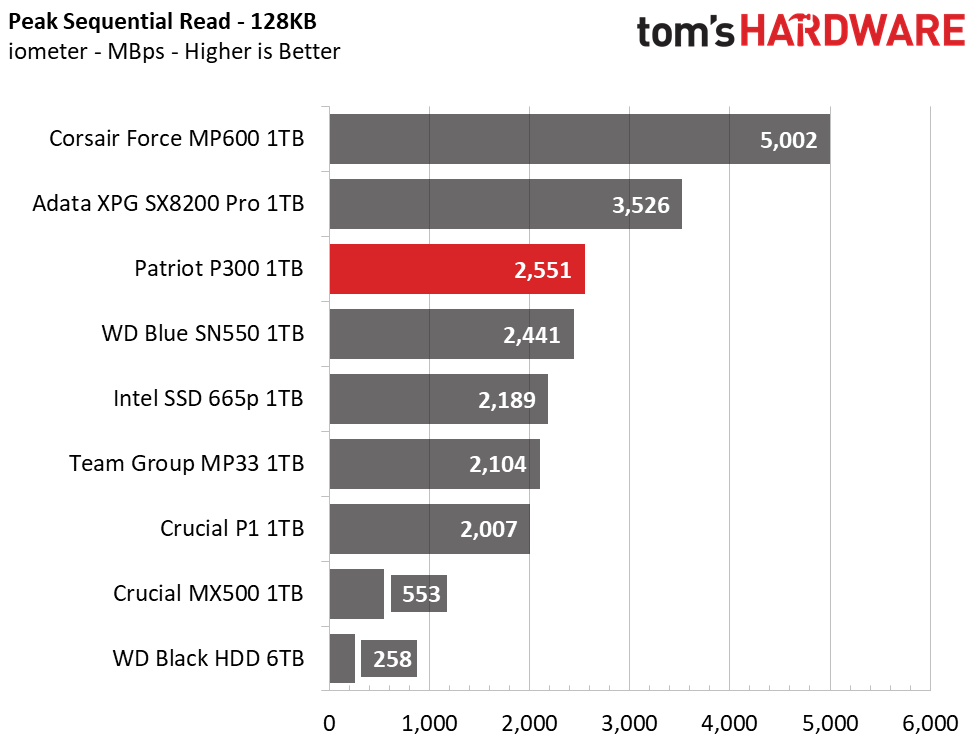
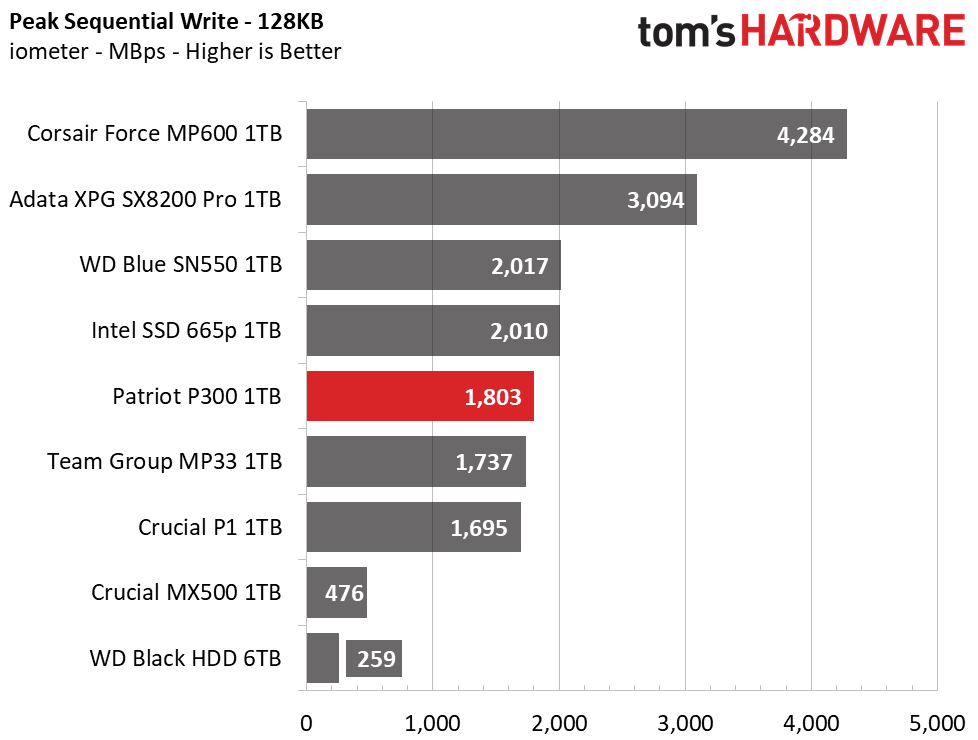
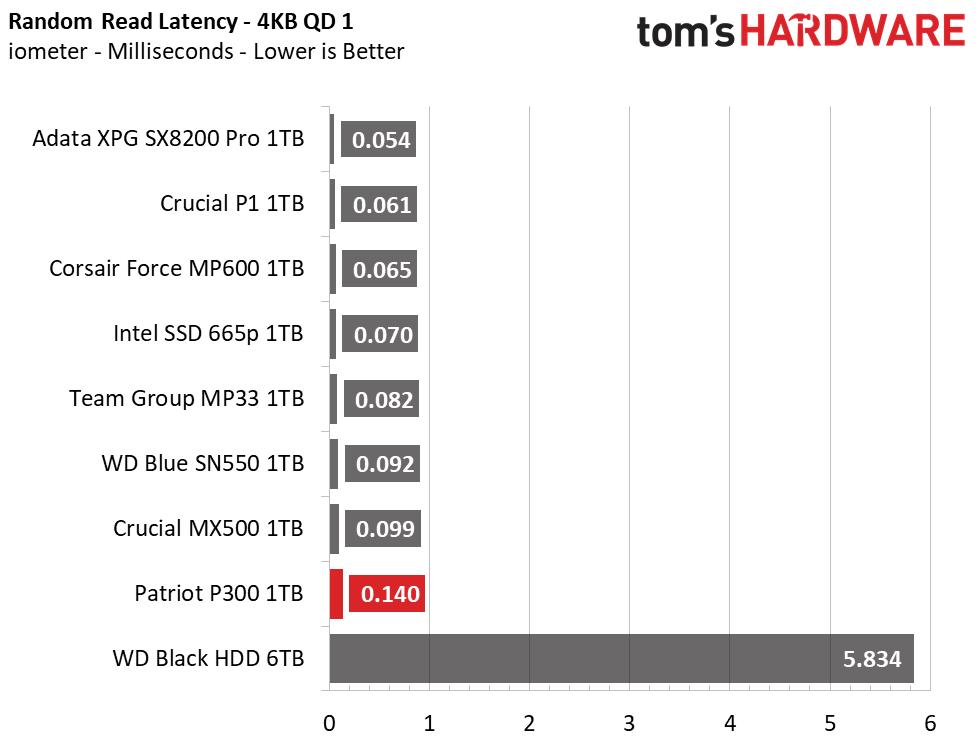
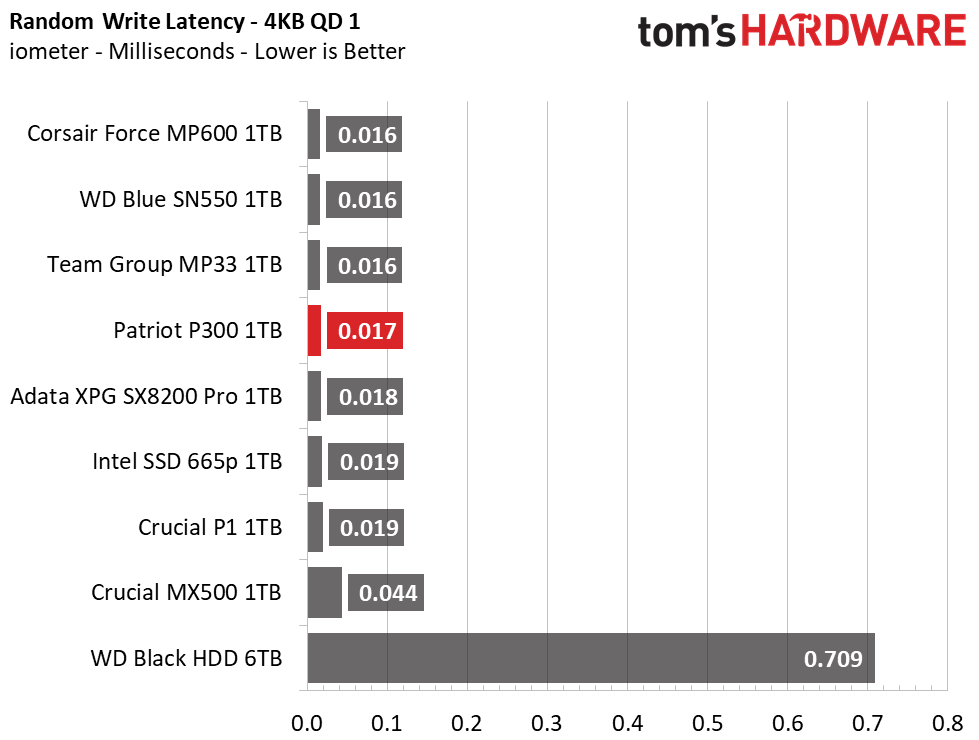
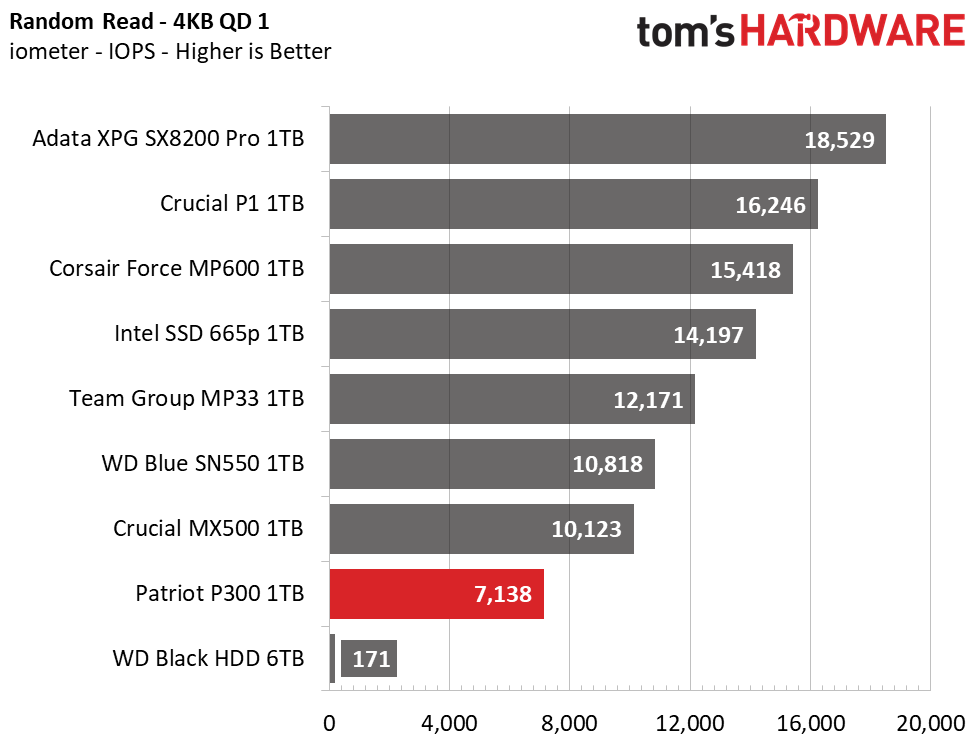
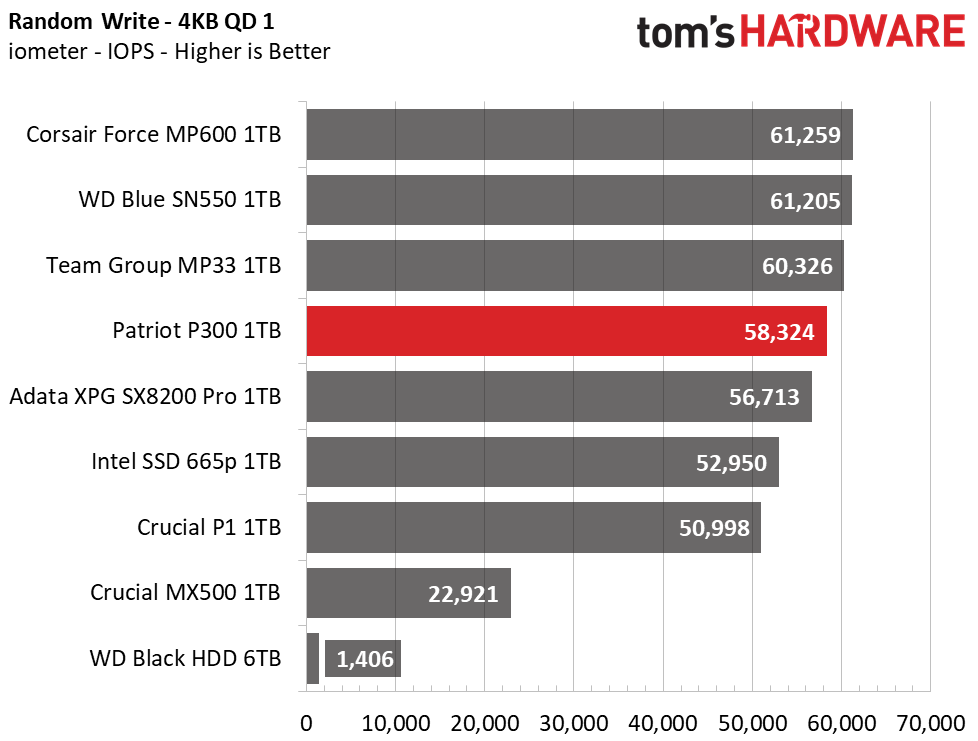
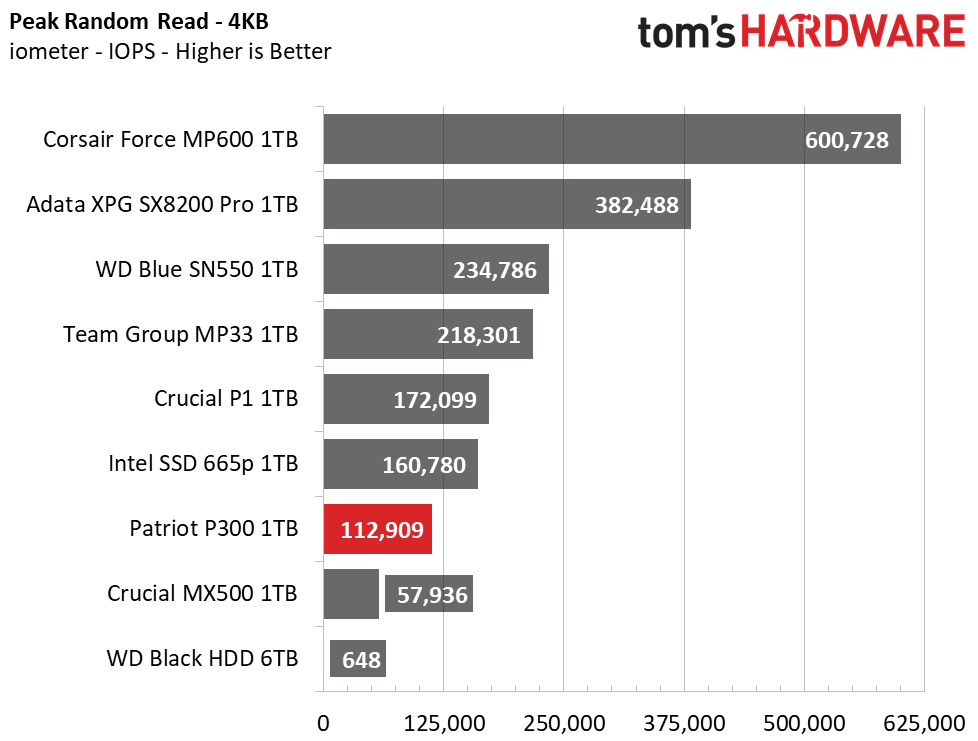
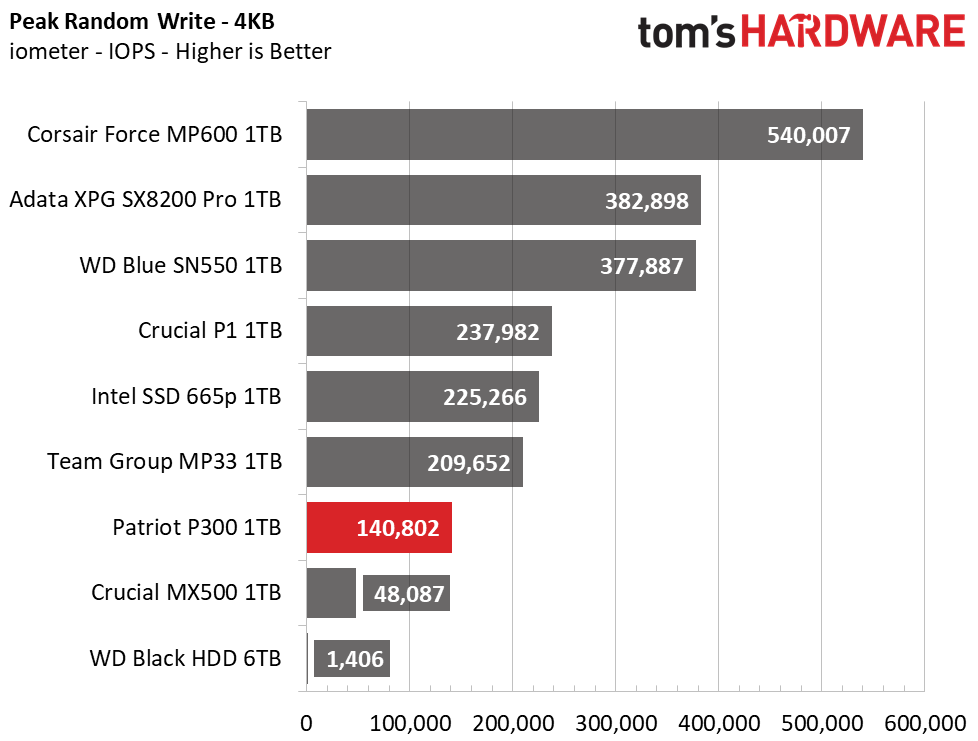
We measured Patriot’s P300 to hit peak throughput speeds about 2.6/1.8 GBps read/write. But it takes multiple transfers to attain that read speed. Random performance is weak compared to competitors as well. When randomly reading from it at a QD1, the P300 lags behind the MX500. Compared to a plain old HDD, however, the P300 offers a significantly faster performance any way you look at it.
Sustained Write Performance, Cache Recovery, and Temperature
Official write specifications are only part of the performance picture. Most SSD makers implement a write cache, which is a fast area of (usually) pseudo-SLC programmed flash that absorbs incoming data. Sustained write speeds can suffer tremendously once the workload spills outside of the cache and into the "native" TLC or QLC flash. We use iometer to hammer the SSD with sequential writes for 15 minutes to measure both the size of the write cache and performance after the cache is saturated. We also monitor cache recovery via multiple idle rounds.
When possible, we also log the temperature of the drive via the S.M.A.R.T. data to see when (or if) thermal throttling kicks in and how it impacts performance. Bear in mind that results will vary based on the workload and ambient air temperature.
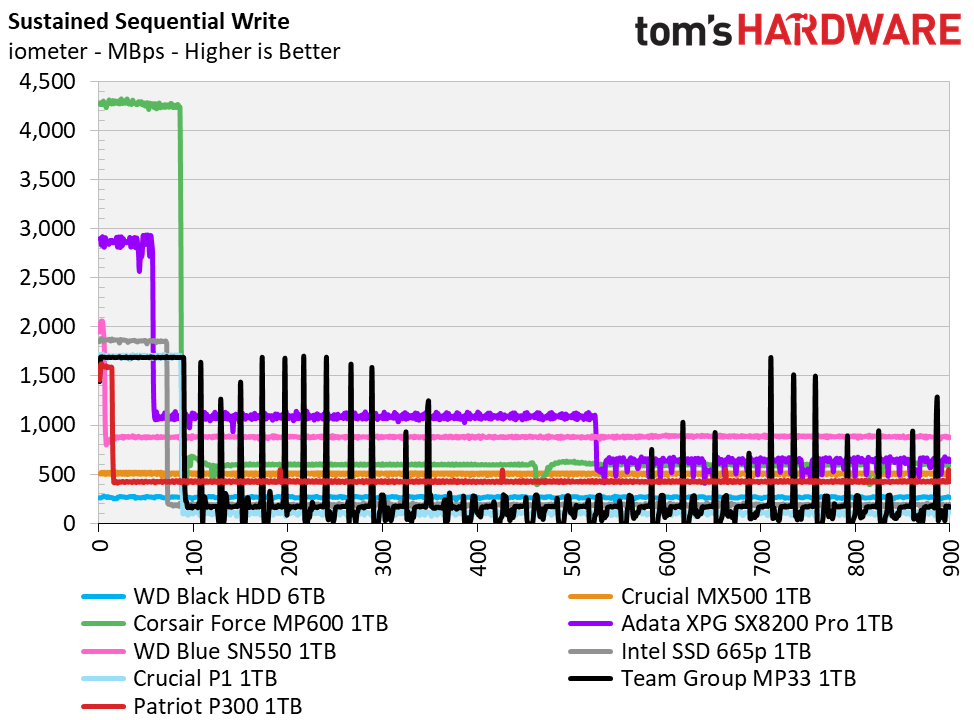
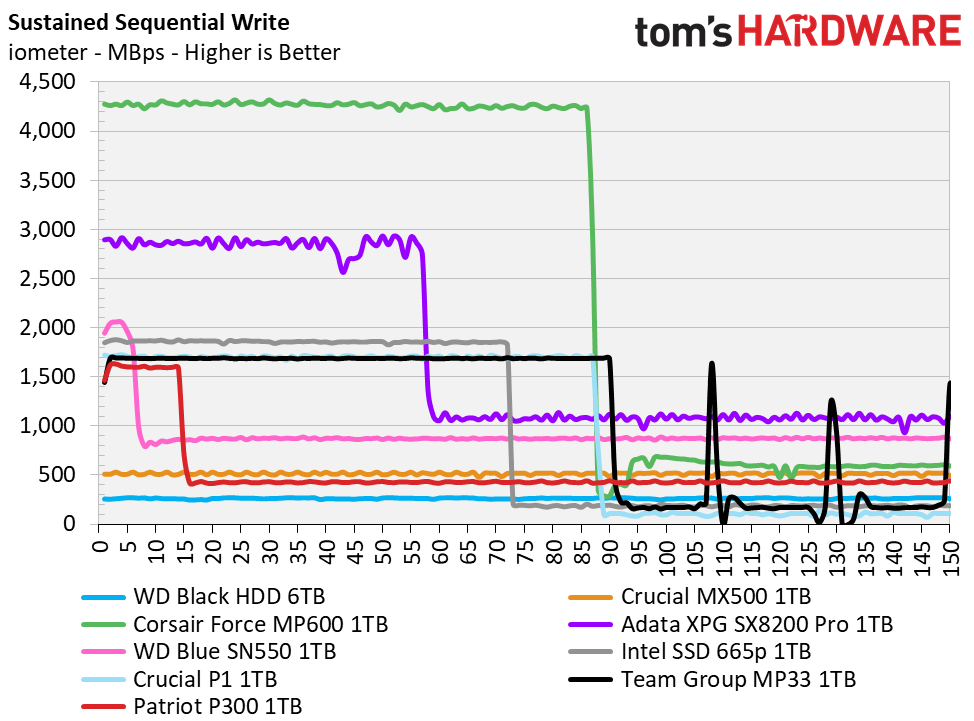
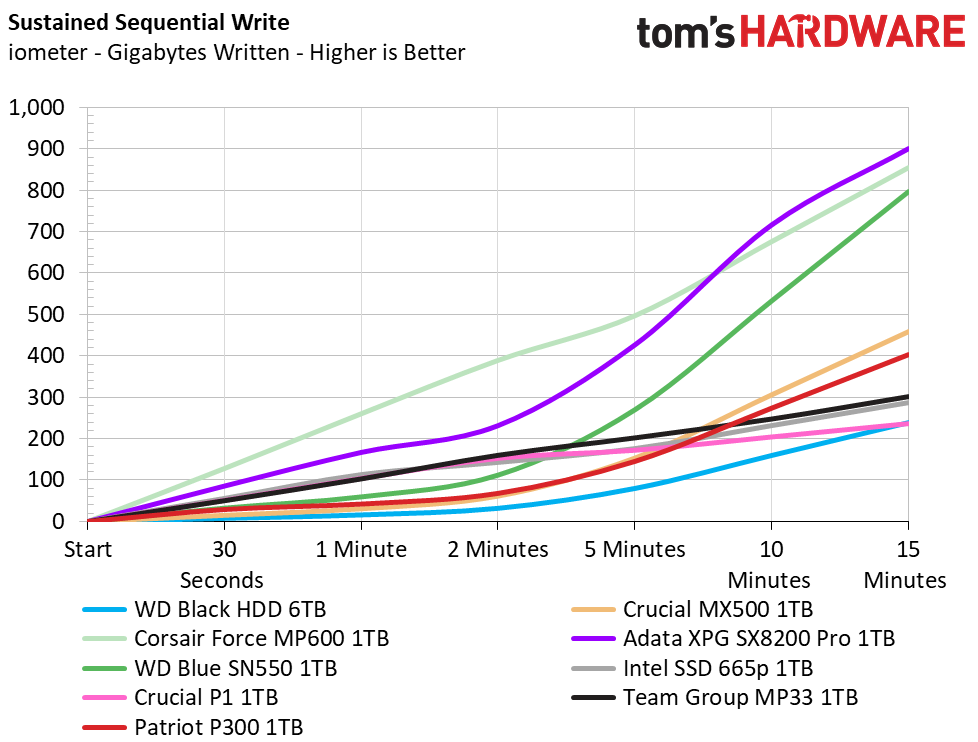
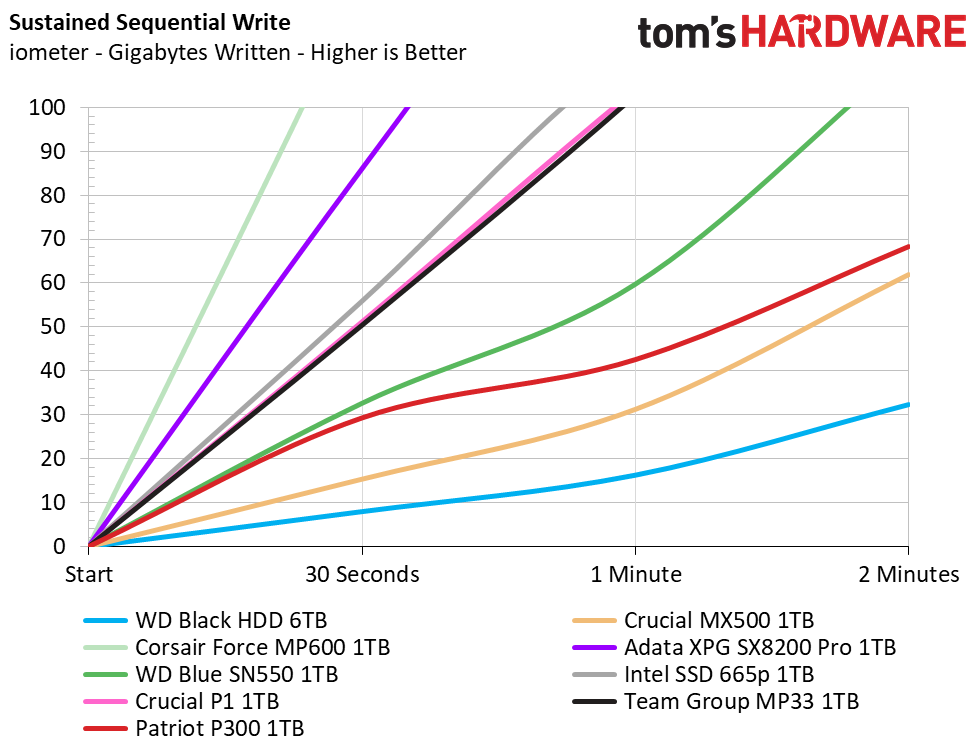
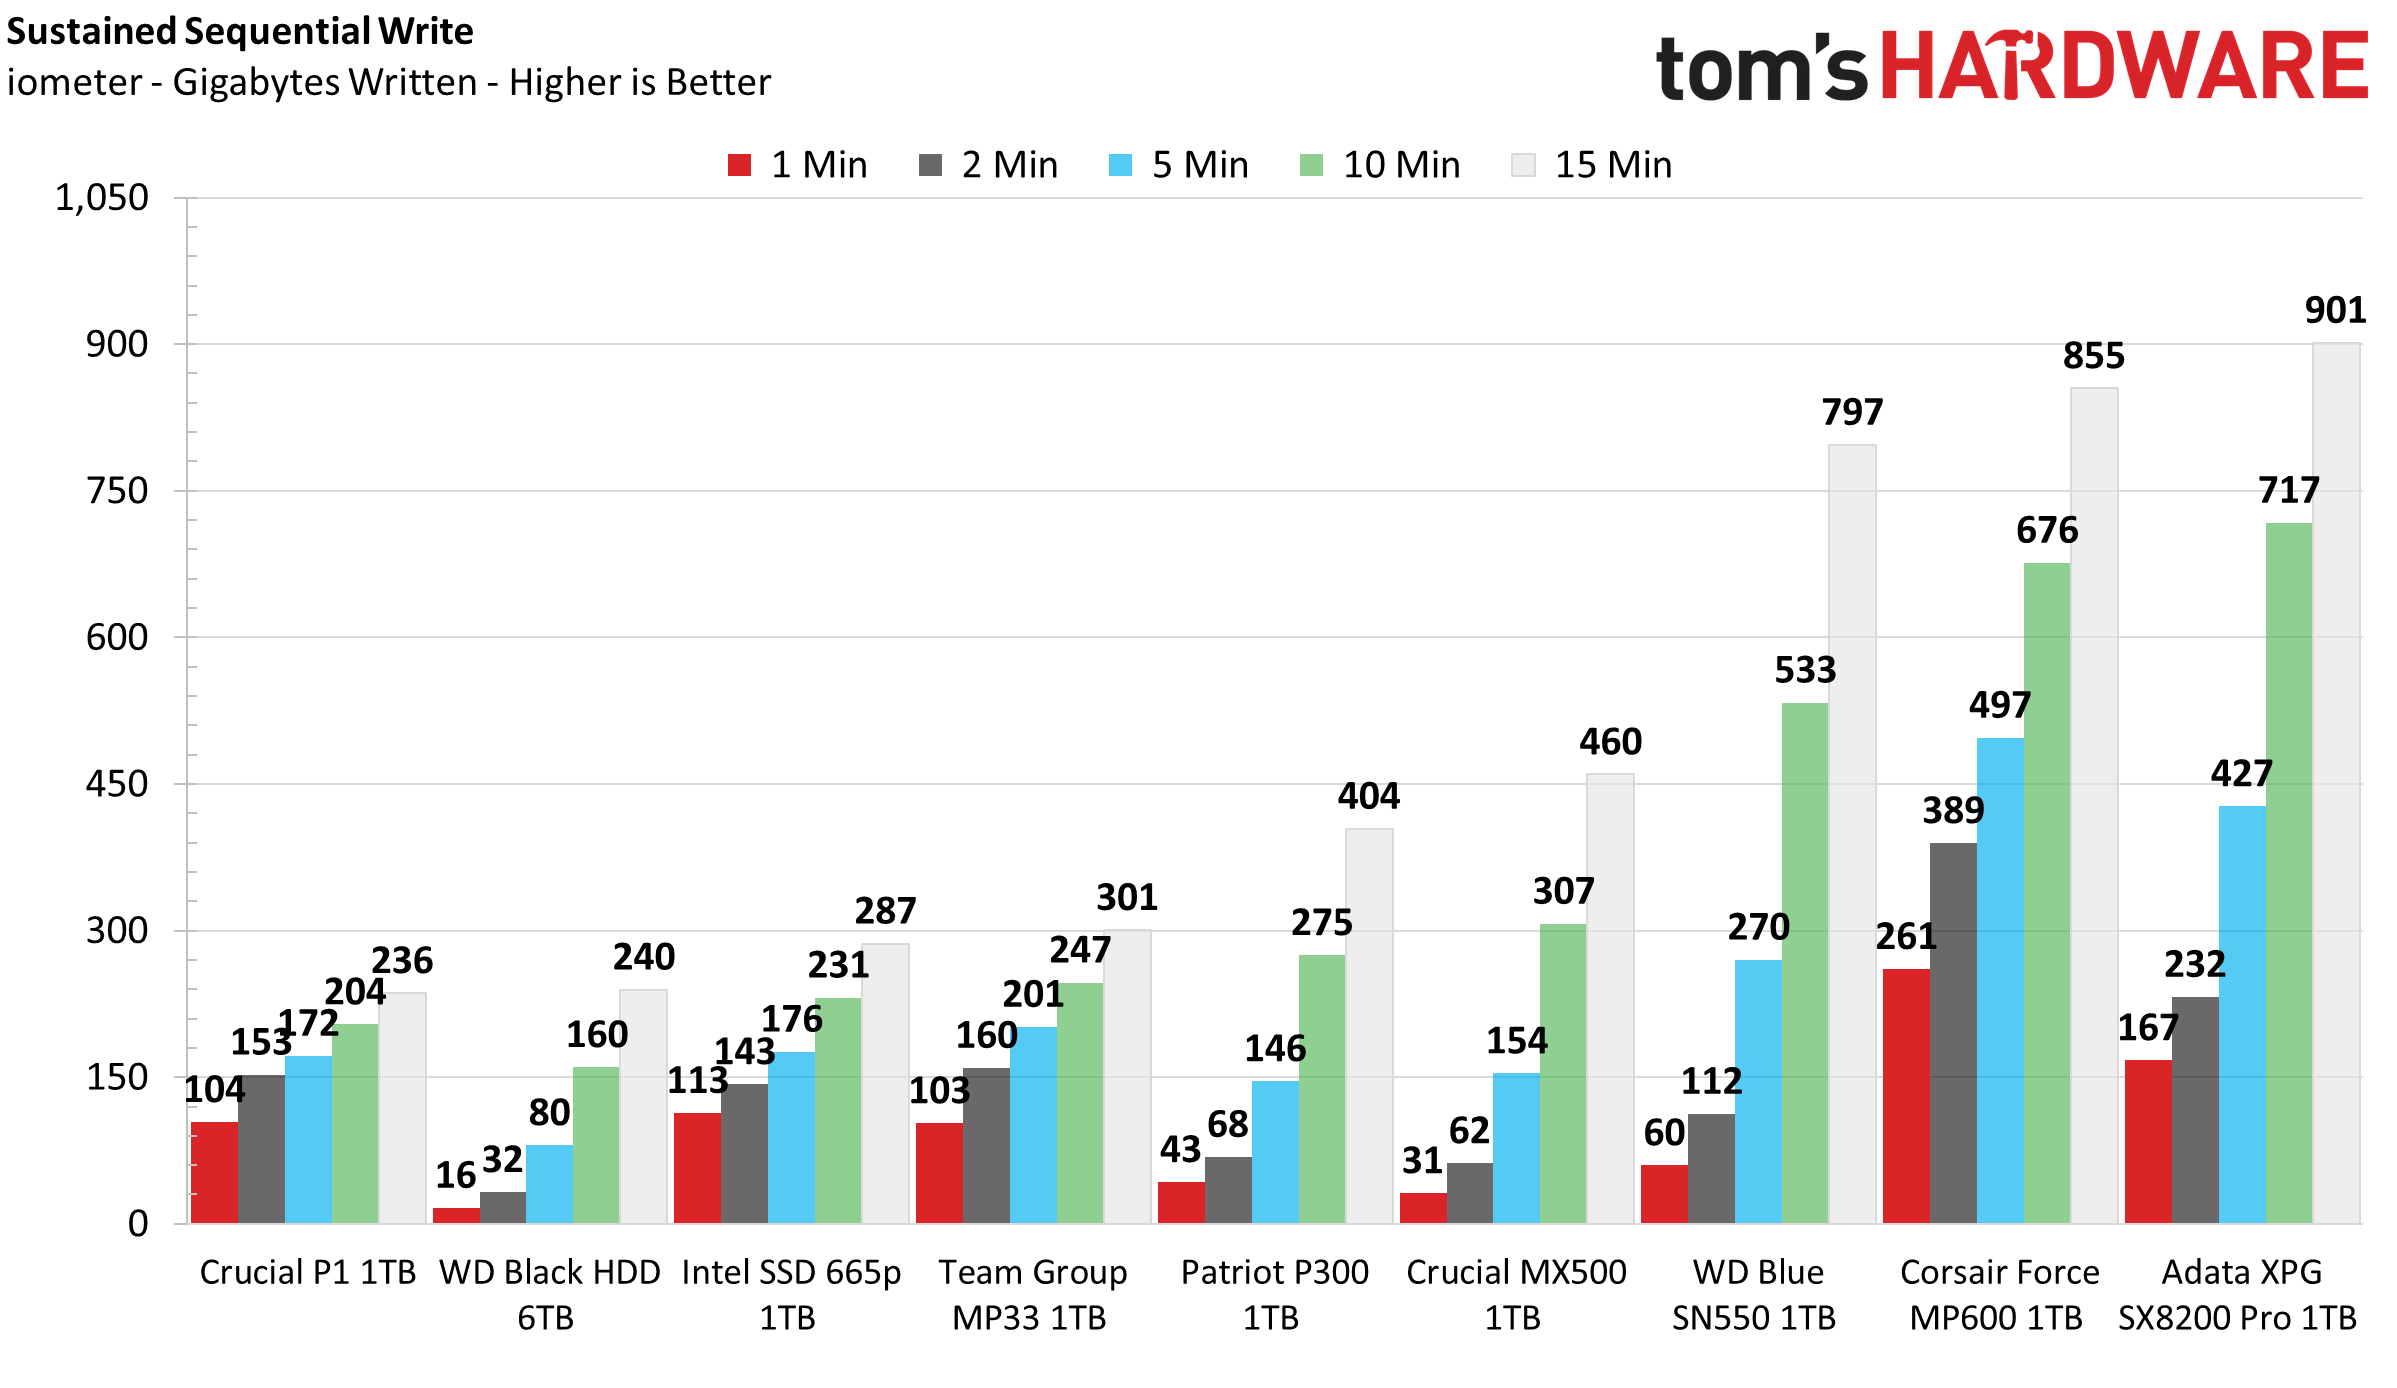
Peaking at about 1.6 GBps, the P300 wrote a little over 24GB of data before the write speed degraded to an average speed of 430 MBps from then on out. Thanks to its relatively small SLC write cache, the P300 is capable of much more consistent write performance over the Team Group MP33 featuring the SMI SM2263XT controller. And, given just 30 seconds of idle time after writing is complete, the 24GB write cache is recovered and ready for more.
When moving files around without airflow in a 25C environment, the controller reported temps in the mid-60s, peaking at 68C after moving 400GB of data to the drive. Thus, Patriot’s P300 usually won’t need any sort of heatsink or airflow to aid in cooling it in most use cases.
Power Consumption
We use the Quarch HD Programmable Power Module to gain a deeper understanding of power characteristics. Idle power consumption is a very important aspect to consider, especially if you're looking for a new drive for your laptop. Some SSDs can consume watts of power at idle while better-suited ones sip just milliwatts. Average workload power consumption and max consumption are two other aspects of power consumption, but performance-per-watt is more important. A drive might consume more power during any given workload, but accomplishing a task faster allows the drive to drop into an idle state faster, which ultimately saves power.
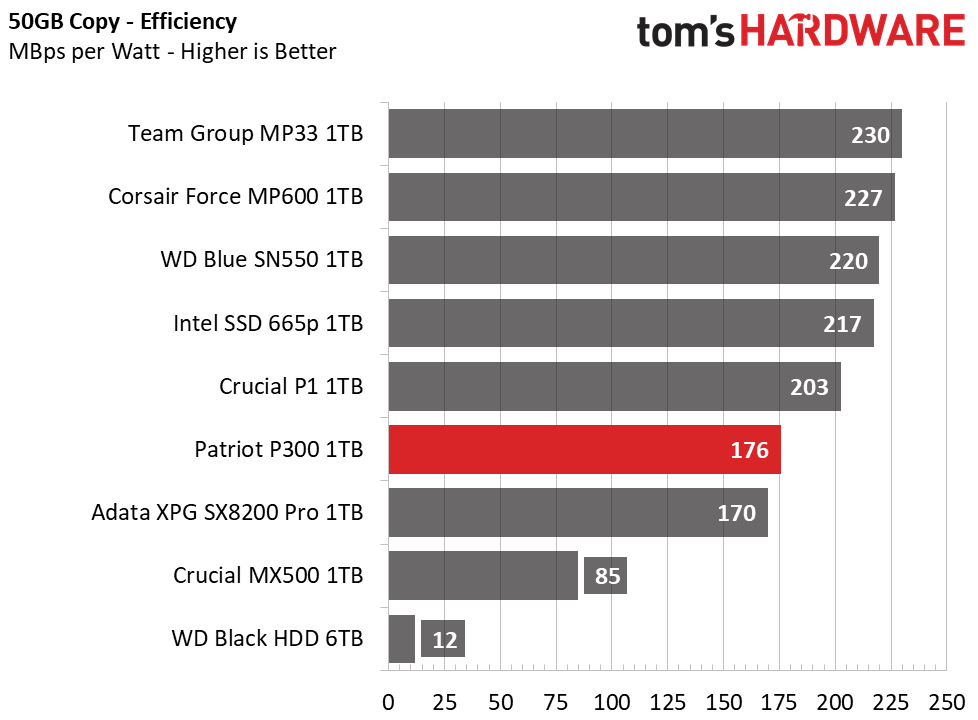
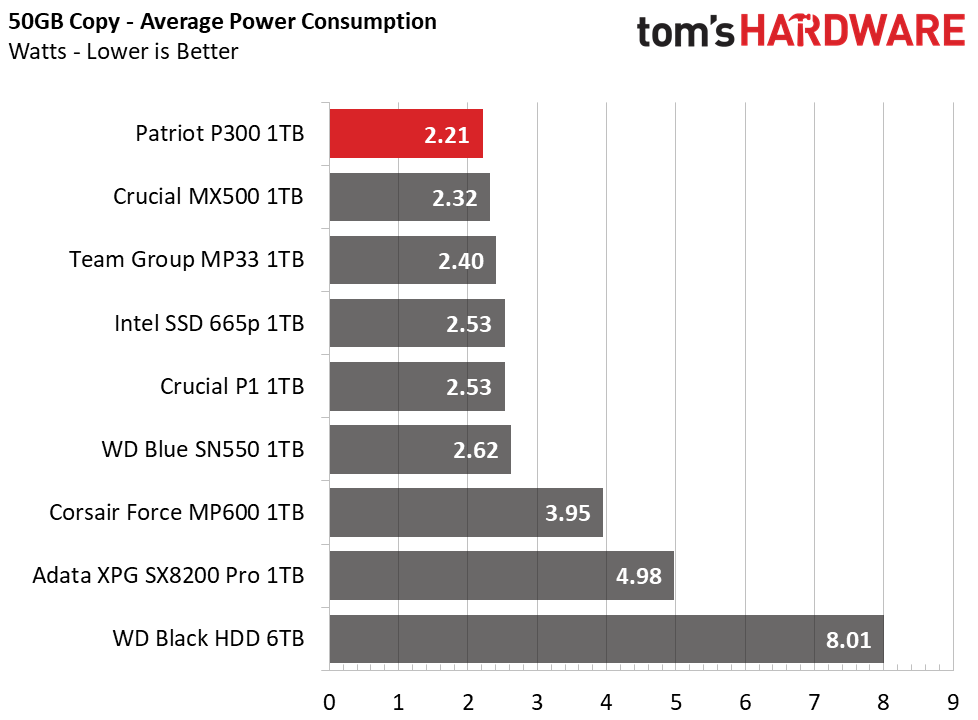
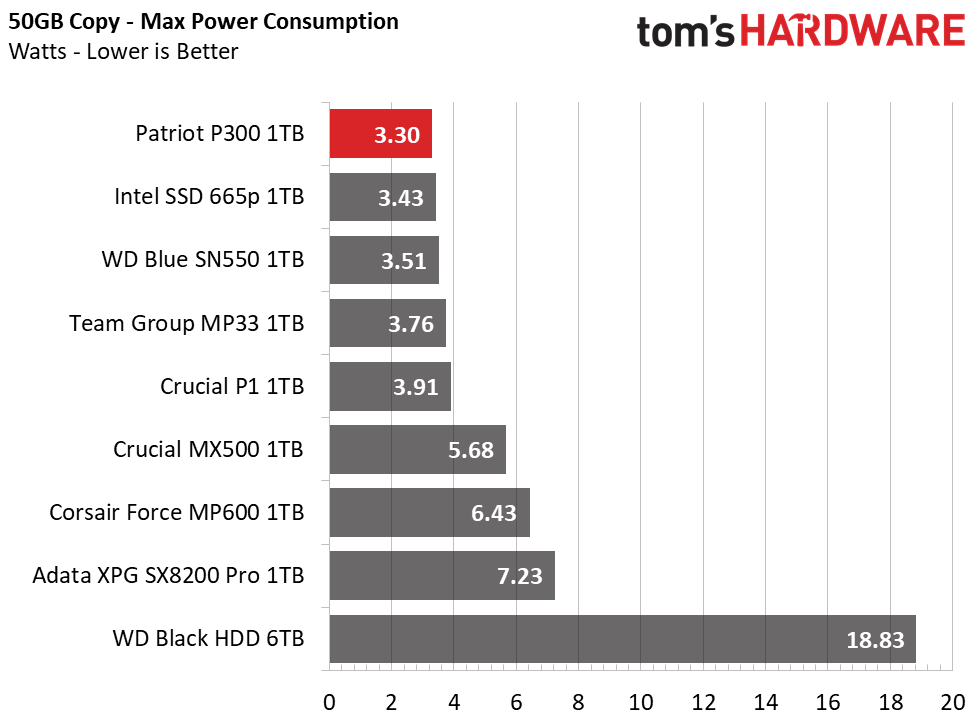
Overall, Patriot’s P300 is fairly efficient, nearly matching the SX8200 in performance per watt. It consumes the least amount of power out of all other SSDs in our test pool, sipping just over 2.2W and peaking at 3.3W under concurrent small and large block sequential reading/writing.
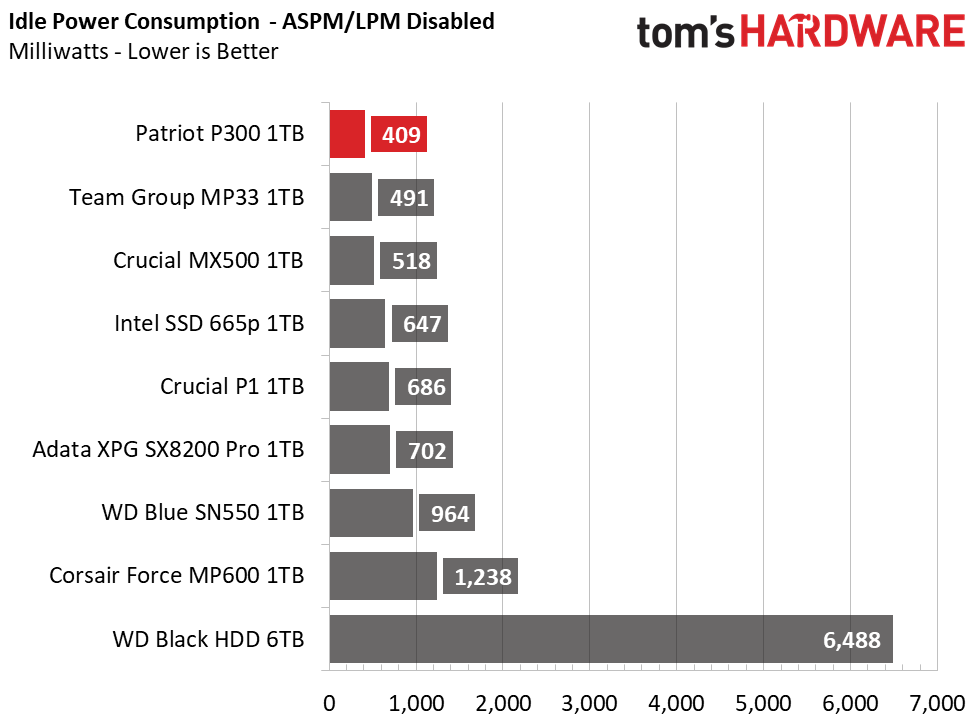
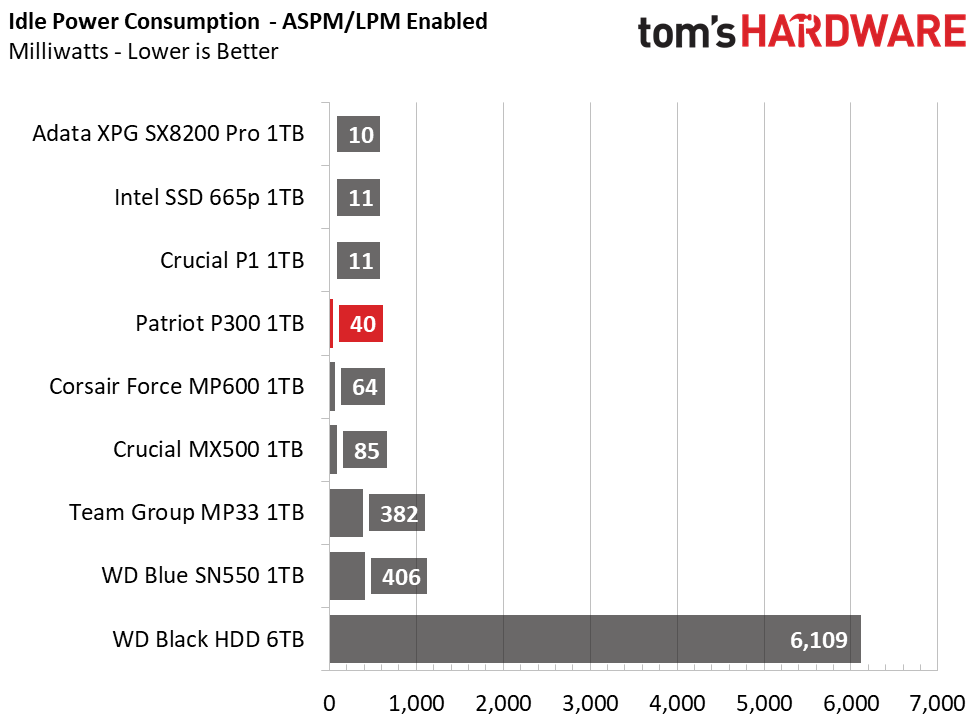
The Patriot drive also supports APST, ASPM, and L1.2 power saving modes. On our desktop testbench, the SSD couldn’t hit its lowest idle state, but fell to a respectable 40mW when ASPM was enabled. When disabled or when active, P300 consumes about 10x the amount, lower than the rest of the pool once again.
MORE: Best SSDs
MORE: How We Test HDDs And SSDs
MORE: All SSD Content

Sean is a Contributing Editor at Tom’s Hardware US, covering storage hardware.
-
2Be_or_Not2Be Yes, indeed, enthusiasts will NOT want this drive. "DRAMless" & "QLC" are definitely items enthusiasts will not want to see in the description of a potential new NVMe M.2 SSD. :)Reply
So it's usually better than a SATA drive, whether that SATA drive is a SSD or HDD. However, even there, I will note that the SATA SSD sometimes beat this drive, and in past tests of doing drive imaging (restore using Macrium Reflect), QLC drives couldn't even go faster than a HDD. (ugh) -
cfbcfb Reply2Be_or_Not2Be said:Yes, indeed, enthusiasts will NOT want this drive. "DRAMless" & "QLC" are definitely items enthusiasts will not want to see in the description of a potential new NVMe M.2 SSD. :)
So it's usually better than a SATA drive, whether that SATA drive is a SSD or HDD. However, even there, I will note that the SATA SSD sometimes beat this drive, and in past tests of doing drive imaging (restore using Macrium Reflect), QLC drives couldn't even go faster than a HDD. (ugh)
Yep, not getting the article at all. Slow, dramless, and I can buy nvme drives with twice the performance for the same price. -
WarthogARJ Hi,Reply
Can you please tell me how you run the Sustained Sequential Test.
I've read various of Tom's Hadware Reviews, and also your sticky saying "How We Test SSDs'" but they don't give enough information for me.
At the least, can you tell me what Queue Depth you test at? All you say is that you test at at a sustained sequential rate, with a 128kB packet, for 15 minutes. But you don't say what QD.
In addition, what sampling frequency do you use?
Some Reviewer sites use time based, at something like 1 datum every 5 seconds, others use 2 datums per second. And one does it data based, at 1 datum per 1 GB.
Your output graphs join your data points with a continuous line, without any indication of data frequency, so I cannot tell from that, unfortunately.
I want to be able to use the test results from a number of Review sites, to see how SSD's perform under various conditions, but to use yours, I need more procedural information.
Thanks for this. -
danbfree1 3 years later, the 256GB version is likely the best sub-$20 PCIe drive on the market. Just picked one up for $18.99 to be a straight OS drive for a media server with 16TB HDD for said media, but also as Win 11's Docs/DL/Music/Photo on a board that only has PCIe Gen2 x2 anyway. The WD Blue SN550 is double the price.Reply -
ramseyrt I just purchased a Patriot P300 512GB M.2 based on its low power consumption. There are many faster M.2 drives available, but I couldn't find anything that used less power. If you're a gamer that plugs your computer into an outlet, power really isn't an issue. However, if you're a person that does a ton of portable work, you want to make your battery last as long as possible. I'm not sure that I could tell the difference between loading Excel and a spreadsheet at 3,000Mb/s vs this drives 1,700Mb/s. I'm not sure I'll notice the difference between an 8w M.2 or a 2w M.2 either. I suppose I'll find out soon.Reply