Samsung 850 Pro SSD Review: 3D Vertical NAND Hits Desktop Storage
After winning an award last year for its 840 EVO, Samsung is ready to follow up with another high-end offering. The company's 850 Pro SSD merges the EVO's familiar MEX controller with 3D V-NAND. Does the combination justify an upgrade, or should you wait?
Results: Latency And Performance Consistency
Normally, I'd just use a garden variety workload generator for testing latency and performance consistency. It's simple enough that you could train a medium-smart kitten to do this stuff. But I like ULINK's platform; it gives me a common foundation for running benchmarks. That's not a big deal for some metrics, but it's more important for others. I have to use several different machines for testing with DriveMaster, due mostly to the length of time these workloads eat up. Two comparable systems deliver identical performance with DM2012.
Latency
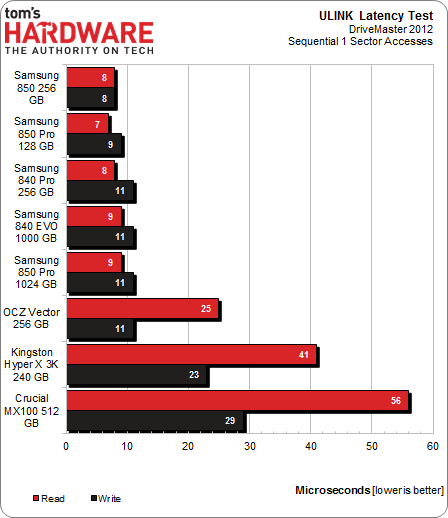
ULINK's Latency test does things in a slightly different way than I've presented in the past. First, the drive is secure erased. Next, it is filled twice sequentially, then once with random writes. Immediately after, the latency test begins.
This script tests sequential one-sector accesses, sequentially testing 512 bytes. Do that 2 million times for reads and two million times more for writes, and presto. You get one result for reads and another for writes in the blink of an eye.
Samsung's hardware looks impressive. Not only do the 850 Pros serve up low latencies, but the 840 EVO and 840 Pro also hold their own. It takes the other contenders much longer to complete reads and writes under the same conditions, ending with Crucial's MX100. We'll do more of this testing on the drives waiting for reviews, but you can already see that going the budget route has negative implications.
Performance Consistency
This is another test I'd typically run differently. I don't even really like the phrase performance consistency. But I do like ULINK's PerfCon test. It offers six test cases: 4 KB read, 4 KB write, and 50% read/50% write in both aligned and unaligned boundaries. I won't bore you with the outcomes of all six test cases. Instead, I'll stick to the 50% read/50% write 4 KB aligned measurement.
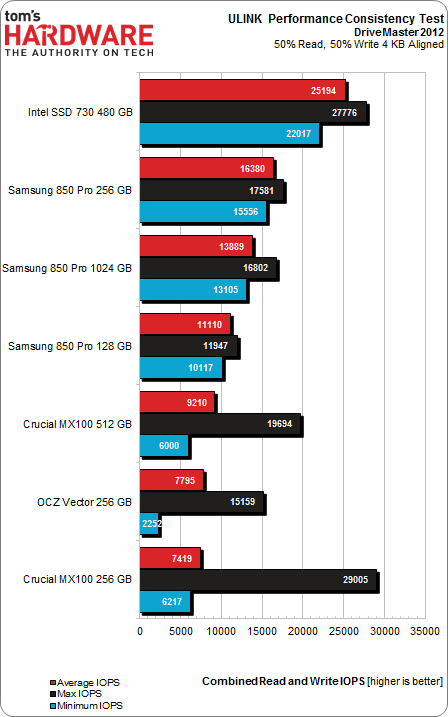
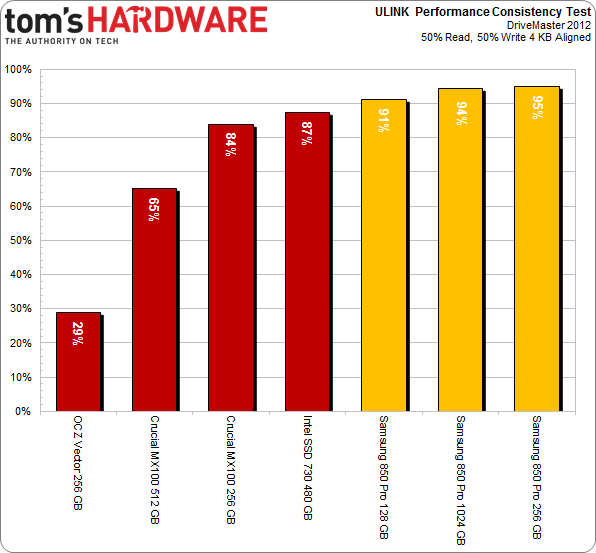
The trick here is that after the same preconditioning used above, 1000 data points are generated one second apart. The 95.5th-percentile slowest result is divided by the average IOPS to yield one performance number reflecting consistency as a percentage. Absolute transactional performance is factored out of that number, so I display average, minimum, and maximum IOPS in a separate chart.
As you can see, the average, maximum, and minimum IOPS results are more even towards the top. In this 4 KB random workload split between reads and writes, steady state 4 KB write performance gets bolstered by reads. But it's more difficult for some drives to maintain when the workload is mixed.
Get Tom's Hardware's best news and in-depth reviews, straight to your inbox.
Sure enough, Intel's SSD 730 ends on top, owing to its high average I/O performance. The Samsungs filter in behind. There's almost 2.5x as much difference between the slowest and fastest averages. But how do the percentages play out?
The Vector exhibits some strange results, but 65% isn't bad for the MX100. Intel's SSD 730 attains an impressive 87%, and the 850 Pro contingent (led by the 256 GB capacity point) score a win. Each is above 91%, which is just great. Even without additional over-provisioning, the 850 Pros dominate in our look at consistency.
Current page: Results: Latency And Performance Consistency
Prev Page Results: Power Testing Next Page SATA Is Maxed, But The 850 Pro Still Pushes Faster-
MoulaZX I 'just' ordered 2x Samsung EVO 120GB a few hours ago, then I stumbled onto this article. Damn it! Damn it! Damn it! Every freaking time I run into this, be it Storage, CPU, or GPU.... -_-Reply -
cryan ReplyI 'just' ordered 2x Samsung EVO 120GB a few hours ago, then I stumbled onto this article. Damn it! Damn it! Damn it! Every freaking time I run into this, be it Storage, CPU, or GPU.... -_-
I don't know if this really changes anything for you. Two EVOs are still going to be better than one 850 Pro in every way. But I understand the sentiment!
Christopher Ryan
-
lp231 Reply
You just ordered a few hours ago. Just cancel your order if you really want this 850 Pro.13621005 said:I 'just' ordered 2x Samsung EVO 120GB a few hours ago, then I stumbled onto this article. Damn it! Damn it! Damn it! Every freaking time I run into this, be it Storage, CPU, or GPU.... -_- -
g-unit1111 Reply13621197 said:10yrs warranty, may be finally I have a reason to buy SSD. lol
I can guarantee that in 10 years you won't own that drive anymore. :lol: -
10tacle I still have several 8-10 year old drives laying around between 80GB-150GB. I mostly use them as external drives for backing up USB thumb drives and other files that aren't large volume.Reply -
razor512 Will overclocking the bus that the sata controller is on impact the performance?Reply
Can you test on an AMD platform which makes it easier to over clock that bus and some of the connected components? -
BestJinjo Looking forward to future generations of 3D Vertical Nand on M.2 / M.2 Ultra interface. Too bad SATA 3 is all maxed out and the next generation standards are not yet mainstream for the masses which is holding back SSD performance. As far as this drive goes, it's only slightly faster than MX100 but costs double. I don't think it's worth it. MX100 512GB sounds like a perfect stop-gap until M.2/SATAe drives arrive with 1-1.5TB/sec throughput. Perhaps Samsung will give us 95% of the performance for a fraction of the price in the 850 EVO.Reply -
MoulaZX ReplyI 'just' ordered 2x Samsung EVO 120GB a few hours ago, then I stumbled onto this article. Damn it! Damn it! Damn it! Every freaking time I run into this, be it Storage, CPU, or GPU.... -_-
I don't know if this really changes anything for you. Two EVOs are still going to be better than one 850 Pro in every way. But I understand the sentiment!
Christopher Ryan
Not quite. One is for my Desktop, the other is for my Father's Desktop.
For my Desktop, I'll be stepping up from 2x OCZ Vertex 2 60GB in RAID 0. Hope it'll be worth it...


