Why you can trust Tom's Hardware
We used CPUz logging to measure the card’s power consumption with the Metro:Exodus benchmark running at 2560 x 1440 using the default Ultra settings. We warmed up the graphics cards prior to testing and started when they settle to an idle temperature (about 10 minutes). The benchmark is looped a total of five times which yields around 10 minutes of testing. In the charts you will see a few blips in power use, this is a result of the benchmark starting the next loop.
We also use Furmark to capture worst case power readings. Although both Nvidia and AMD consider the application to be a “power virus” or program that deliberately taxes the components beyond normal limits, the data we can gather from it offers useful information about a card’s capabilities.
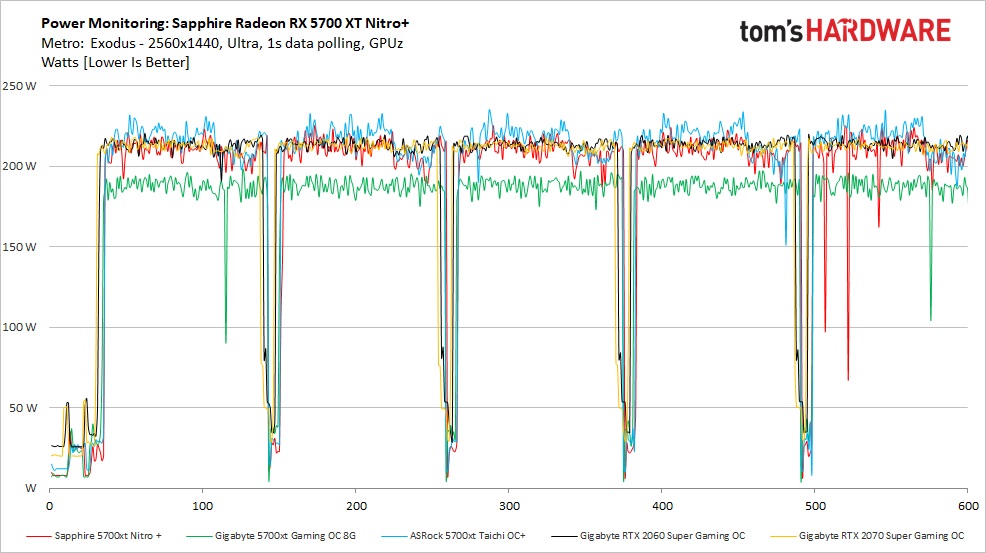
Starting off with the gaming power results, our Nitro+ averaged 208W during the Metro: Exodus test. Our other 5700 XT in the lineup averaged 186W. This minor difference makes sense due to the difference in clock speeds.
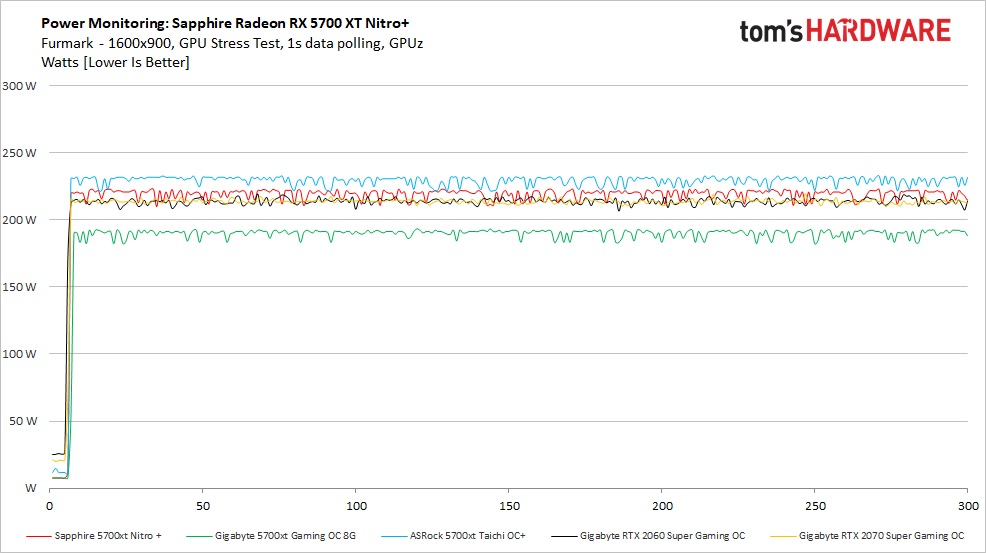
Furmark’s power consumption doesn’t end up much higher than the gaming result due to the power management, but it still tells a story. Here the Nitro+ averaged 219W, up 11W from the Metro Exodus value while the Gigabyte 5700 XT showed a very small difference of 3W to 189W. AMD’s drivers kept the cards power in check here by lowering clock speeds and voltages as we will see on the next page.
In order to see how each video card behaves, like the power testing, we use GPUz logging in one second intervals to capture the data. Game testing is done looping Metro: Exodus benchmark five times at Ultra settings running at 2560x1440 resolution.
We also used Furmark to capture some of the data below which offers a more consistent load and uses slightly more power, regardless if the clock speeds and voltages are limited. These data sets give an insight into worst case situations along with a load other than gaming.
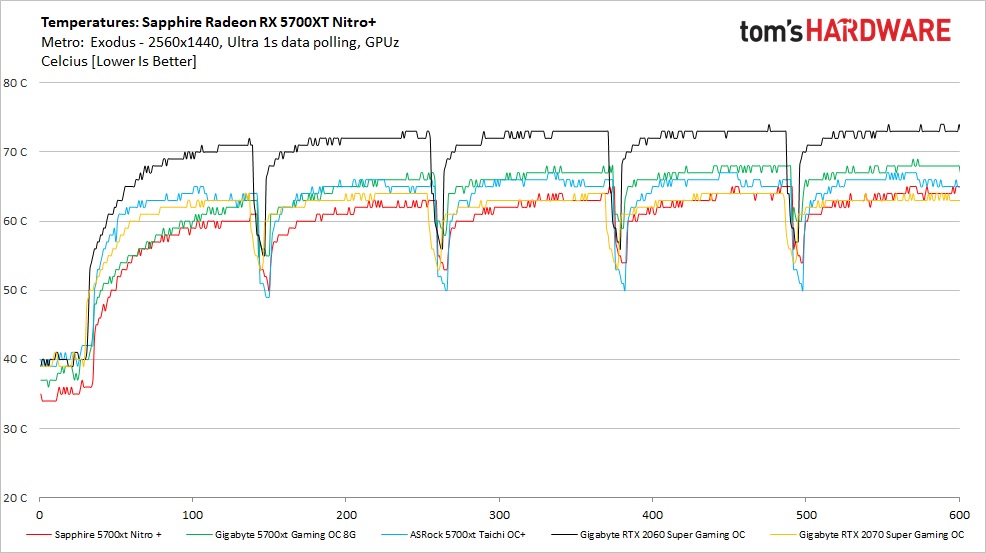
The Sapphire 5700 XT Nitro+ (in red) peaked at 65C during our testing run which happened to be the lowest of the group. The Gigabyte OC Gaming using Windforce 3 cooling peaked at 68C.
Get Tom's Hardware's best news and in-depth reviews, straight to your inbox.
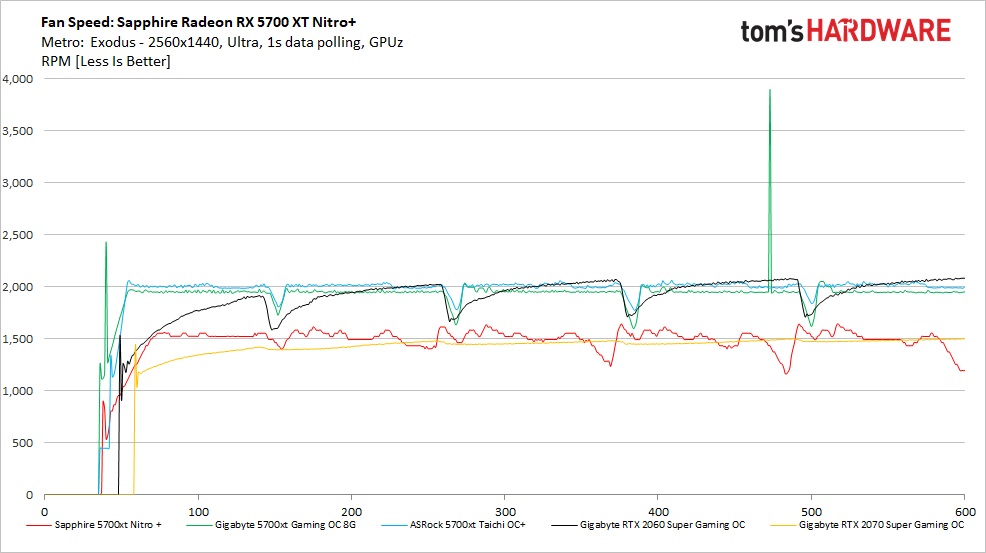
The Nitro+’s three large fans spin up around 800 RPM and rise swiftly to a bit over 1,500 RPM throughout most of the testing. The dips seen are from when the benchmark loops and starts again. We can see for the most part speeds range between 1,500 and 1,600 RPM which maintains the temperature reached. The Tri-X fan setup spun slower than the other Gigabyte 5700 XT Gaming OC card due to the larger fans. That cooling solutions runs running around 2,000 RPM.
The fans are not loud, but you could hear them sitting on an open test bench. The larger fans are able to move more air at a slower RPM than the smaller fans on the other cards and at the speeds we saw here, didn’t emit anything but wind noise for the most part.
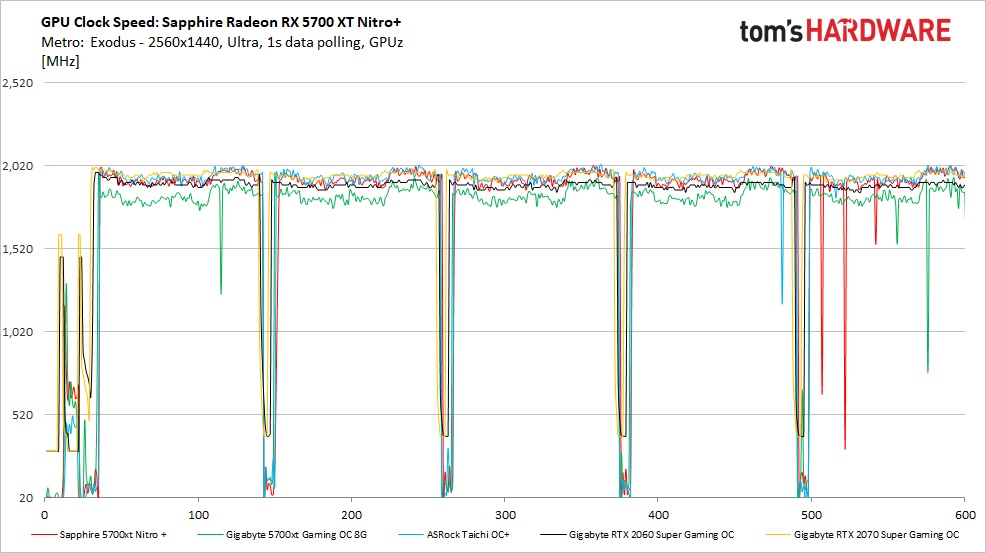
As far as clock rate behavior, we see in our testing the clocks bounced around a bit as did all the others. The average clock speed this card achieved was 1911 MHz over the course of the test (the lower clocks between runs was taken out to find the average). This result sits just above AMD’s game clock (1905 MHz) and well below the rated boost clock as is typical. Everything is working as it should during the game testing. The Nitro+ runs faster than the Gigabyte 5700 XT (1,826 Mhz average) and in general has improved frame rates to show for it.
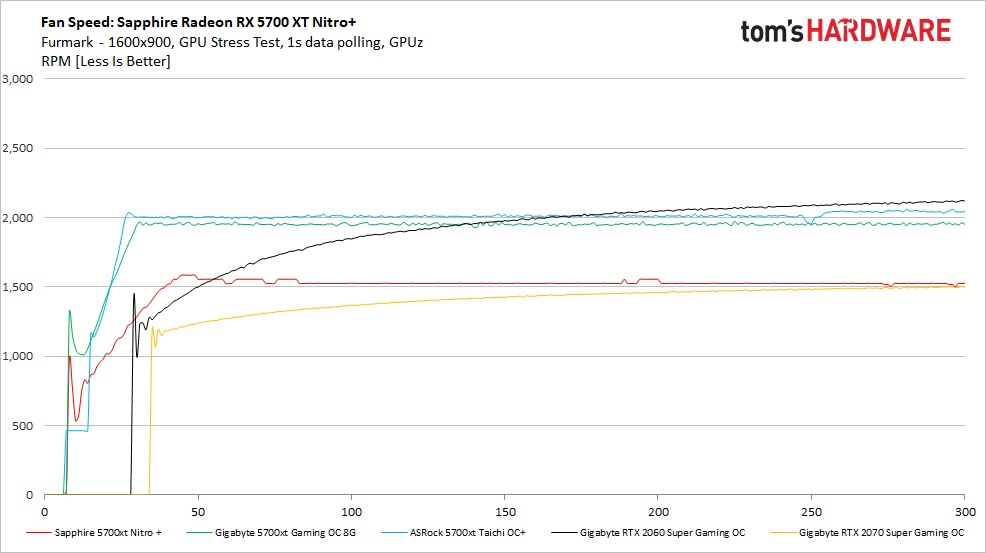
Taking a look at the fan speeds while running Furmark, we see much of the same as compared to gaming except that the loads and ramps are more stable due to the slightly heavier and more consistent loads it provides. Since temperatures really did not increase much due to the throttling of the cards, fan speeds were also similar. The Nitro+ stayed that 1,500 to 1,600 RPM range throughout testing while the other Radeon 5700 XT card continued to run at 2,000 RPM.
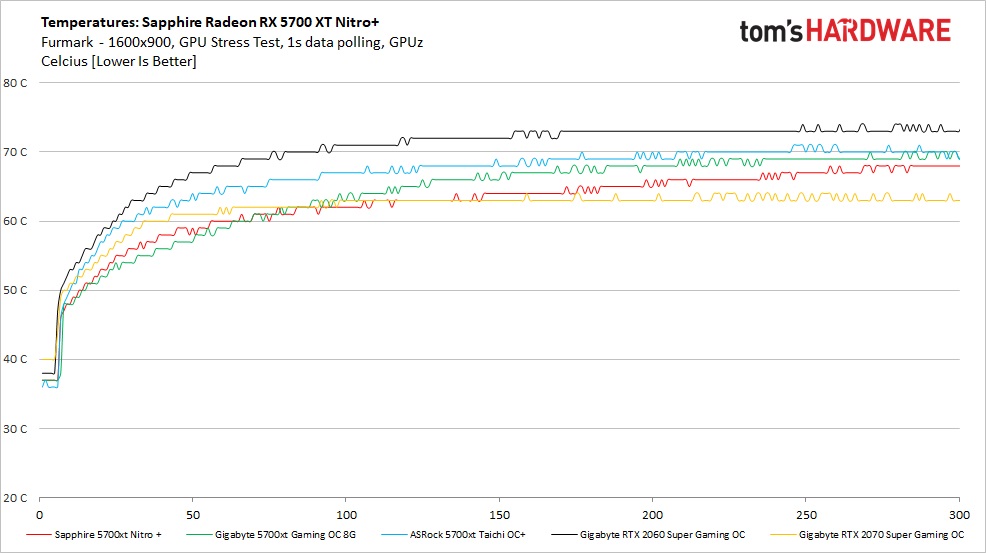
We hinted at the temperatures above not being much different and in the chart we now have a visual. Using Furmark, the temperatures ramped up a bit more slowly compared to the game due to all the throttling and management the cards need to run it. Temperatures peaked here at 69C on the Nitro+ while both the Gigabyte and ASRock ran just a couple of degrees Celsius warmer.
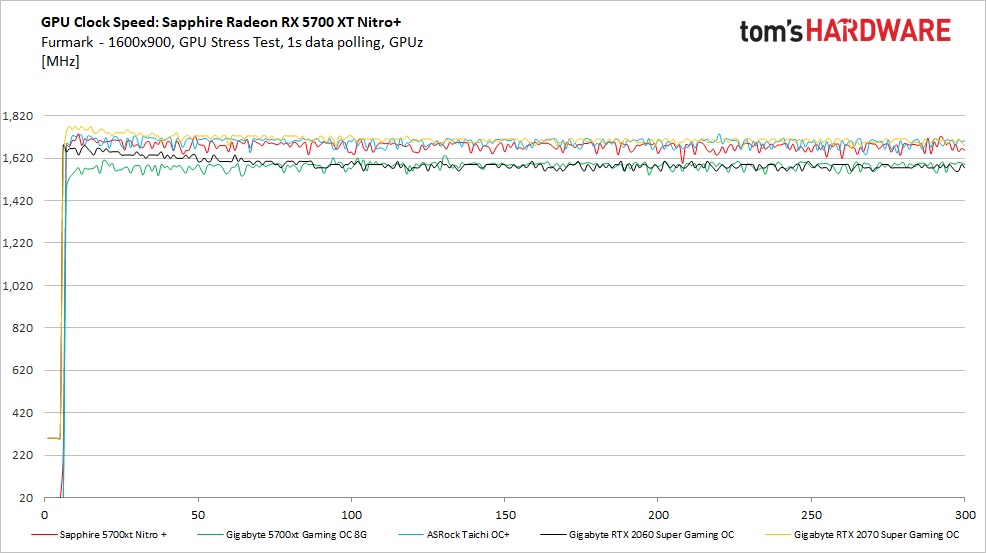
One of the biggest differences we see in Gaming and Furmark testing is that, when running the latter, the clock rate is notably lower across all tested cards. As was mentioned previously, both AMD and Nvidia consider Furmark to be a power virus and this have protection built in to protect the hardware under such loads. In this case the Nitro+'s average clock rate was 1,678 MHz, a far cry from the 1,911 MHz when gaming. The Gigabyte 5700 XT card managed to run 1,582 MHz also notably lower than a typical gaming load.
MORE: Best Graphics Cards
MORE: Desktop GPU Performance Hierarchy Table
MORE: All Graphics Content
Current page: Power Consumption, Fan Speeds, Clock Rates and Temperature
Prev Page Performance Results: 3840 x 2160 Next Page Software: Sapphire Trixx
Joe Shields is a staff writer at Tom’s Hardware. He reviews motherboards and PC components.
-
HideOut They specs chart shows the same memory bandwidth as the stocker but with the factory OC it should be higher, much like the TFlops calculation. Sounds like a nice card, but paying a huge premium for what, 3-5% more speed? Doesn't sound like a great buy though.Reply -
King_V Well, you're paying for more than just the extra speed - also for a very well engineered, quiet cooling solution, as well as better regulation, etc.Reply
Though, I do have to agree - I like quiet, and will pay extra for it, but I'm not sure I'd pay that much of premium for it. I might, but then it was mentioned that the Power Color variant has a good cooler and a bit lower of a price.
A nice card, but, not sure it justifies the premium. -
Loadedaxe Once you pass this price point there is no need to go AMD. Might as well get a 2070Reply
I have been waiting for the custom aibs for the 5700, and minus the PC Red Devil, I am completely disappointed. However, I wont buy a Power Color, I have been burnt by them twice.
Lets see what the MSI Gaming X looks like when it lands price wise. I may just jump ship this round. -
King_V ReplyLoadedaxe said:Once you pass this price point there is no need to go AMD. Might as well get a 2070
The 2070 non-super generally performs less than the 5700XT, so why, if the prices were about the same, would anyone choose the lesser performing card? -
waltc3 My Built-by-AMD 50th Ann 5700XT sports significantly higher boost clocks, and costs $20 less....I have zero problems with it.Reply -
Loadedaxe Reply
I was referring to the super. Its $40 more.King_V said:The 2070 non-super generally performs less than the 5700XT, so why, if the prices were about the same, would anyone choose the lesser performing card? -
King_V Gotcha. Not sure I'd go to the 2070 Super over the Sapphire, not enough performance gain to justify the $499 price of entry.Reply
Then again, I'm thinking the premium for the Nitro+ is also probably more than I'd be willing to pay for it. I'm 2 for 2 on PowerColor success, though, so that brand wouldn't make me hesitant.
Come to think of it, I haven't ever having a new video card I've bought fail on me. Used ones, either, with only 3 exceptions - two dead when I got them (both Nvidia), and one that worked, but had slightly blurry output (back when CRTs and VGA output was still fairly common), also Nvidia. Still, given the number of used cards I'd come across, and the "who knows what the heck the previous owner did" state of the ones that did fail, I'm confident in all video cards in general. -
Regulus Star* In the last few days we have now started to see prices fall at a few retailers with the lowest price I've seen being £429.99 these new lower prices should start to tip the scales even more when comparing against alternative brands & architecture. And not to mention the price to performance ratio.Reply -
Big Nish I purchased this card to replace my reference 5700XT and, while it is a good card in many respects, it suffers from the same technical flaw as my original Sapphire RX480 Nitro+. The heat sink is simply not large enough to passively maintain a fixed low GPU temp under desktop conditions, which makes the fans come on periodically. Under desktop conditions the GPU temps steadily climbs up to 59degC and then the fans come on until the temp drops down to 49degC at which point the fans stop. Then the cycle constantly repeats: the GPU temp steadily climbs back up to 59degC and the fans come back on and then off once it reaches 49degC again. As mentioned this is just using desktop applications such as Word/Outlook or browsing etc which, according to Sapphire's claim, should see no fans coming on. The time it takes between fan off to fan on is approx. every 3.5 minutes. This fan on/off cycling is really annoying - its actually more annoying than the constant low level fan noise of eh reference card - and makes Sapphire's the 'fan stop at idle' claim misleading. Please note that I am currently using the card's quiet BIOS and have an HP 1440p monitor with a fixed 75Hz refresh rate. I have also tried lowering my monitor to a 60Hz refresh, but the card exhibits the same fan on/off cycling. GRRRR. My Sapphire VEGA 64 Nitro+ was able to stay cool enough under all desktop conditions that the fans never came on. I think Sapphire should have used the exact same heat sink for the RX 5700 XT. Unfortunately, this fan cycling in the desktop has spoilt my enjoyment of this card quite a bit.Reply