Tigo G5 NVMe SSD: Underclocking The SM2260
Why you can trust Tom's Hardware
512GB NVMe SSD Performance
Comparison Products
Our 512GB-class NVMe SSD charts have filled out over the last couple of months, so we had to remove some drives to make room for new products. Many of the older models that are still competitive and unique remain, like the Intel SSD 750 Series 400GB.
NVMe SSDs were exclusively high-performance products when they first came to market, so they demanded premium prices. NVMe SSDs moved away from one class of products in late 2016. The first two entry-level NVMe SSDs, the Intel 600p and MyDigitalSSD BPX, came to market in late 2016. High-end products moved down a tier to fill out the mainstream NVMe marketplace, like the Patriot Hellfire M.2 and Plextor M8Pe series. The Samsung 960 EVO joined the mainstream group, as did the older Samsung 950 Pro.
We don't know a lot about the Tigo G5 at this time, and the company doesn't list random read or random write performance. We are the first outlet to receive the drive for this worldwide exclusive.
Sequential Read Performance
To read about our storage tests in-depth, please check out How We Test HDDs And SSDs. We cover four-corner testing on page six of our How We Test guide.
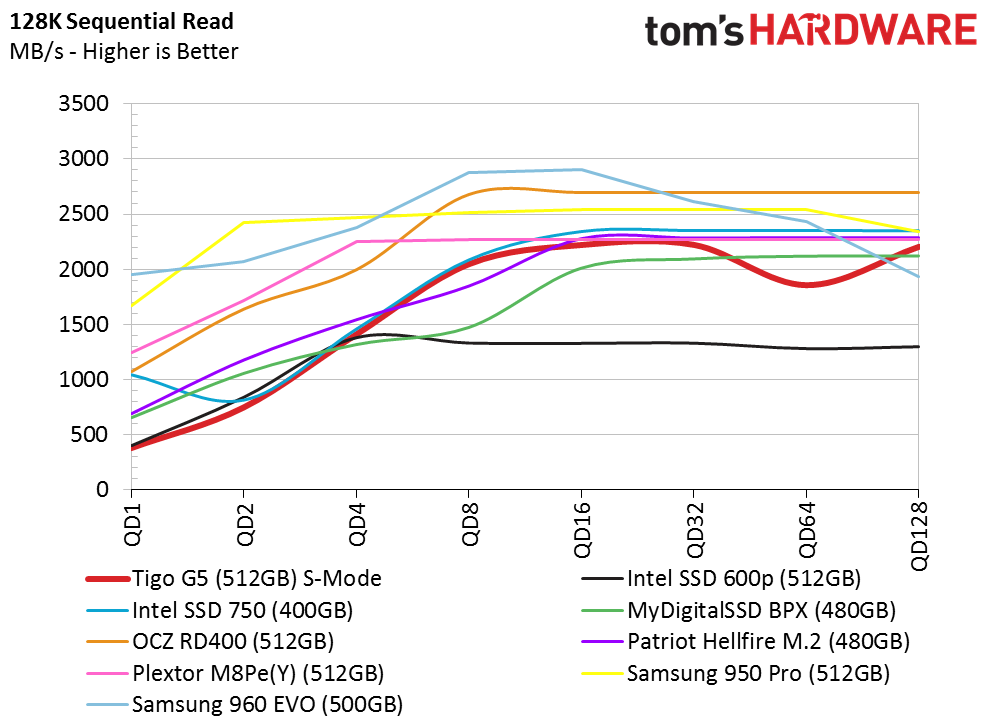
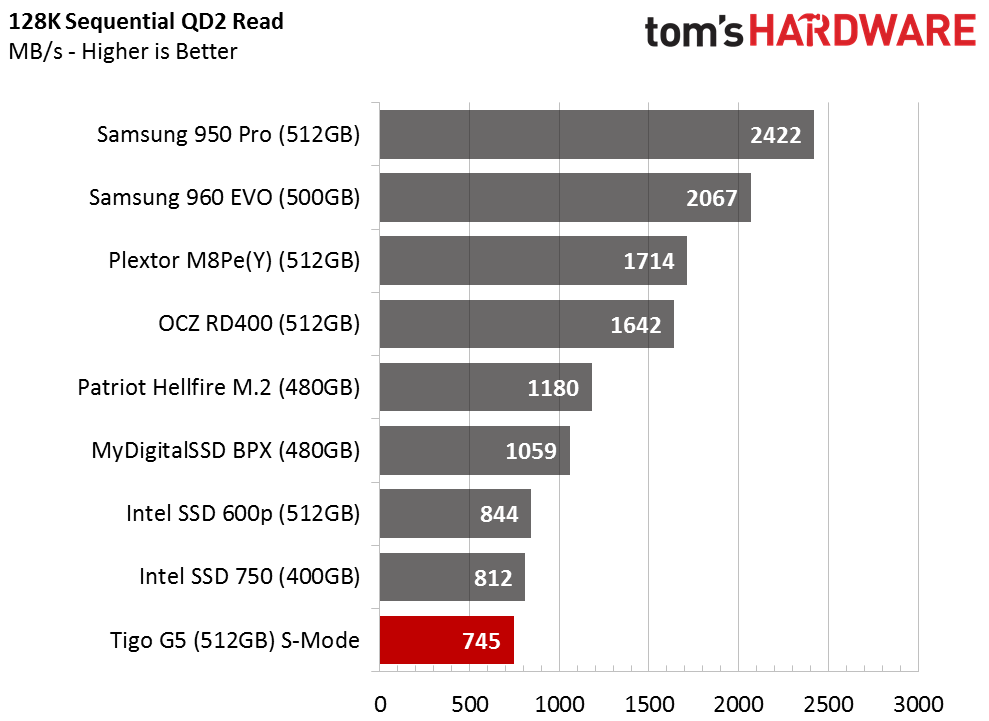
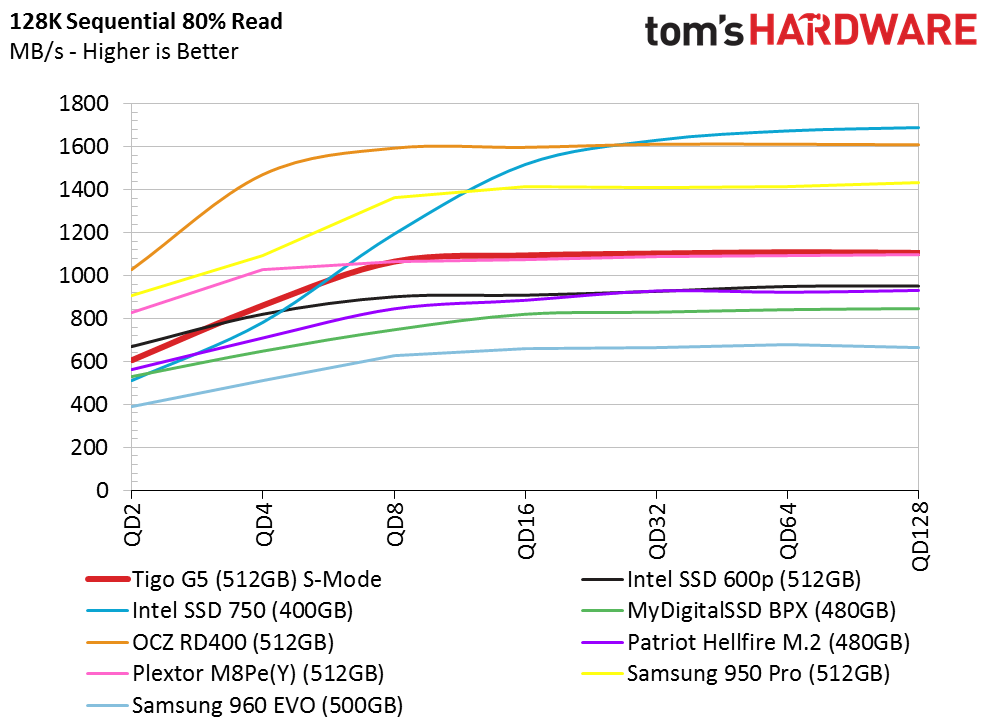
At low queue depths, the Tigo G5 follows the Intel 600p through the chart. The G5 starts to overshadow the 384Gbit TLC-based 600p as we pass QD8. Both SM2260 drives trail many of the others at low queue depths, and that may play a role in why we haven't seen the SM2260 paired with 3D MLC until now.
Sequential Write Performance
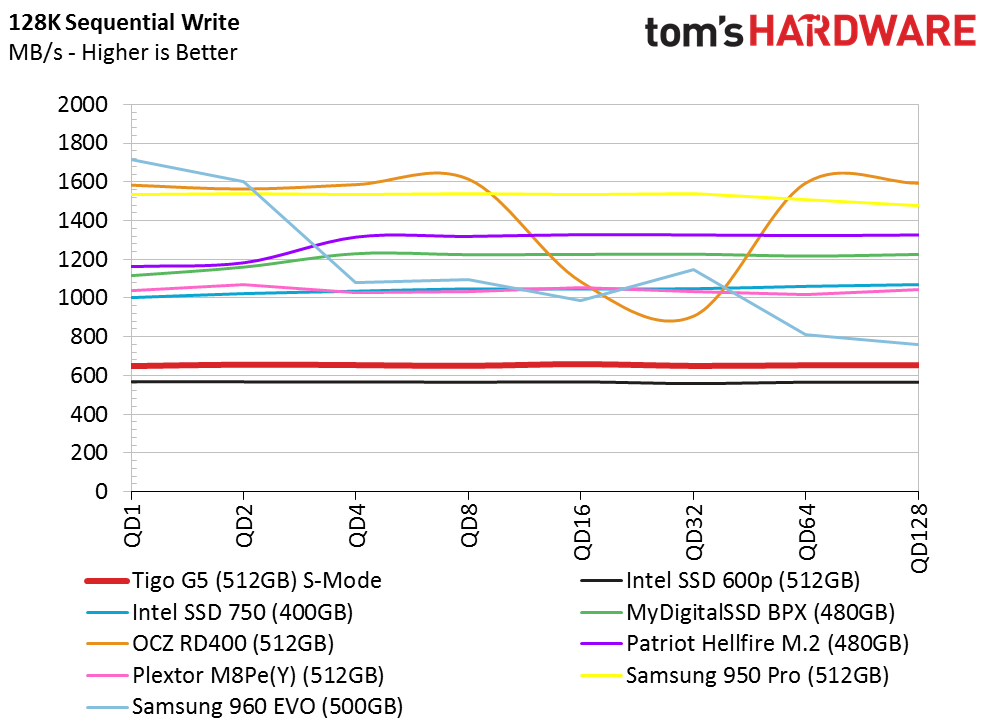
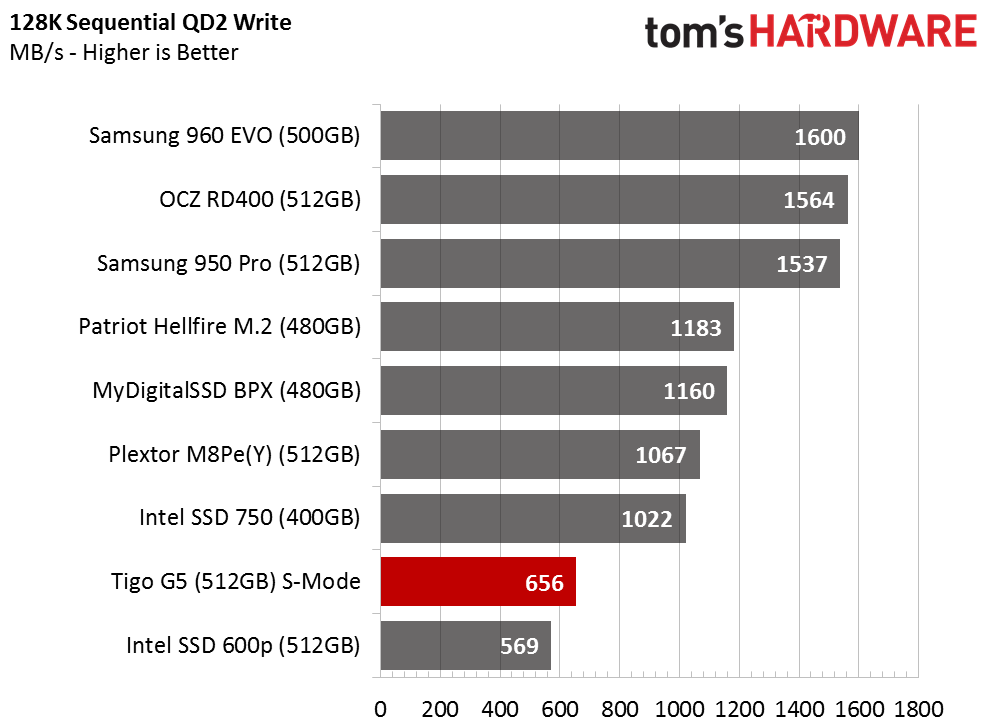
The Tigo G5 delivers nearly 100 MB/s more sequential write performance than the 600p across the queue depth range. This isn't a peak large-block performance test, so we didn't hit the 1,100 MB/s maximum claimed performance.
Sustained Sequential Write
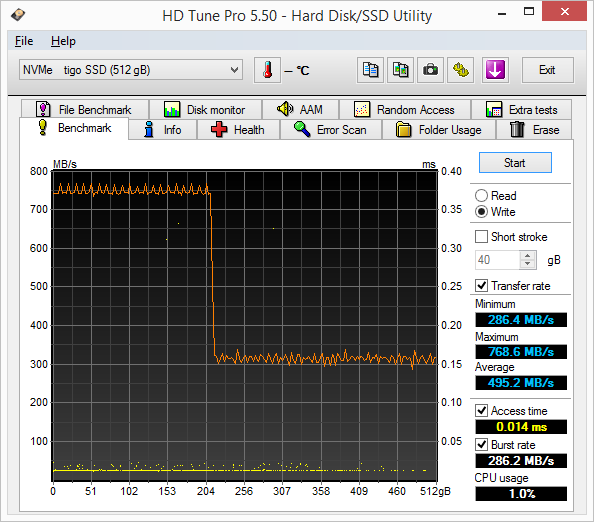
The Tigo G5 appears to use an SLC buffer to increase its write performance. The buffer doesn't just absorb random 4KB data; it also soaks up 128KB blocks. The larger the block size, the less buffer write time is available. This test also reveals a troubling trend; there are three significant outliers during the latency portion of the test.
Get Tom's Hardware's best news and in-depth reviews, straight to your inbox.
Random Read Performance
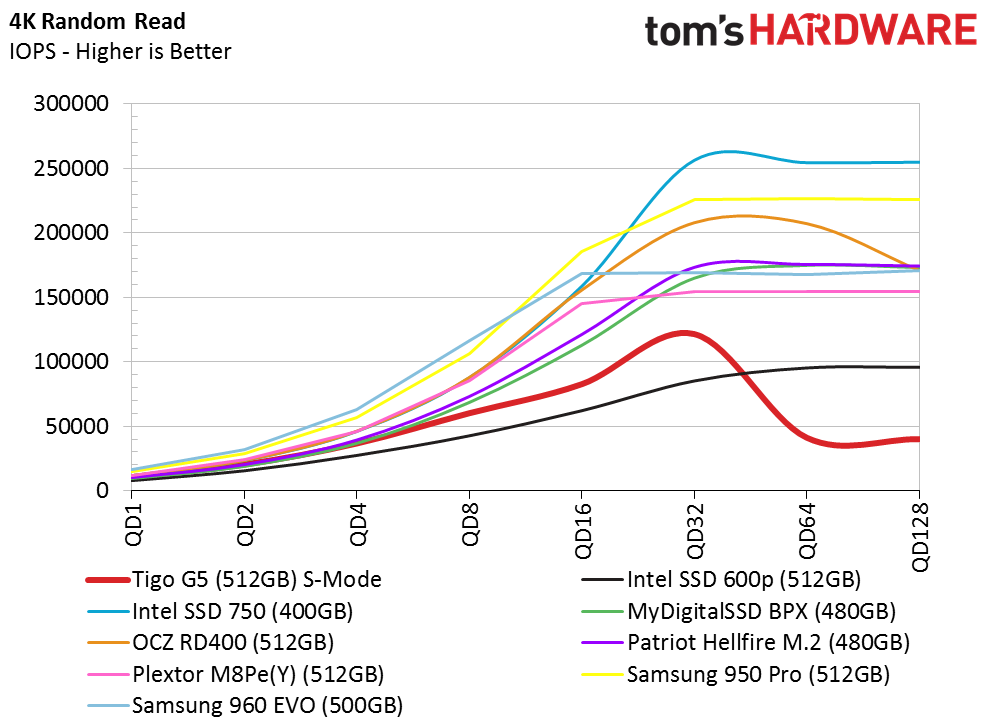
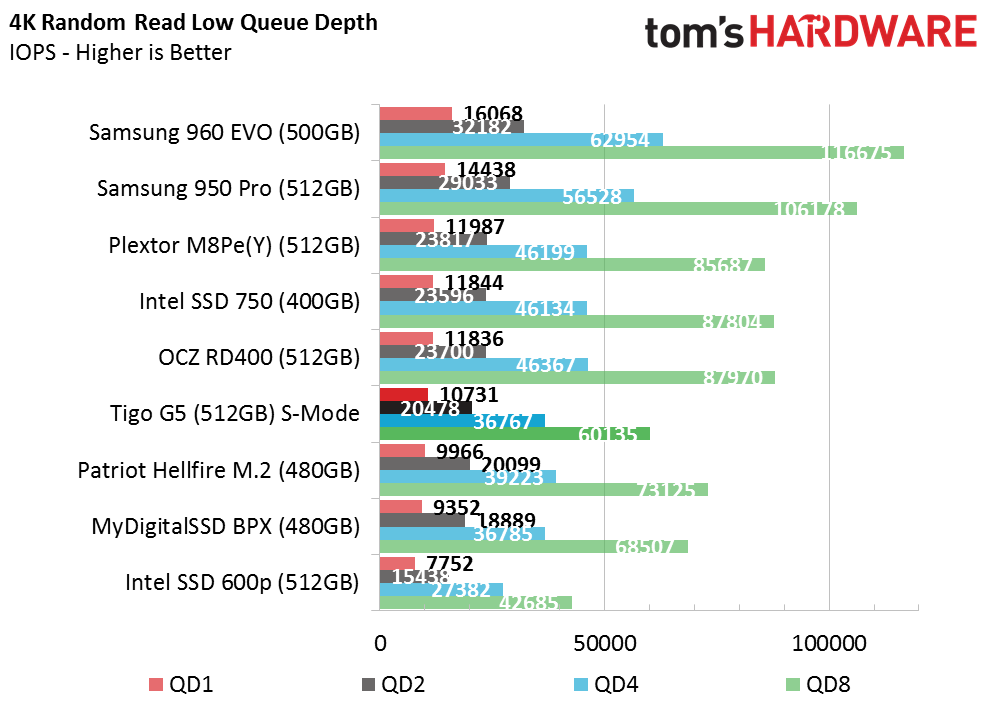
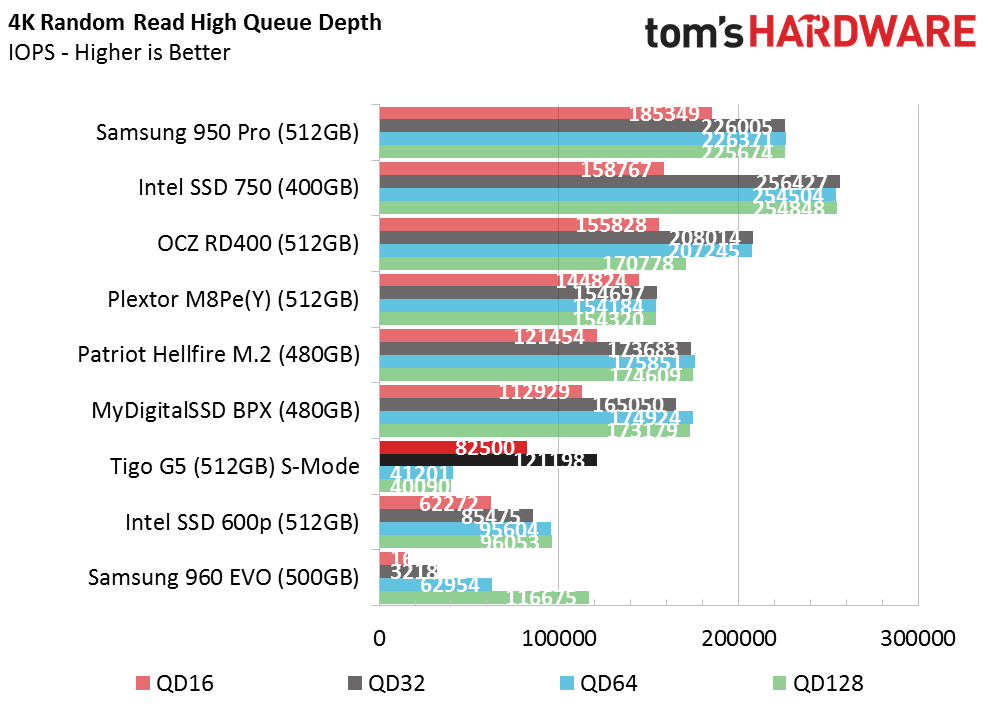
The Tigo G5 delivers more random read performance up to QD32 than the Intel 600p. The G5 surpasses 10,000 read IOPS at QD1, which is roughly a 20% increase over the TLC-based Intel. At low queue depths, the G5 competes well against the other modern low-cost NVMe products, like those with the Phison PS5007-E7, but it falls well short of the premium Intel, Samsung, and Plextor NVMe SSDs.
Random Write Performance
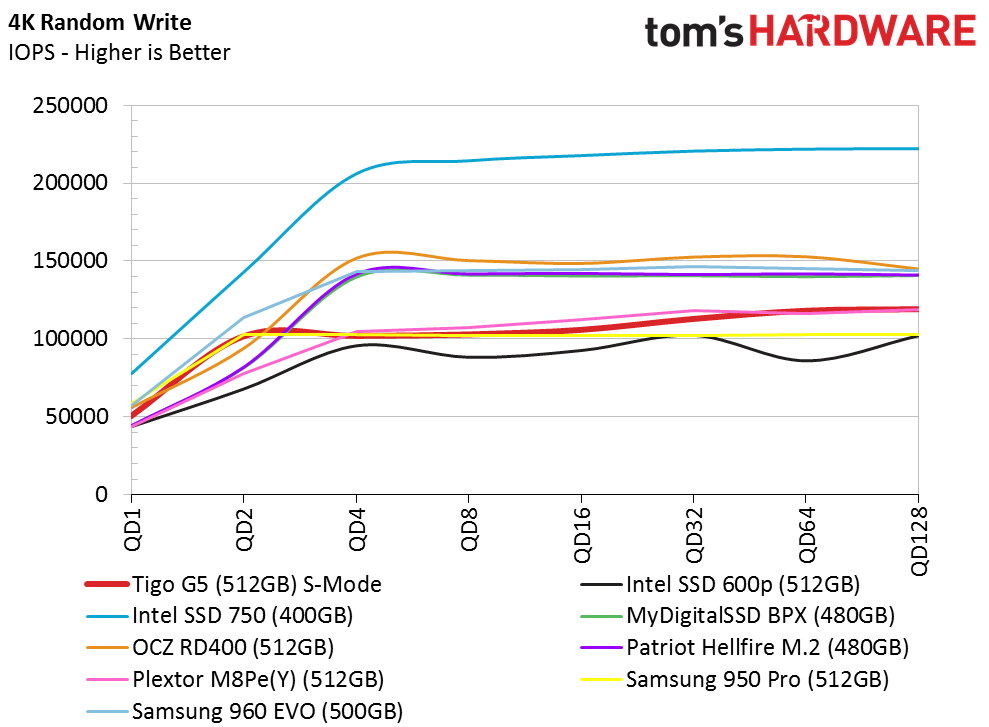
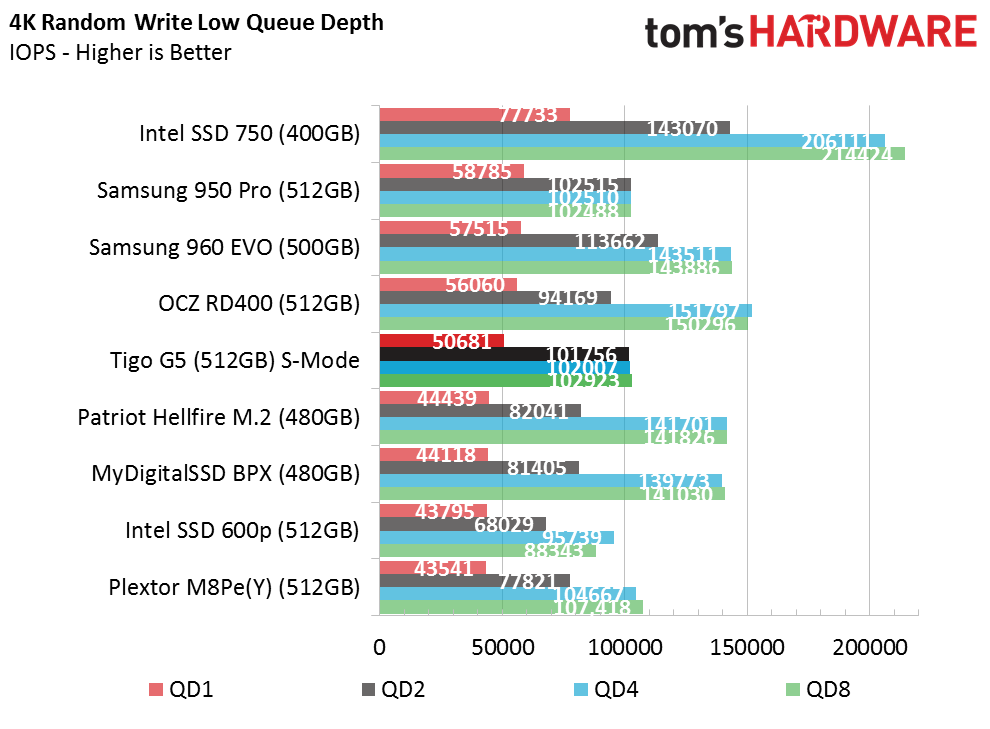
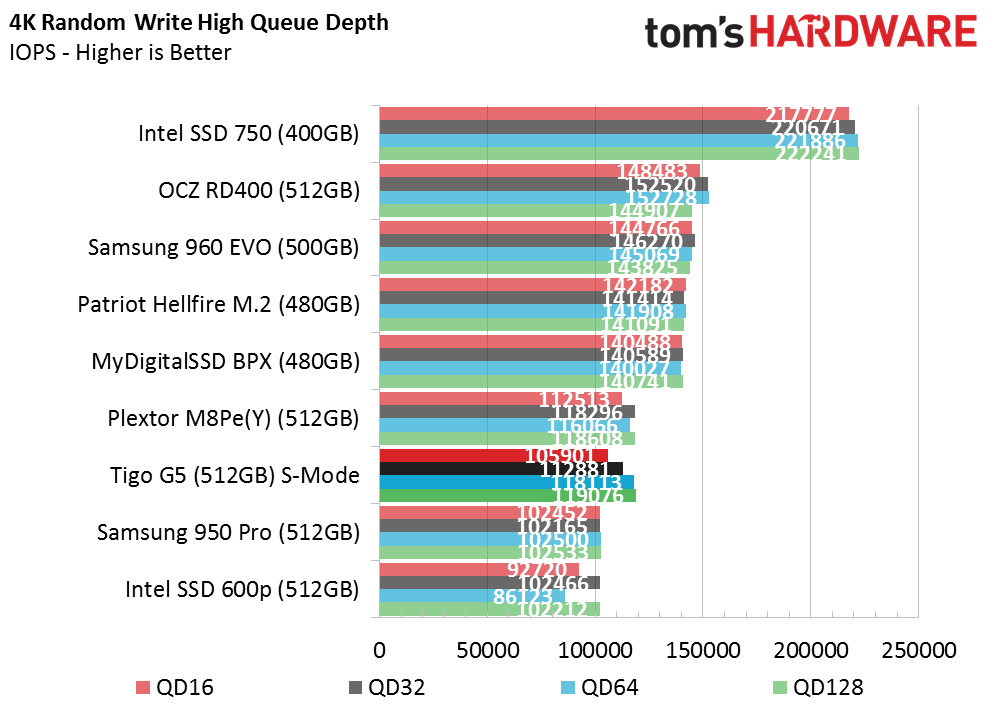
Many of the NVMe SSDs deliver between 50,000 and 60,000 random write IOPS at QD1. The enterprise-derived SSD 750 Series is the only model that offers higher performance. The G5 performs in line with the second performance tier up to QD4, but the performance starts to level off after QD2 at 100,000 IOPS. For perspective, most SATA-based SSDs need QD16 or QD32 to reach 100,000 IOPS, which is well above what a majority of users generate in a typical environment.
80 Percent Sequential Mixed Workload
We describe our mixed workload testing in detail here and describe our steady state tests here.
Companies began tuning mixed workload performance after we started testing it four years ago. This workload is often overlooked, but during typical use, it is more important than the traditional four-corner tests. This is where the Tigo G5 armed with the SM2260 strikes back. SMI didn't tune the firmware for benchmark performance, that's fairly obvious, but instead it targeted the mixed workloads that are closer to real-world use.
80 Percent Random Mixed Workload
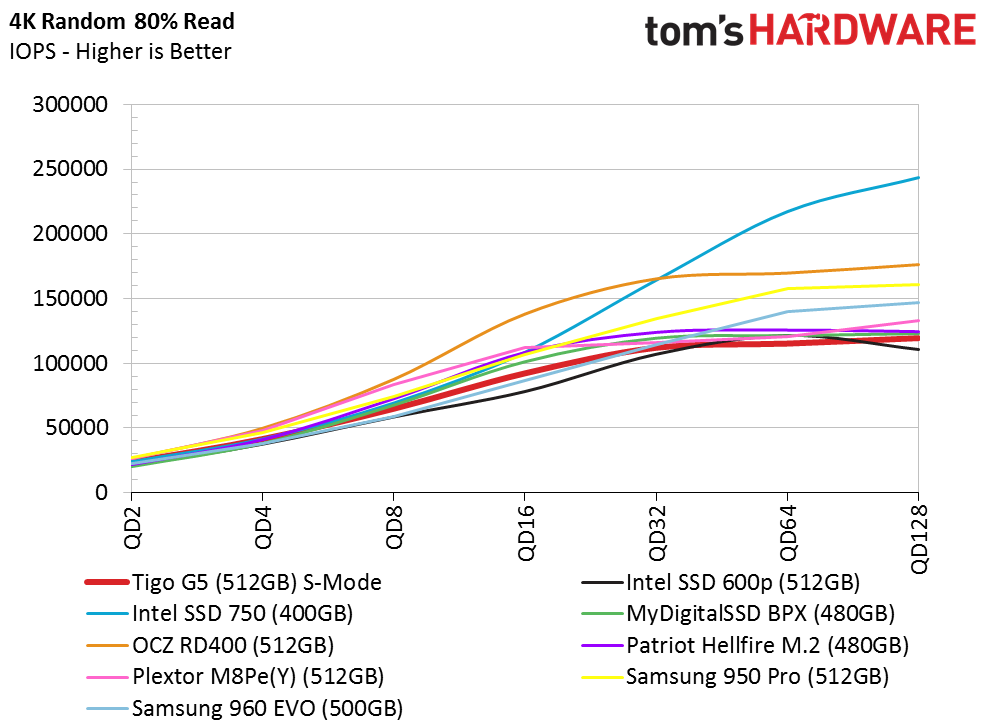
Even with its mixed workload focus, the Tigo G5 is just an average NVMe SSD. At this point, we just have to accept that, regardless of how amazing the Tigo G5 looks, it's still an average NVMe SSD in the performance category.
Sequential Steady-State
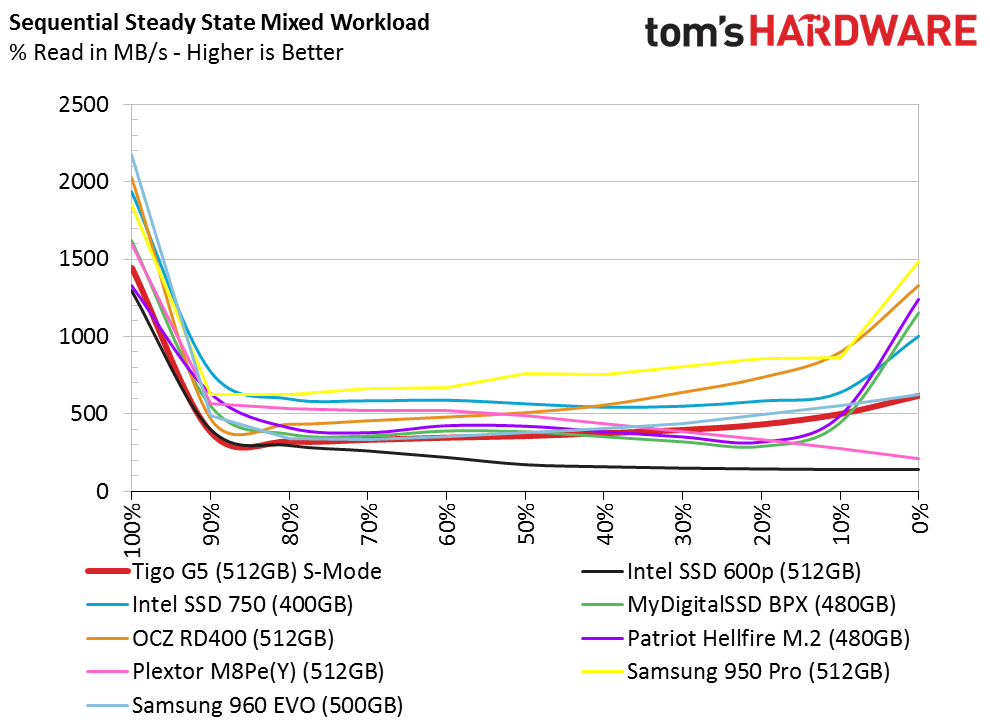
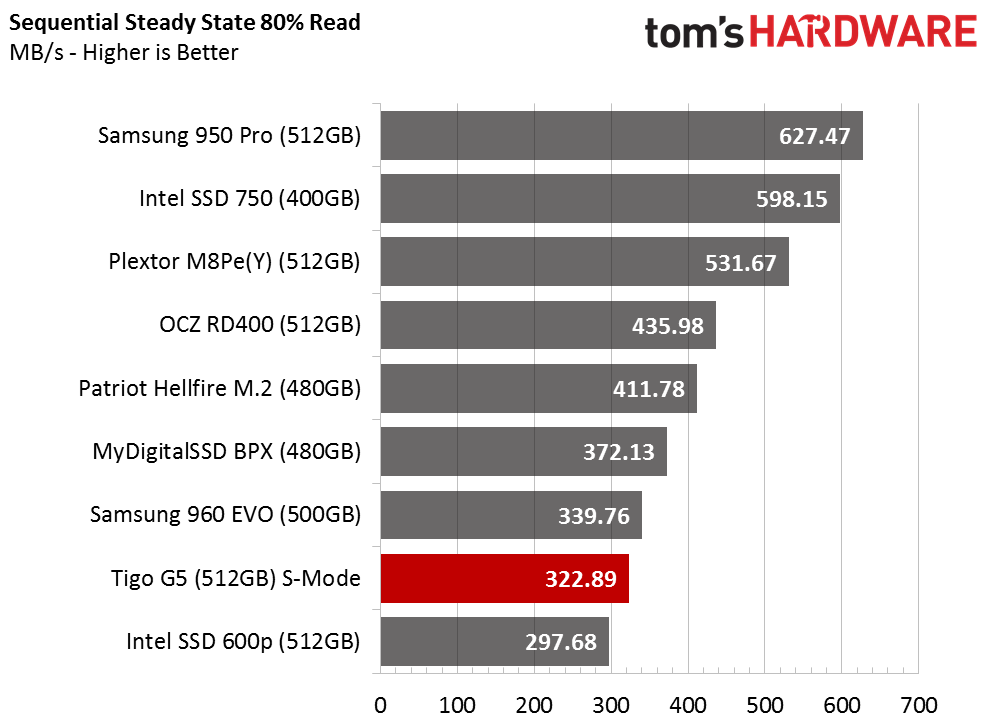
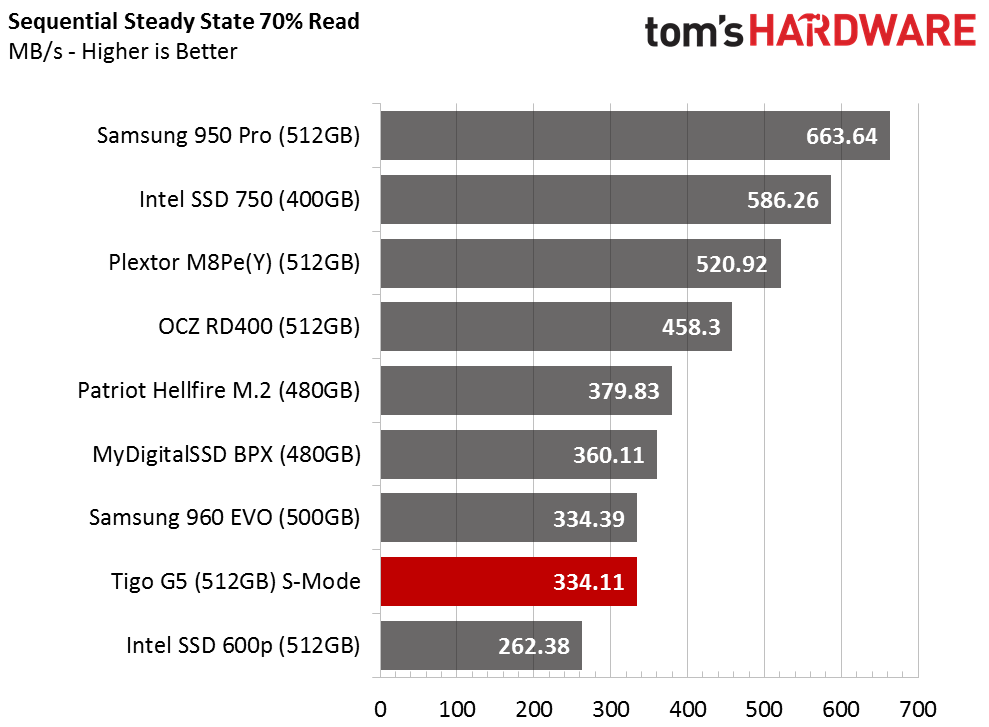
Tigo built the G5 for gamers rather than studio professionals or those running write-intensive workloads. It's not the best design for heavy write workloads where you will push the SSD down into steady-state conditions.
Random Steady-State
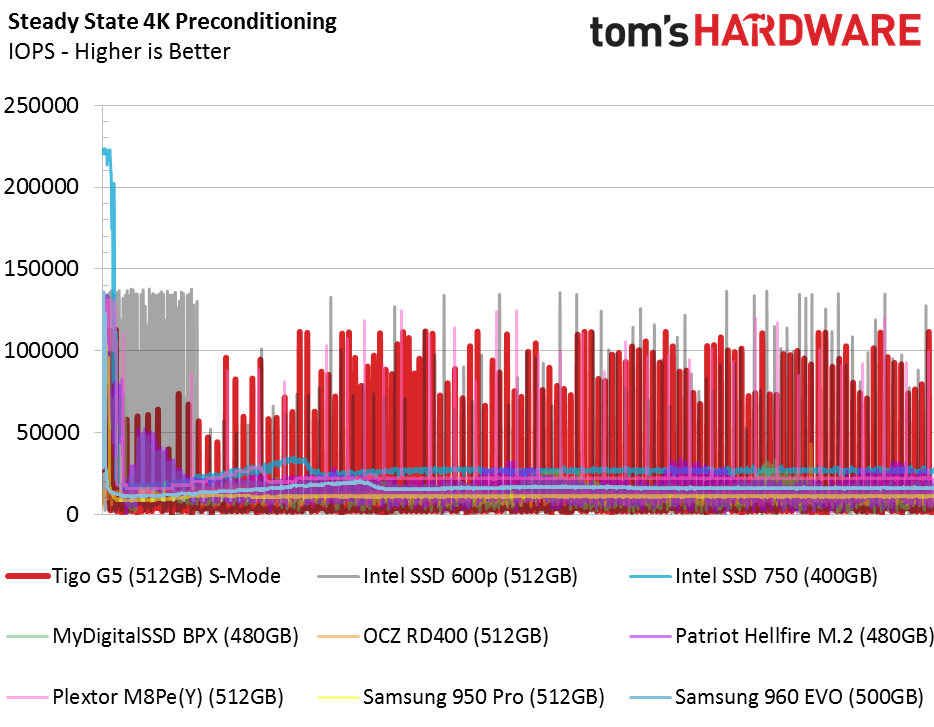
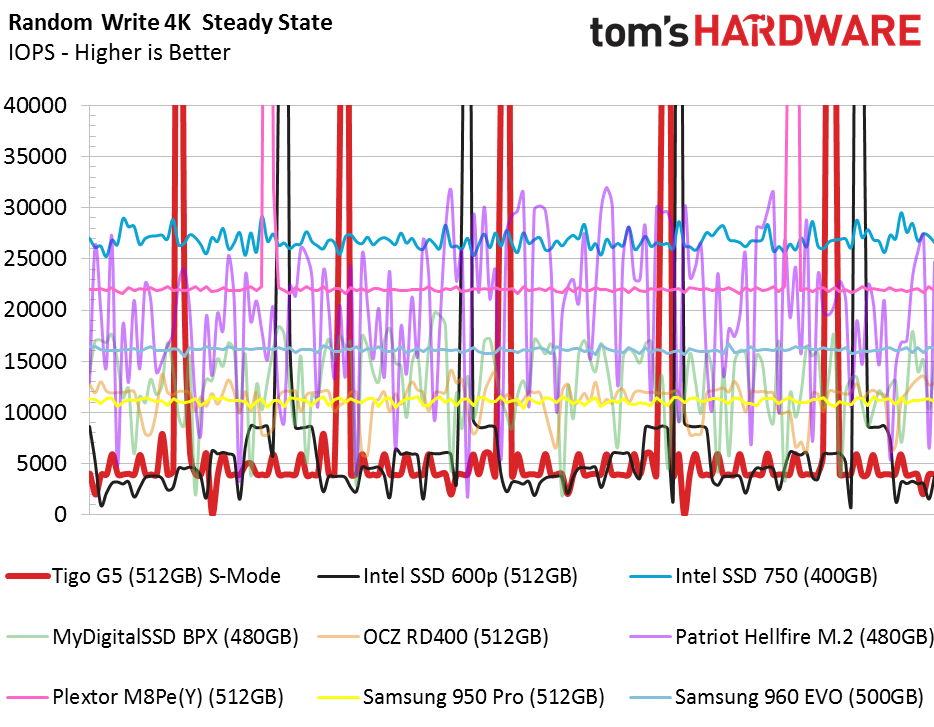
We expected more random write performance from IMFT's 3D MLC NAND, but sadly, its performance is nearly identical to 3D TLC on the Intel 600p. Both NVMe SSDs have a low steady-state baseline and spike when the buffer has space to accept incoming data. The result is inconsistent performance, so the G5 isn't a good choice for a consumer RAID array.
PCMark 8 Real-World Software Performance
For details on our real-world software performance testing, please click here.
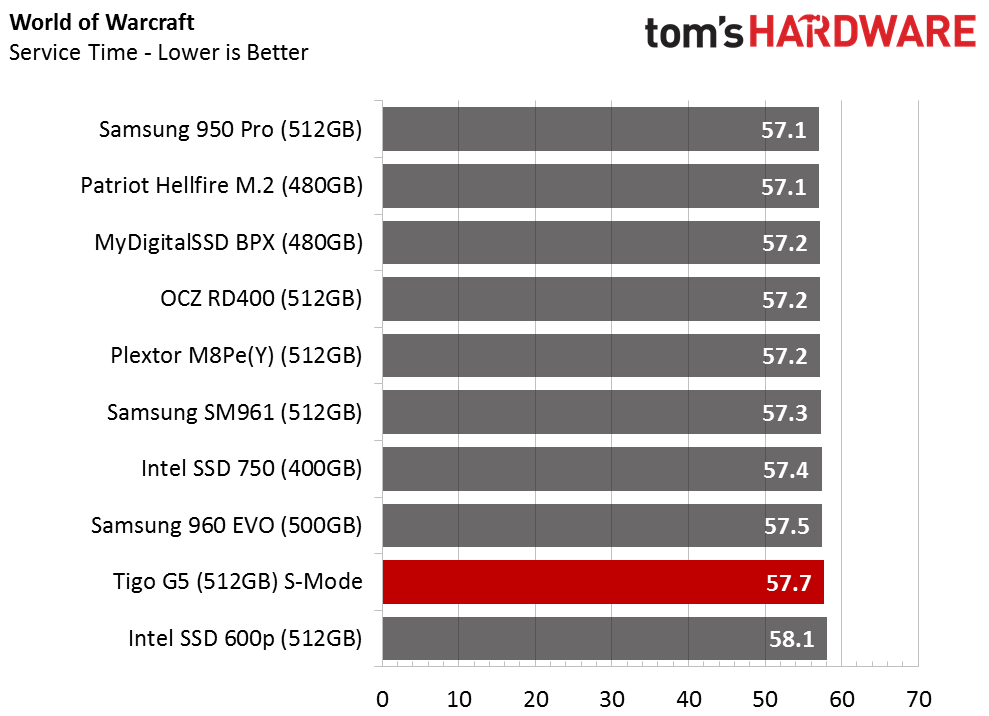
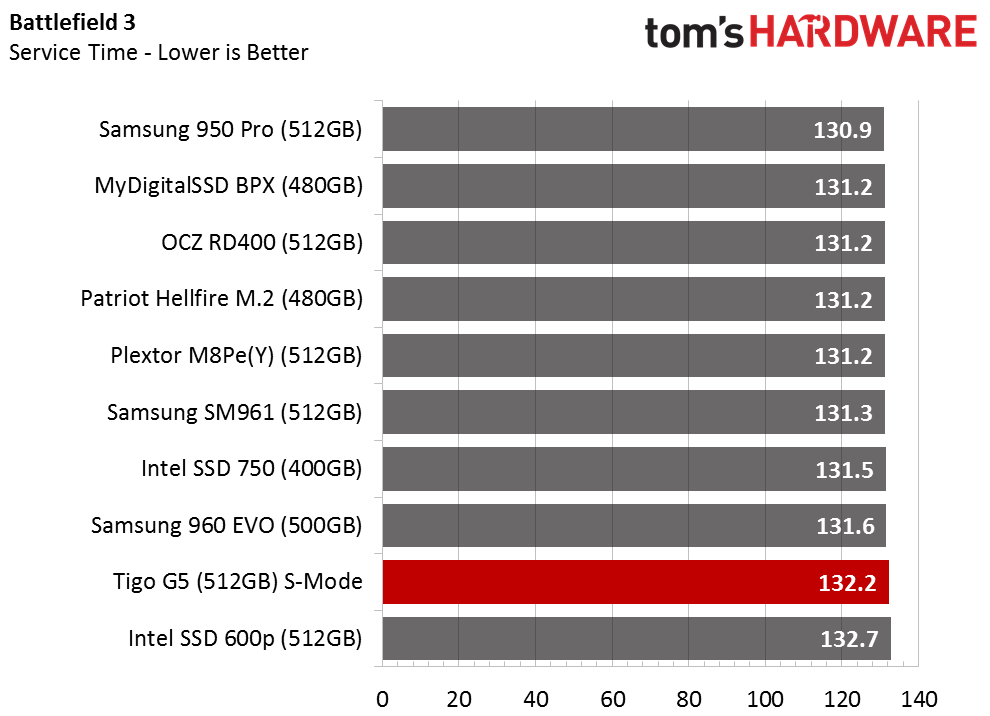
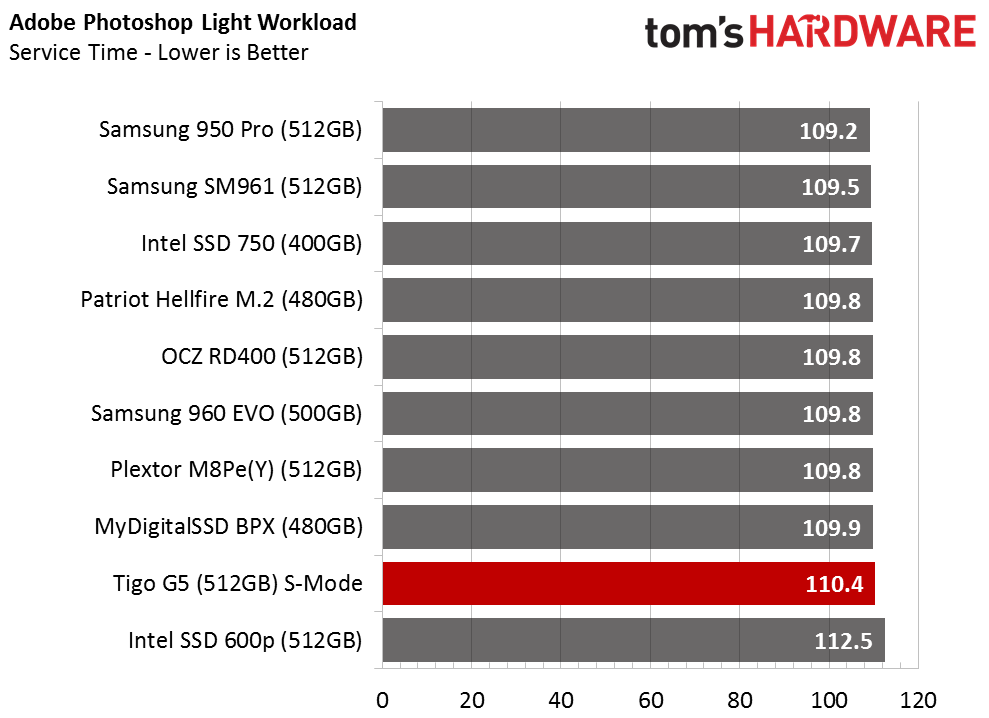
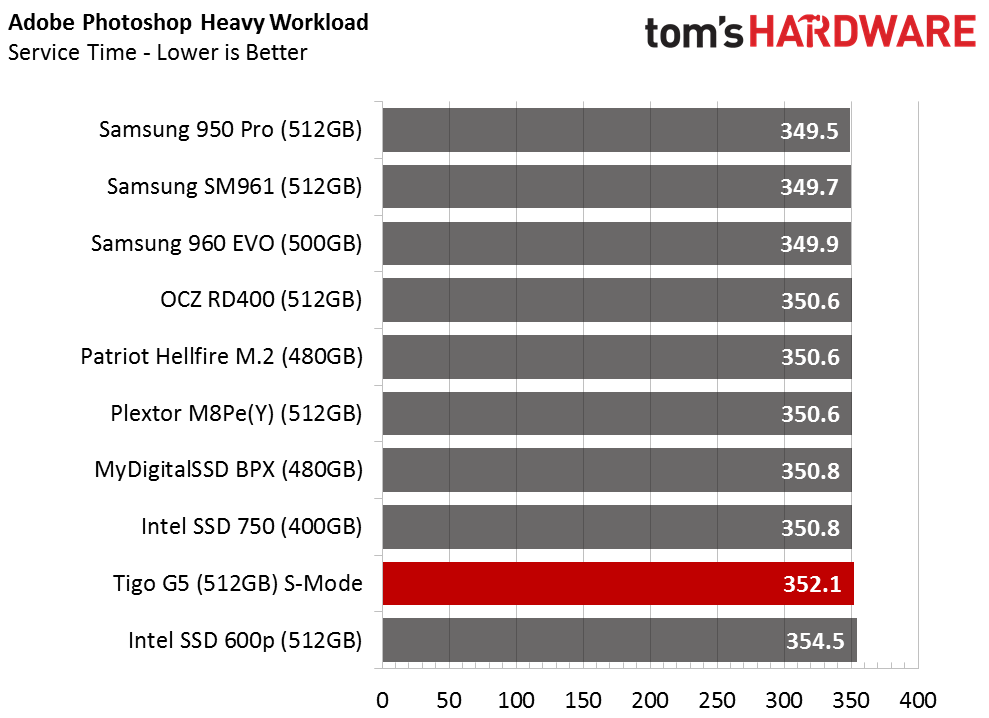
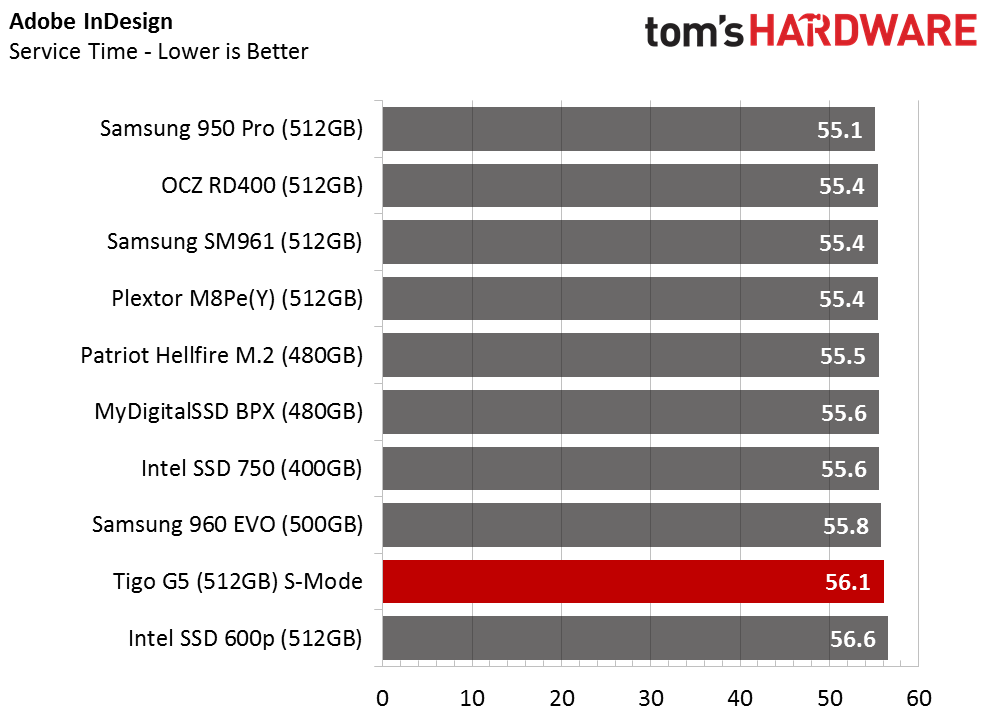
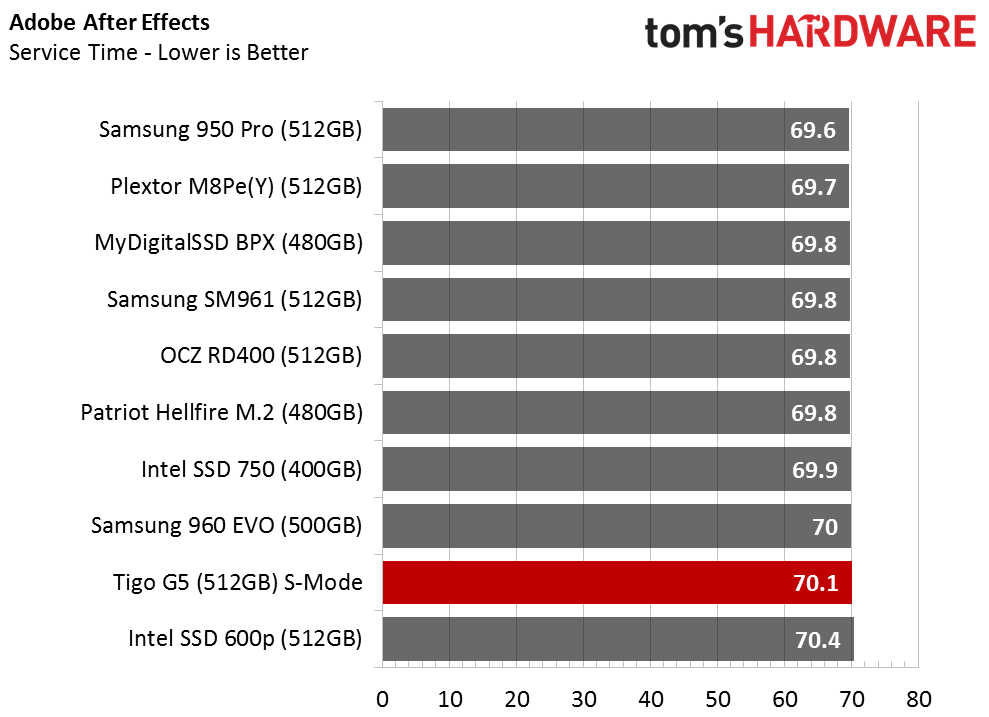
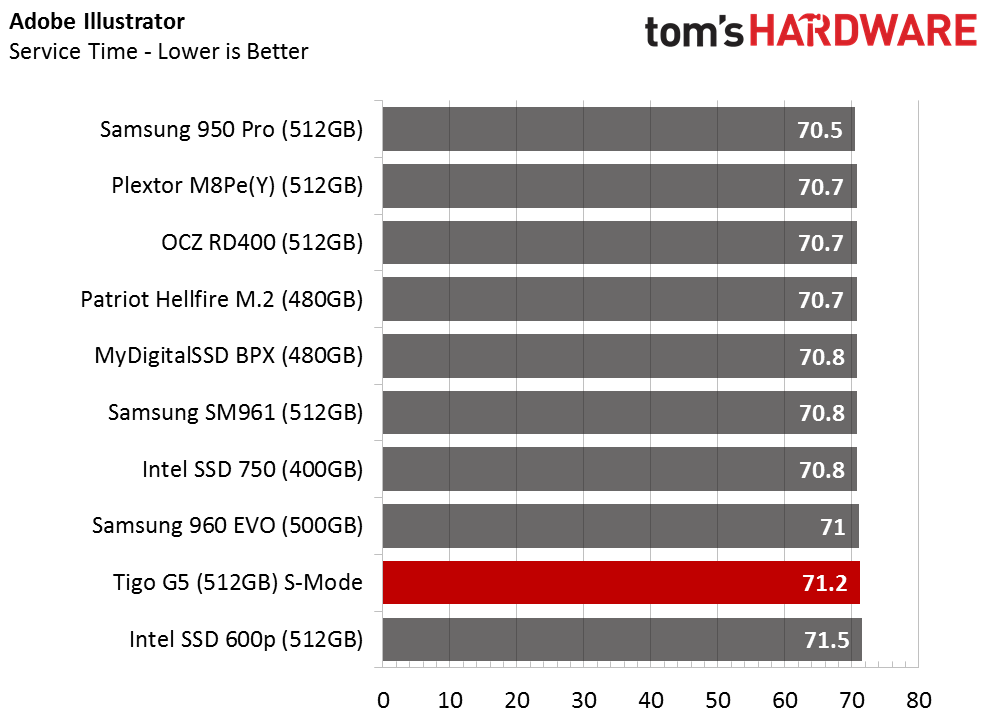
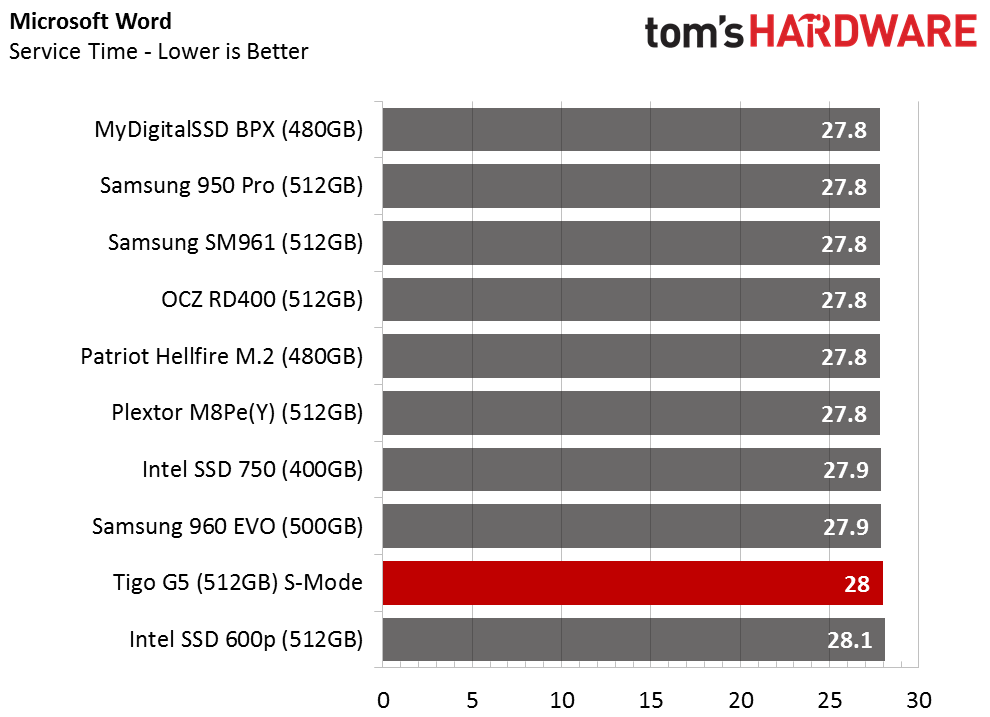
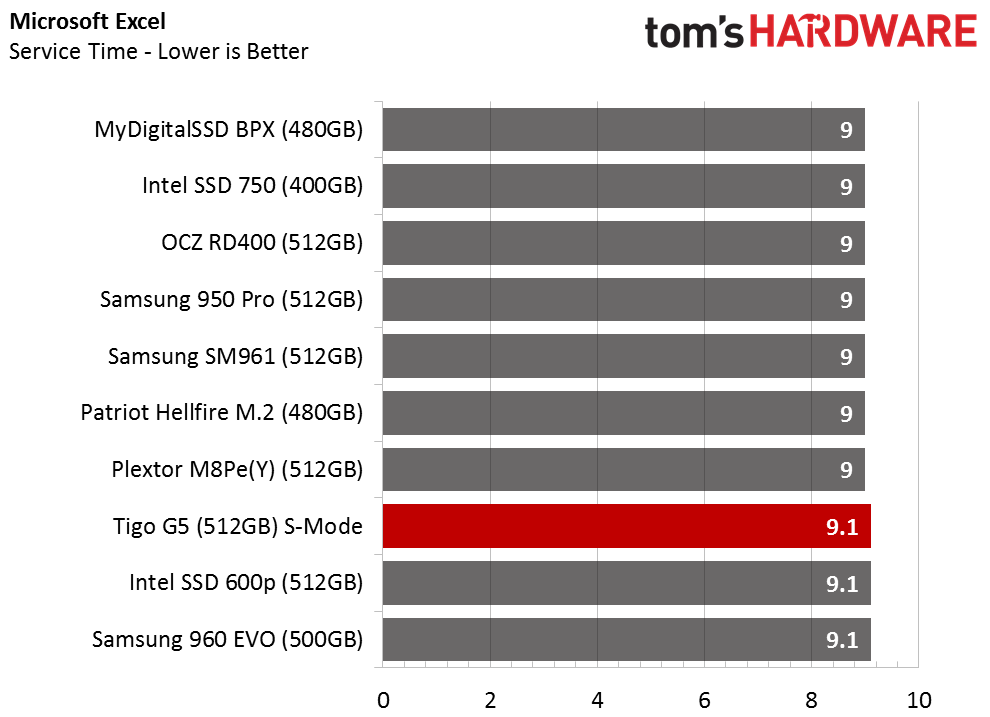
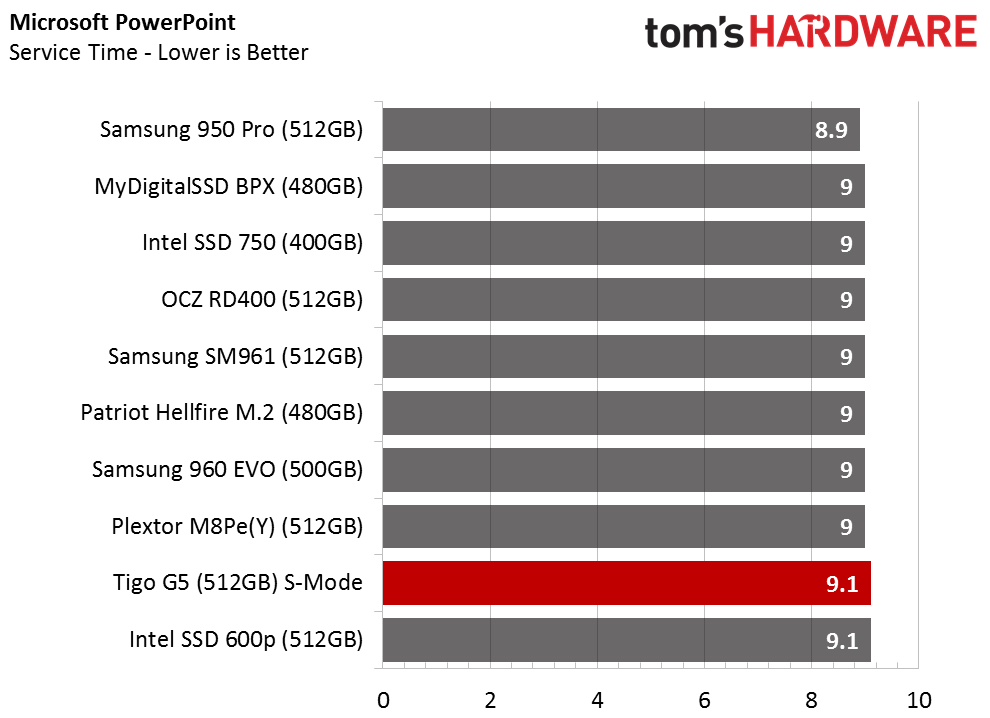
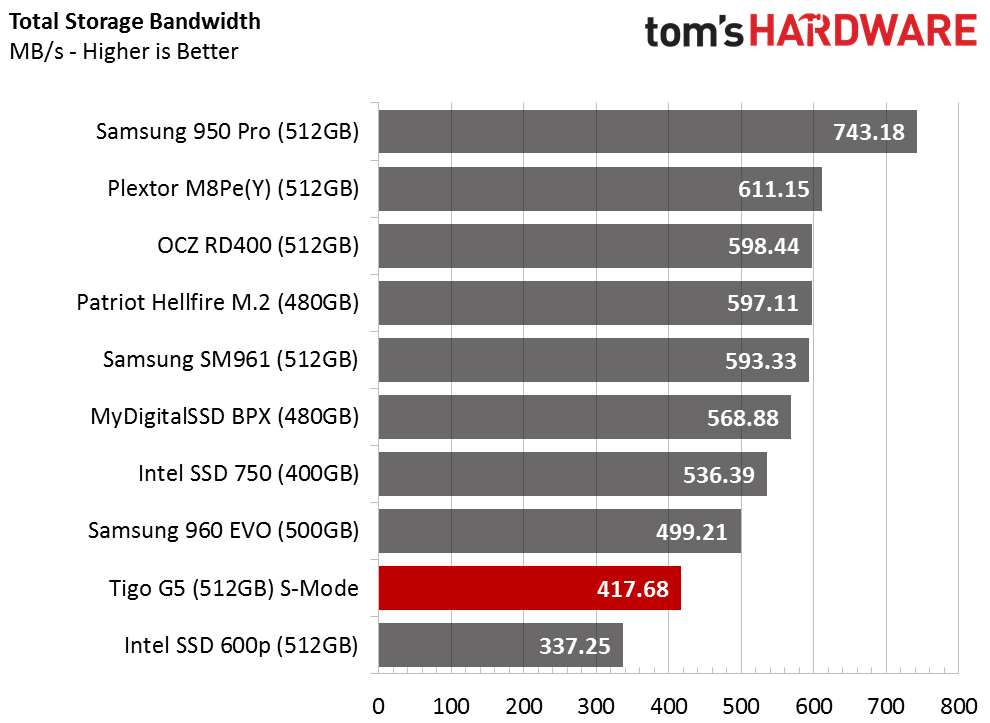
The Tigo G5 doesn't look like a stellar performer compared to the fastest consumer SSDs in the world, but the drive does deserve to be on the list. The G5's performance is slightly higher than the Intel 600p, and we've already shown that the 600p is faster than the best SATA-based products ever made.
Application Storage Bandwidth
We see how the G5 compares to our standard NVMe test pool when we average the results and present them as a throughput value.
PCMark 8 Advanced Workload Performance
To learn how we test advanced workload performance, please click here.
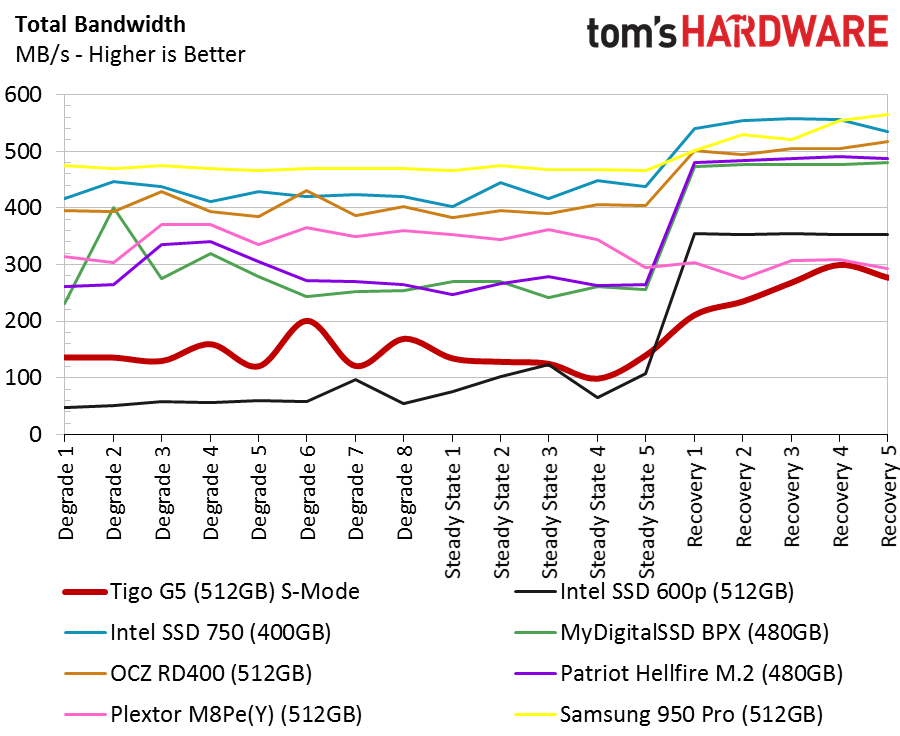
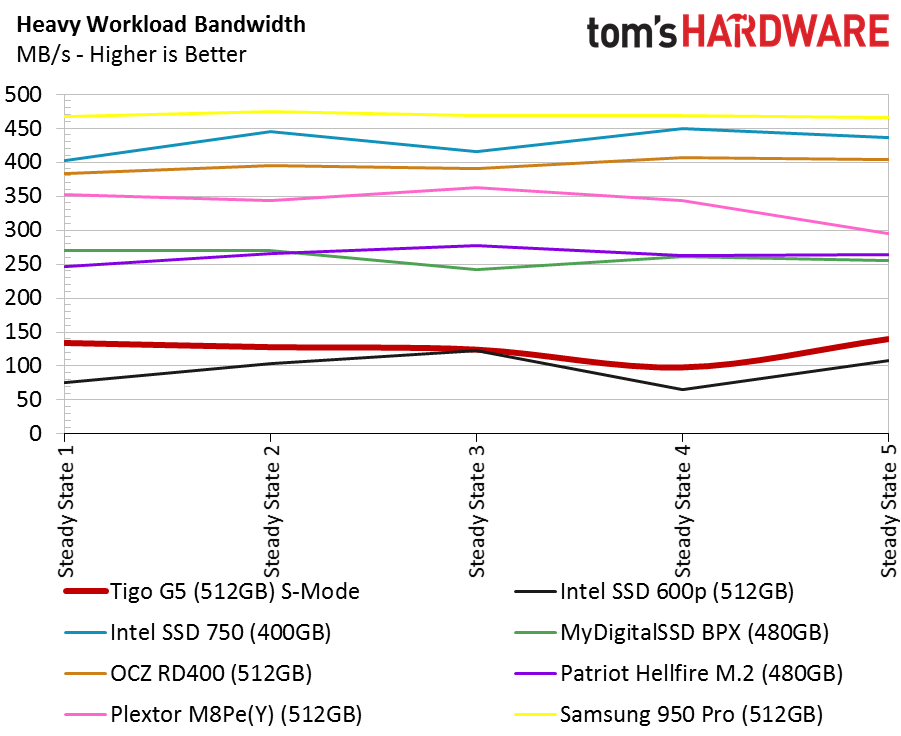
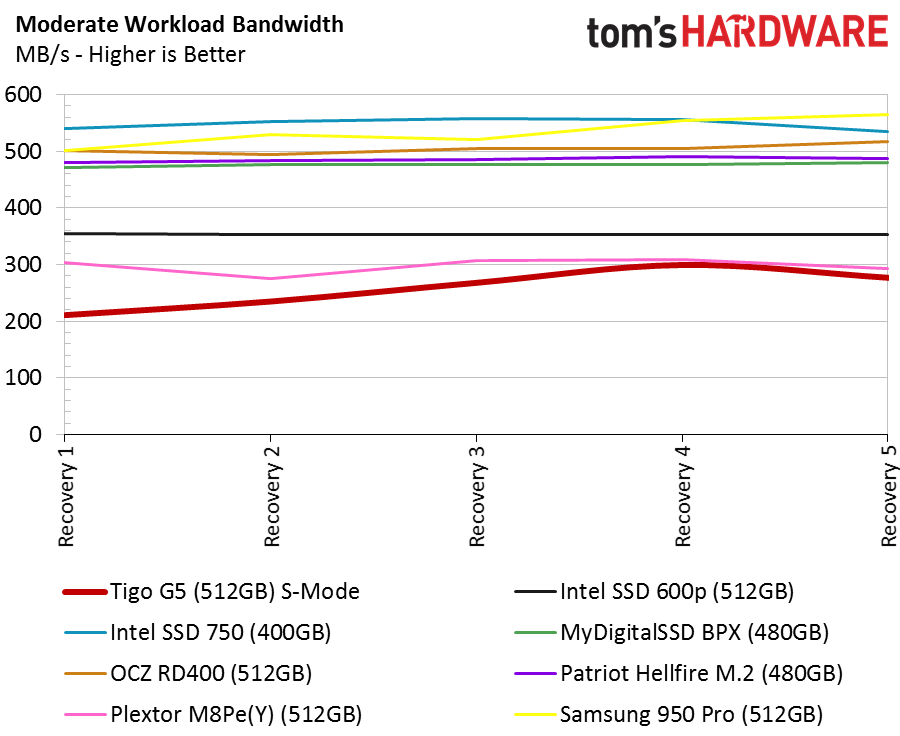
We've been fairly hard on IMFT's new 3D NAND. We've tested the 3D TLC with two controllers, and now we've tested the 3D MLC NAND with two different controllers. Don't get me wrong, Toshiba's 3D BiCS flash doesn't seem much better in our limited number of samples, either.
The flash isn't the only culprit here, though. The Tigo G5 takes longer than most other NVMe SSDs to recover from heavy write workloads. In some of our tests, we had to increase the idle time between the tests to get a better sample. In short, we cheated the test a little because of the longer recovery time the G5 needs to conduct performance-refreshing background activity. In the Futuremark PCMark 8 Extended Storage Test, which is entirely automated, we had no choice other than to let the test run as normal.
The G5 outperformed the Intel 600p before the third steady-state test iteration, but the two drives achieved parity at that point. The recovery phases of the test have a 300-second pause between workloads, which allows the SSD to recover. The 600p overtook the G5 in the first recovery phase, while the G5 needed the extra idle time between each 25-minute test to recover.
Total Service Time
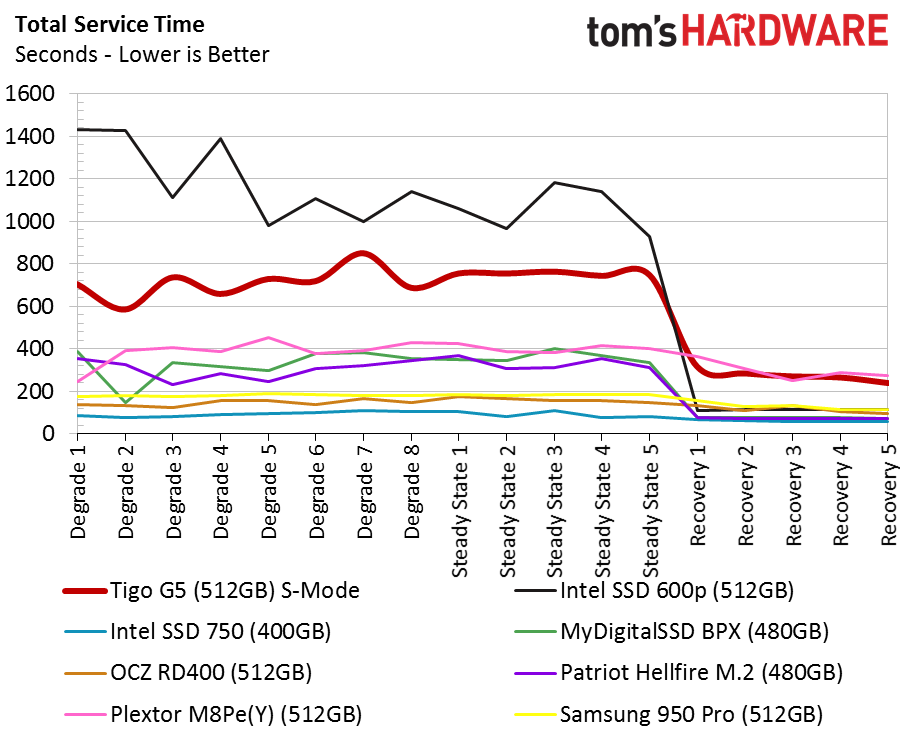
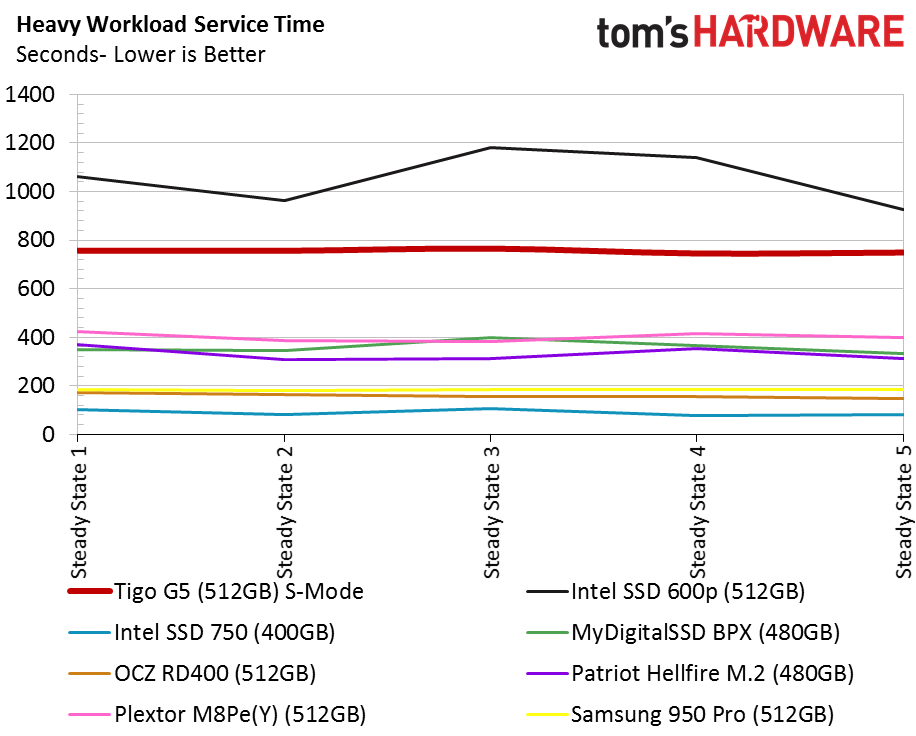
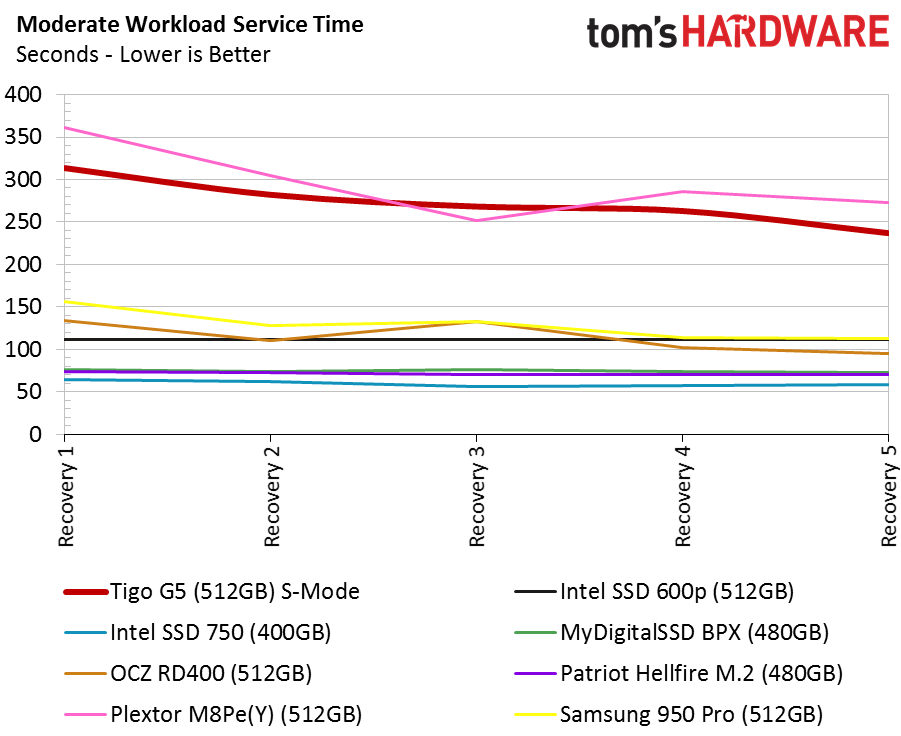
In the service time tests, we see the Tigo G5 never recovers enough to gain parity with the Intel 600p. This has to be firmware related, but given SMI's unique experience with this flash, we suspect the IMFT 3D NAND is more difficult to tame than planar flash.
Disk Busy Time
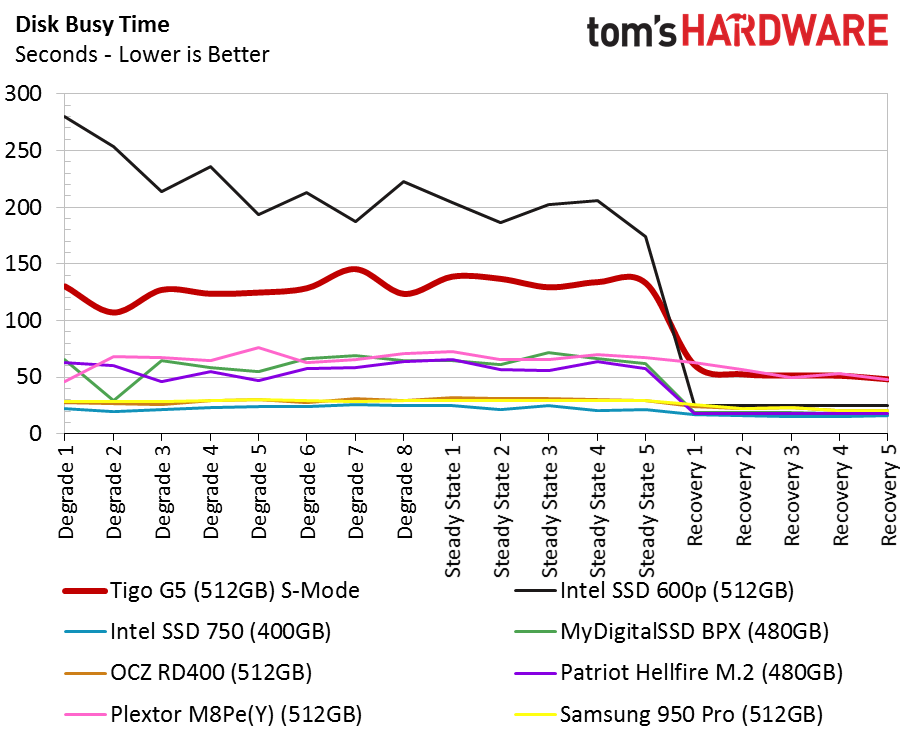
We also want to point out that the Tigo G5 is not available, at least not at the time of writing. Products like this often receive a last-minute firmware update just before release. We know the 1TB model did not have mass production firmware during our testing cycle. SMI told us it is working on a new firmware that will be ready for launch. The lessons learned during that process could trickle down to the lower capacity drives, like the G5 512GB we are testing. The disk busy time test shows us that the G5 could use a little tweak too, at the very least, to get on the same performance plane as the Intel 600p.
Power Control Test
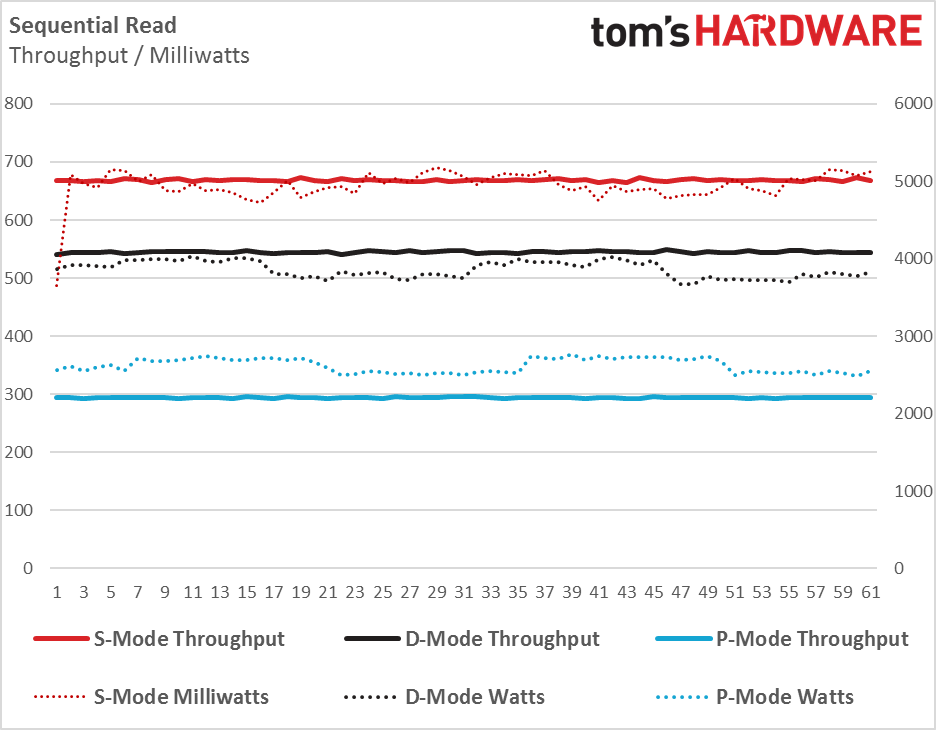
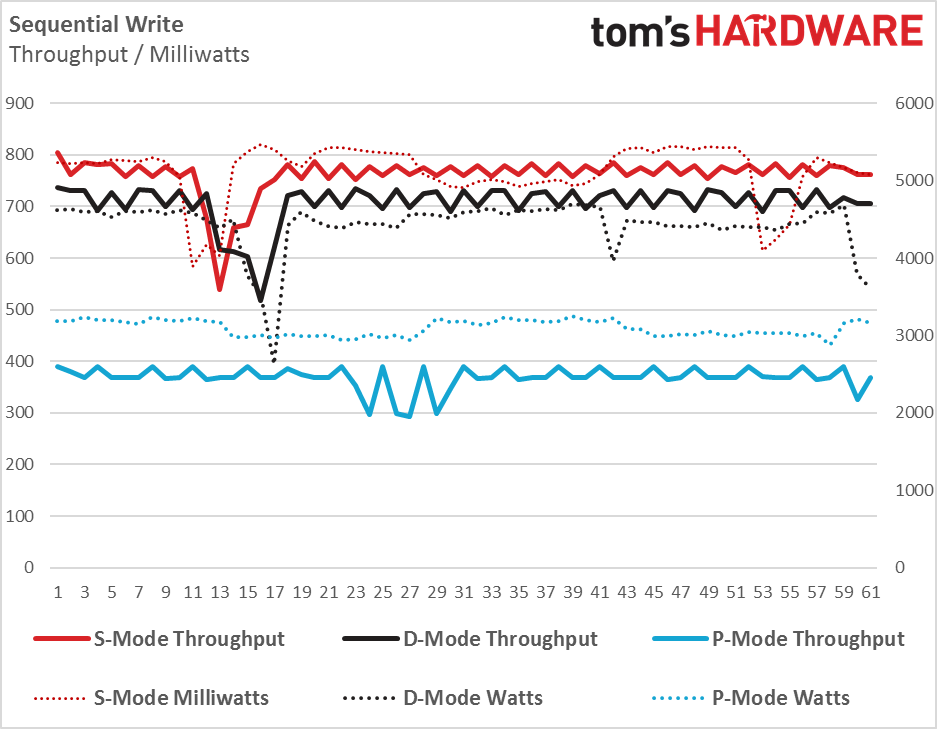
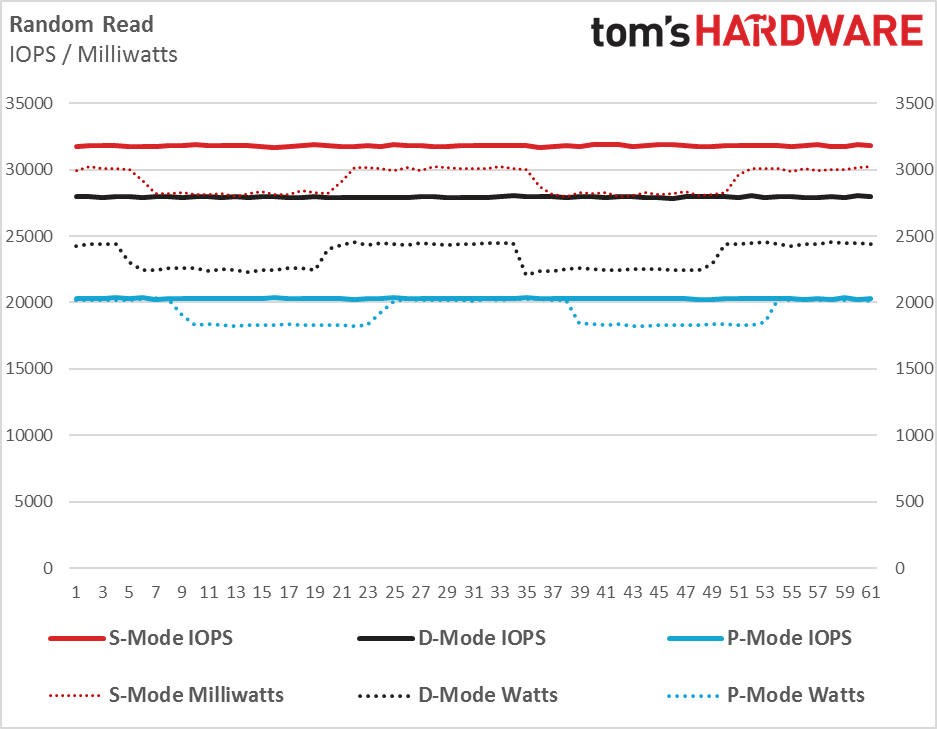
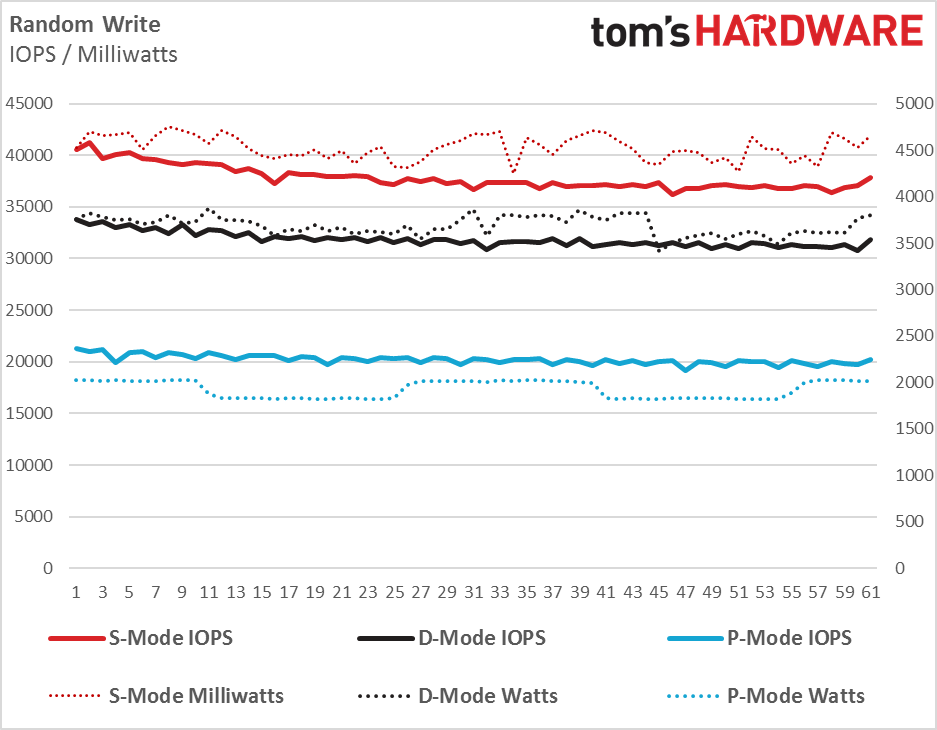
We turned to our Quarch XTC meter, which is designed specifically for testing storage devices, to test the three-mode power switch on the Tigo G5. The meter worked flawlessly for the task and will play a much larger role in our drive testing in 2017.
We kept the tests simple. Each of the four-corner workloads has a dedicated chart. Each chart has a throughput or IOPS rating (scale on the left), and the power, in milliwatts, is on the right. The selector switch decreases performance in all four corner workloads, but it also reduces power consumption. You don't need to shut the system down to make a new selection, so getting to the switch is the most difficult task.
MORE: Best SSDs
MORE: Latest Storage News
MORE: Storage in the Forums

Chris Ramseyer was a senior contributing editor for Tom's Hardware. He tested and reviewed consumer storage.
-
HERETIC-1 Hi Chris,Reply
Presume the MLC has higher endurance-didn't see it mentioned.
Have a request-
You did your round-up of ramless drives(that sit just above the lemons) how about-
BOOT DRIVES.
Most of us use a small SSD as boot drive backed up by lots spinning rust.
It's not that long ago they would be 120GB drives-since the eol of the Samsung
120GB EVO think 240/275 is probably the most common now.
Guessing they would mainly be MLC,3D and perhaps 750EVO and Sandisc ultra2.
My line in the sand is usually-min 8000-4K-IOPS-QD1 Read,and I like to see at
least 200MB sequential write after any buffer so as not to bottleneck spinning rust.
Thanks -
CRamseyer I've kicked around the idea of writing a 128GB roundup since we haven't covered the capacity for two years. There are some challenges I haven't been able to overcome.Reply -
HERETIC-1 Hi Chris,Reply
As per my earlier post I think 240/275 is probably the minimum for a boot drive
today-with 850 PRO being the only exception,and when you look at the price-
it makes more sense to get a larger drive.

