WD Blue SN500 M.2 NVMe SSD Review: Leaving SATA in the Dust (Updated)
WD's Blue SN500 brings SATA-like pricing to a speedy NVMe SSD.
Why you can trust Tom's Hardware
Comparison Products
At the 500GB capacity point, we opted to pit the WD Blue SN500 against its SATA brother, the WD Blue 3D. As well, we threw in results from our testing of two PCIe 3.0 x2 devices for fair comparison, the MyDigitalSSD SBX and Crucial P1. We also wanted to see if the SN500 could compete with some of the best, so we threw in the MyDigitalSSD BPX Pro, Intel SSD 760p, Adata XPG SX8200 Pro, and Samsung 970 EVO Plus for good measure.
Trace Testing – PCMark 8 Storage Test 2.0
PCMark 8 is a trace-based benchmark that uses Microsoft Office, Adobe Creative Suite, World of Warcraft, and Battlefield 3 to measure the performance of storage devices in real-world scenarios.
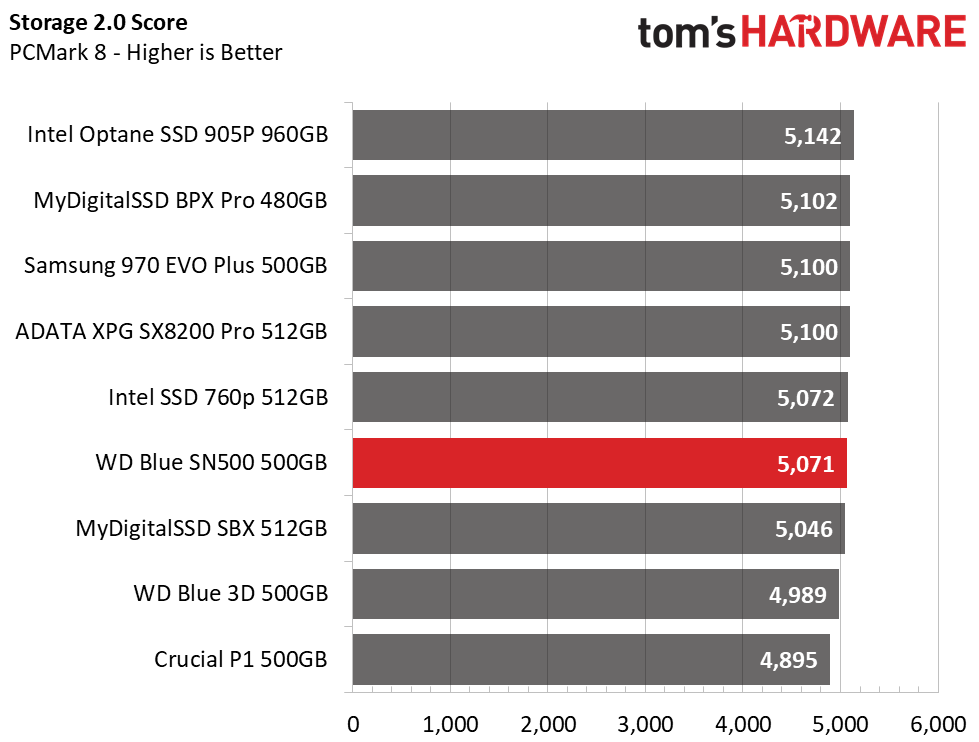
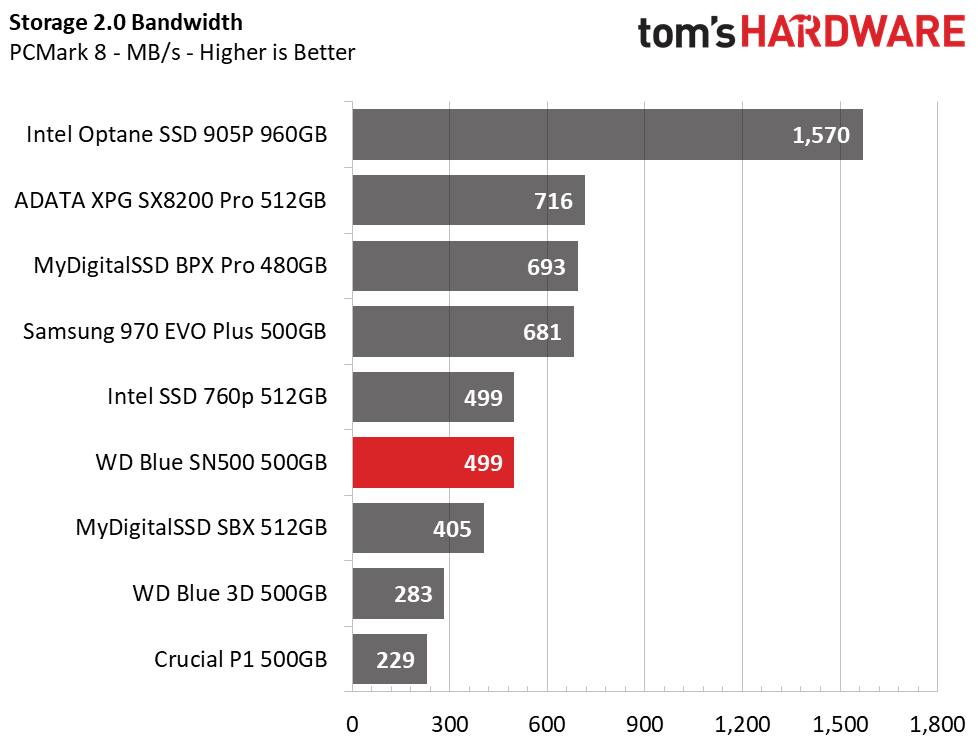
The Blue SN500 scored 5,071 and delivered an average bandwidth of nearly 500MB/s in its PCMark 8 run. With these scores, we can see that it does well, but there is still a clear advantage to having access to those two extra PCIe lanes if you want the absolute best performance. Here, it ranks sixth overall and easily outperformed its older, SATA-based sibling.
Game Scene Loading - Final Fantasy XIV
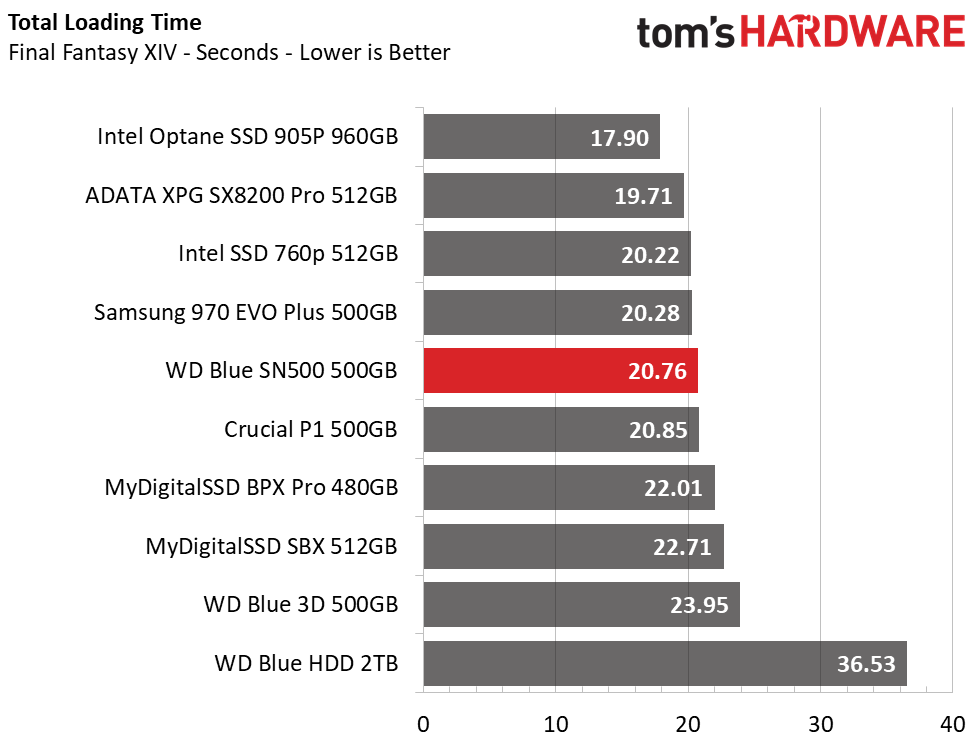
Final Fantasy XIV StormBlood is a free real-world game benchmark that easily and accurately compares game load times without the inaccuracy of using a stopwatch.
WD’s Blue SN500 offers up improved game load performance over the previous-gen SATA devices, shaving off a few seconds. Overall, the SN500 ranks fifth on our game load chart. With a total load time of 20.76 seconds, it is nearly as fast as the Samsung 970 EVO Plus, even though it only has half the bandwidth available.
Transfer Rates – DiskBench
We use the DiskBench storage benchmarking tool to test file transfer performance with our own custom 50GB block of data. Our data set includes 31,227 files of various types, like pictures, PDFs, and videos. We copy the files to a new folder and then follow up with a read test of a newly-written 6 GB file.
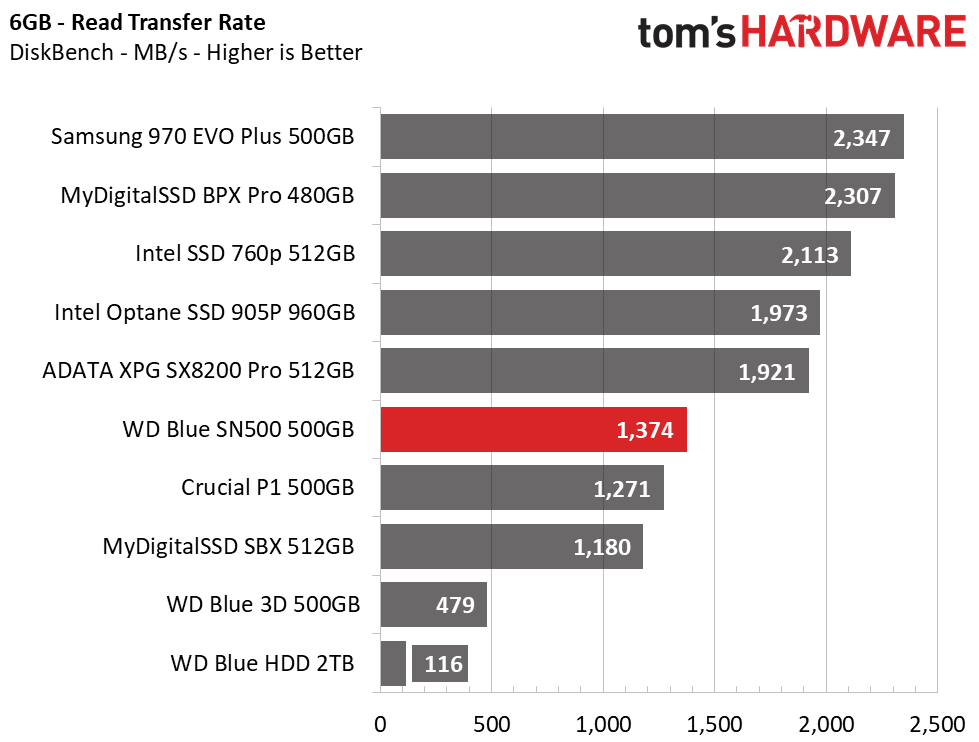
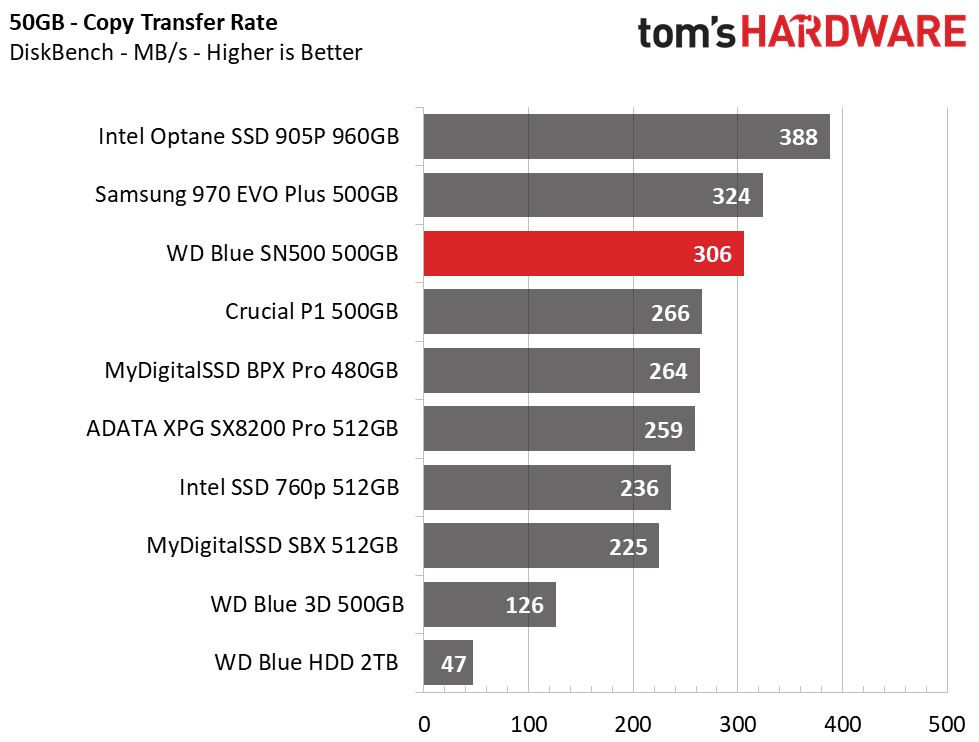
With all the work that went into optimizing the SLC cache and memory on the WD Blue SN500, we can see that it wasn’t for nothing. Write and copy performance seems to have been well optimized. An average transfer rate of 306MB/s when transferring our 50GB test folder enabled this SSD to outperform some high-end competition by a good margin, ranking it 3rd overall. With limited bandwidth, however, read performance isn’t quite as good. With an average performance score of 1.3-1.4GBps, it ranks sixth in our read test.
Get Tom's Hardware's best news and in-depth reviews, straight to your inbox.
SYSmark 2014 SE
Like PCMark, SYSmark uses real applications to measure system performance. SYSmark takes things much further, however. It utilizes fourteen different applications to run real workloads with real data sets to measure how overall system performance impacts the user experience. BAPCo's SYSmark 2014 SE installs a full suite of applications for its tests, which includes Microsoft Office, Google Chrome, Corel WinZip, several Adobe software applications, and GIMP. That also makes it a great test to measure the amount of time it takes to install widely-used programs after you install a fresh operating system.
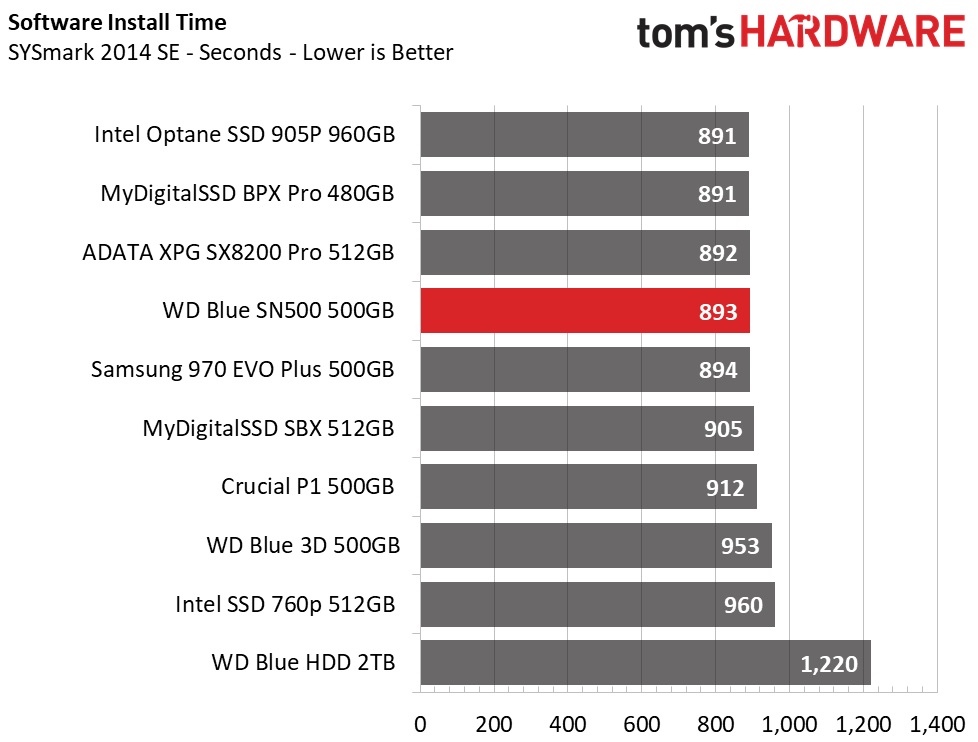
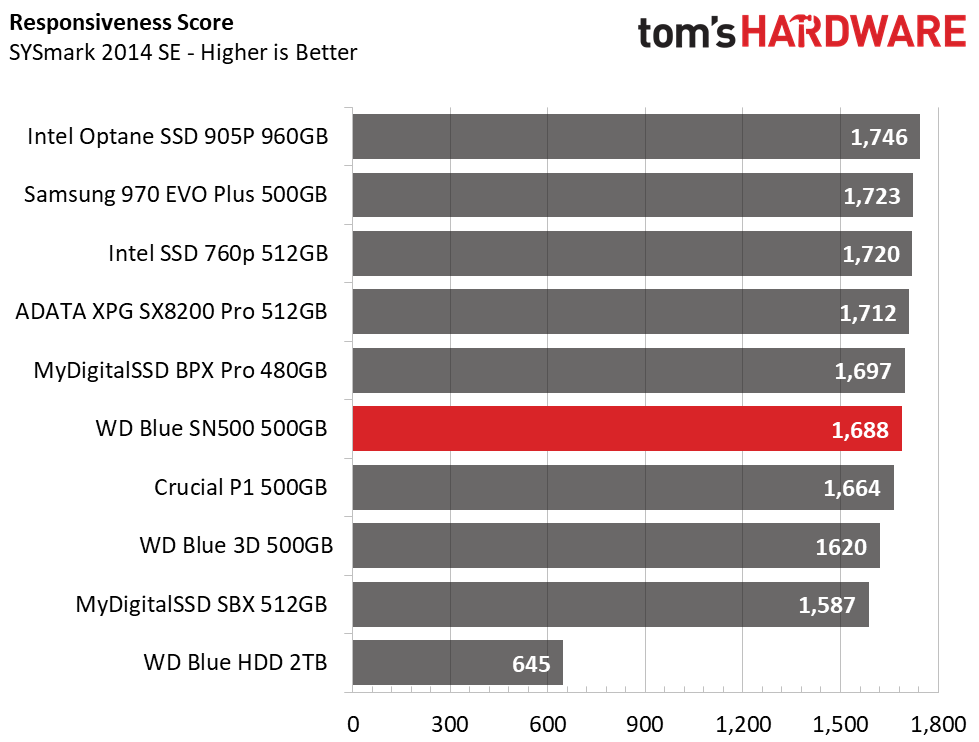
As we have seen previously, the WD Blue SN500’s write performance is stellar. So it should go without saying that it can install your applications in a quick manner. SYSmark installed in 14 minutes and 53 seconds, which is just two seconds slower than the Intel Optane SSD 905P. And, once we put it through its paces,the SN500 received a respectable responsiveness score of 1688 points. It’s not quite as snappy as the PCIe 3.0 x4 devices, but its performance is more than enough for the average consumer.
ATTO
ATTO is a simple and free application that SSD vendors commonly use to assign sequential performance specifications to their products. It also gives us insight into how the device handles different file sizes.
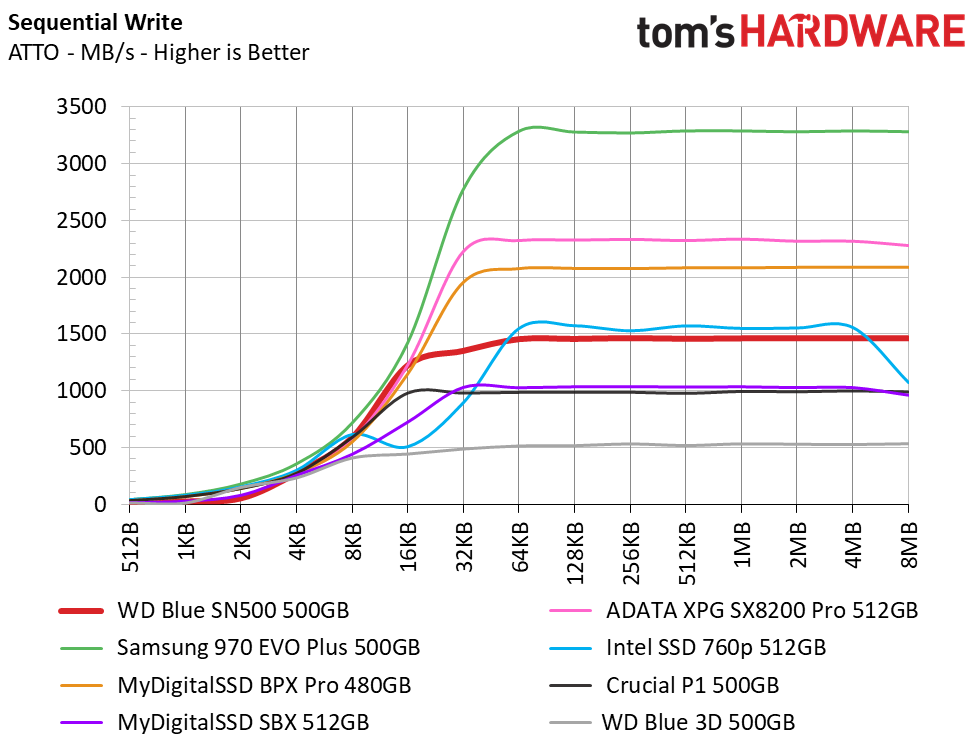
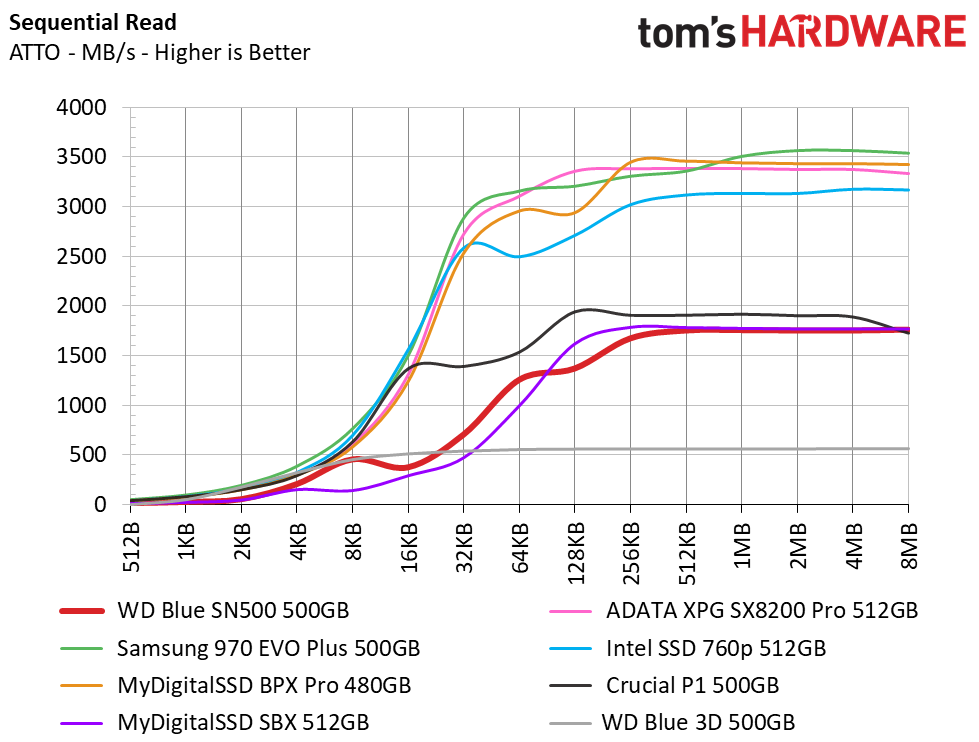
Sequential read and write performance clocks in at 1,750MB/s read and 1,465MB/s read in ATTO. While this is near the bottom of the pack, it is still three to four times faster than your average SATA SSD. And, write performance is almost on par with the Intel 760P, which is quite impressive.
CrystalDiskMark
CrystalDiskMark (CDM) is a simple and easy to use file size benchmarking tool.
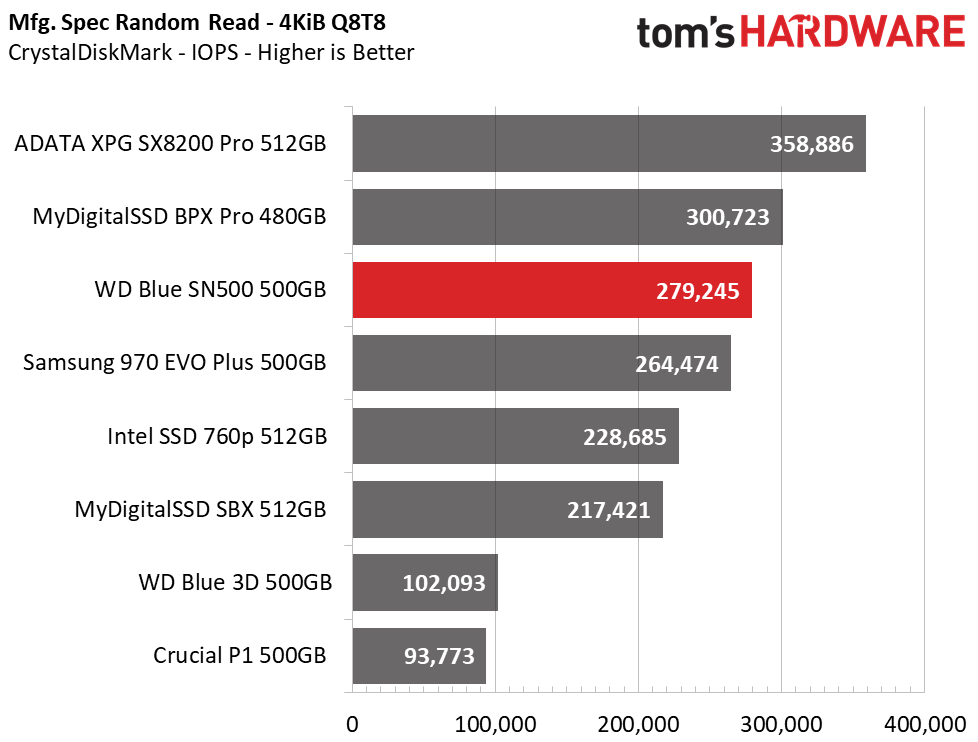
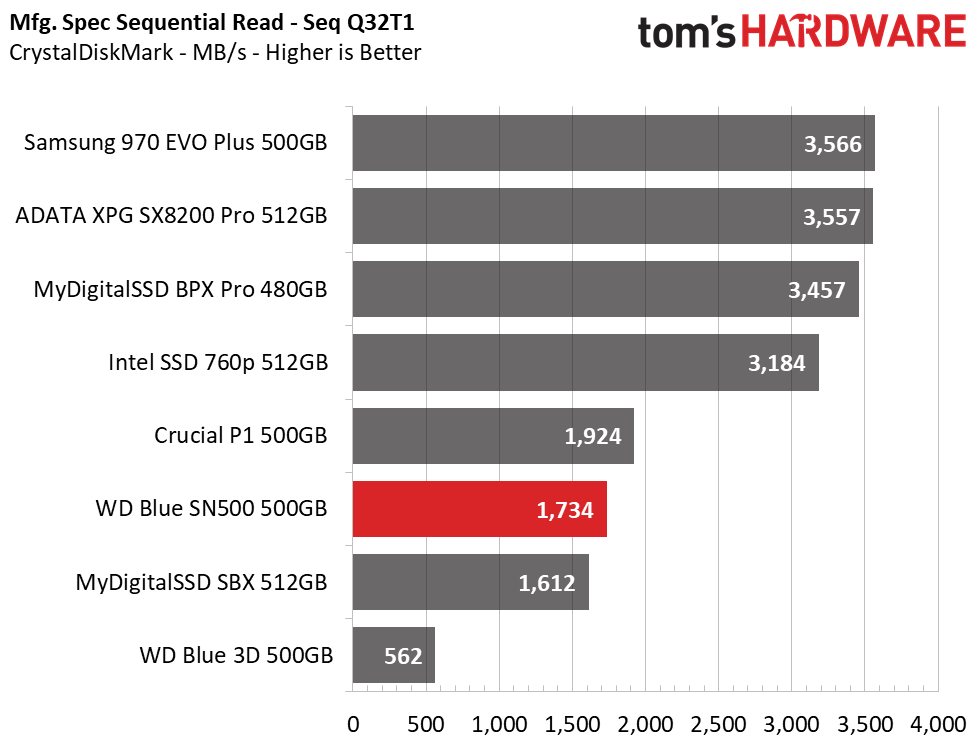
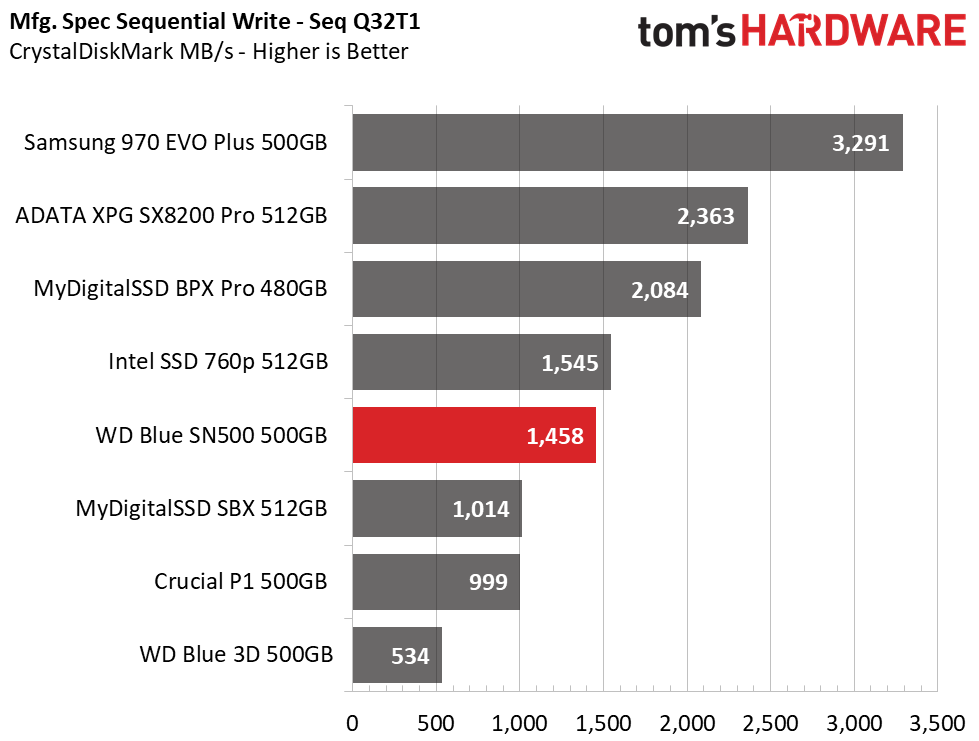
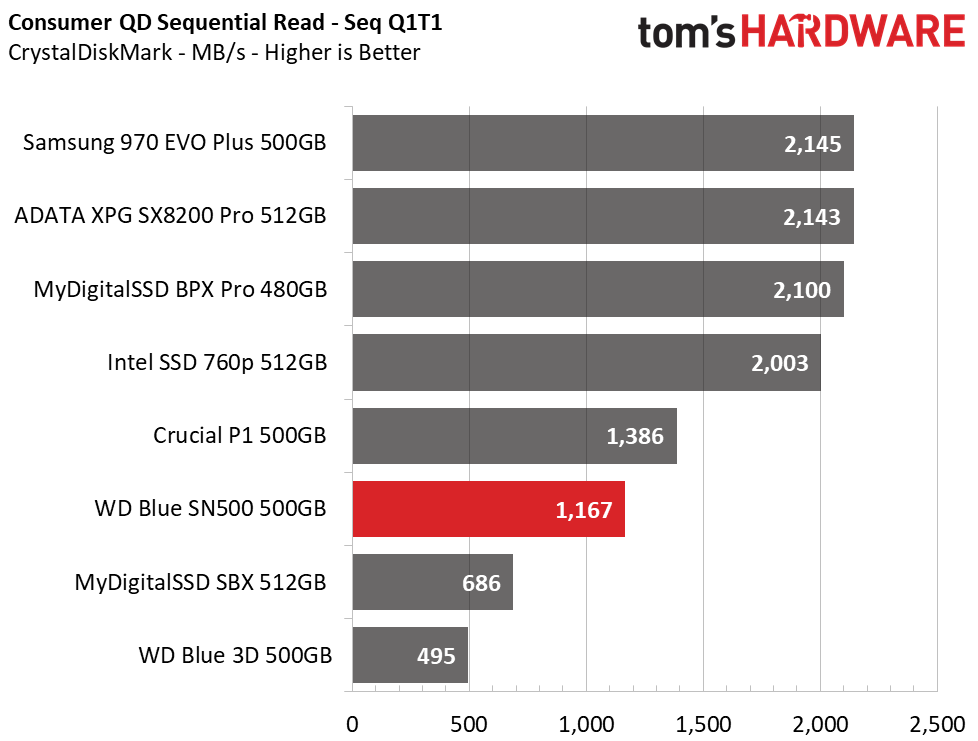
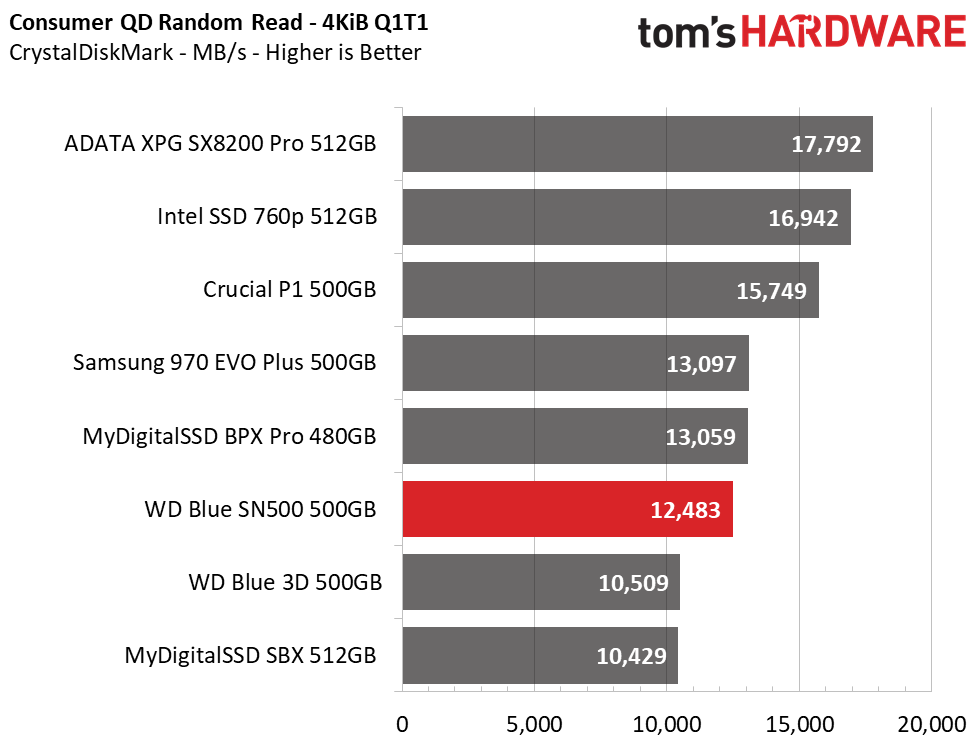
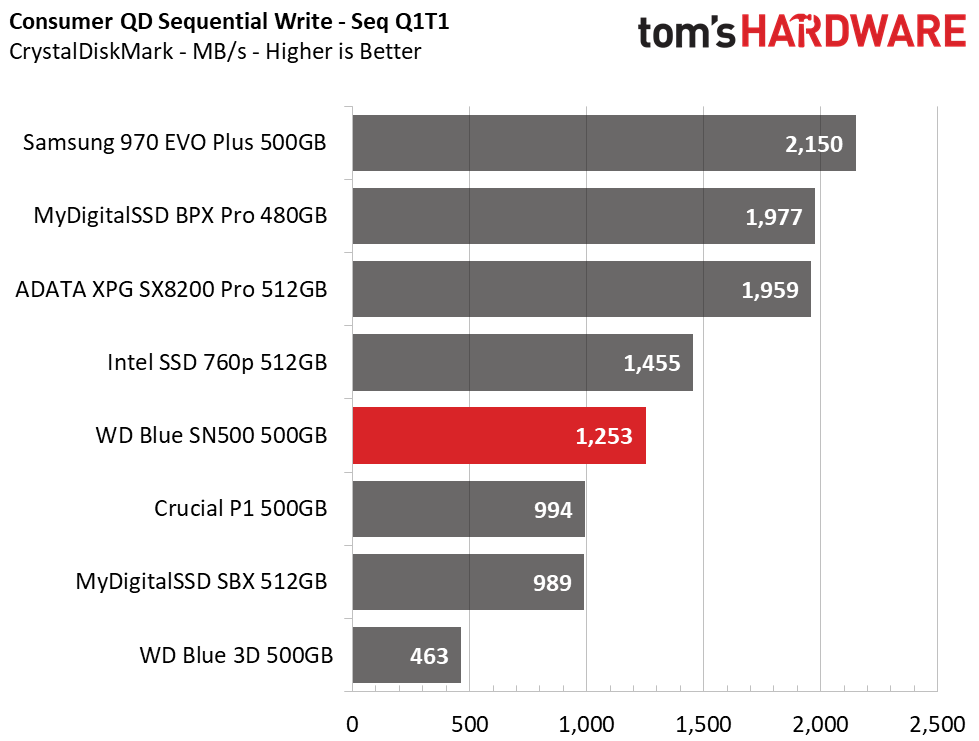
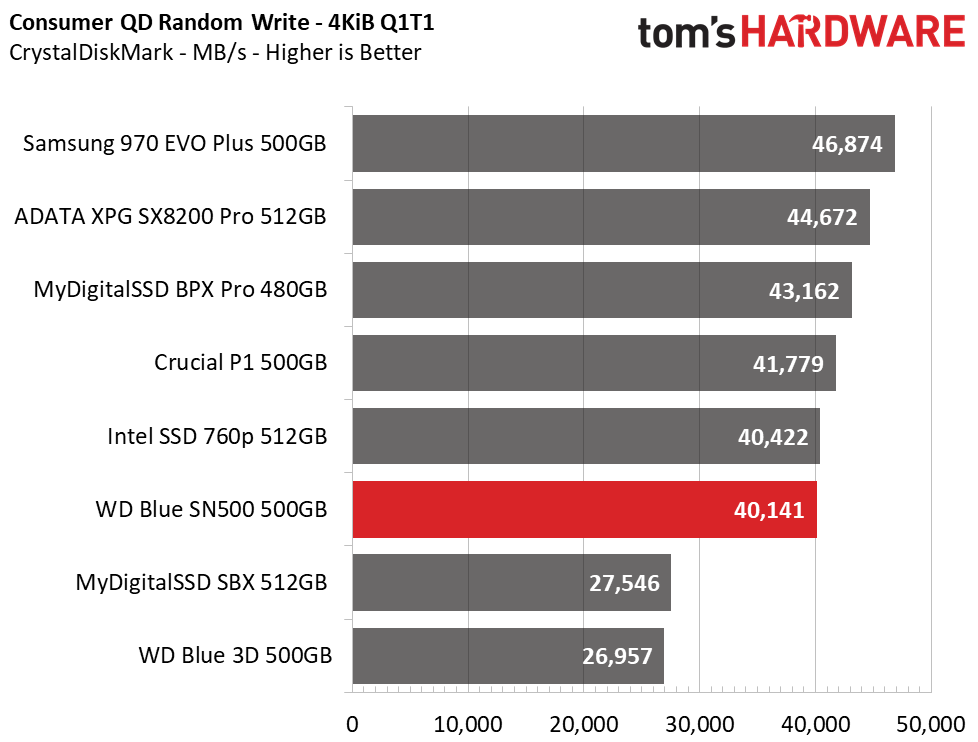
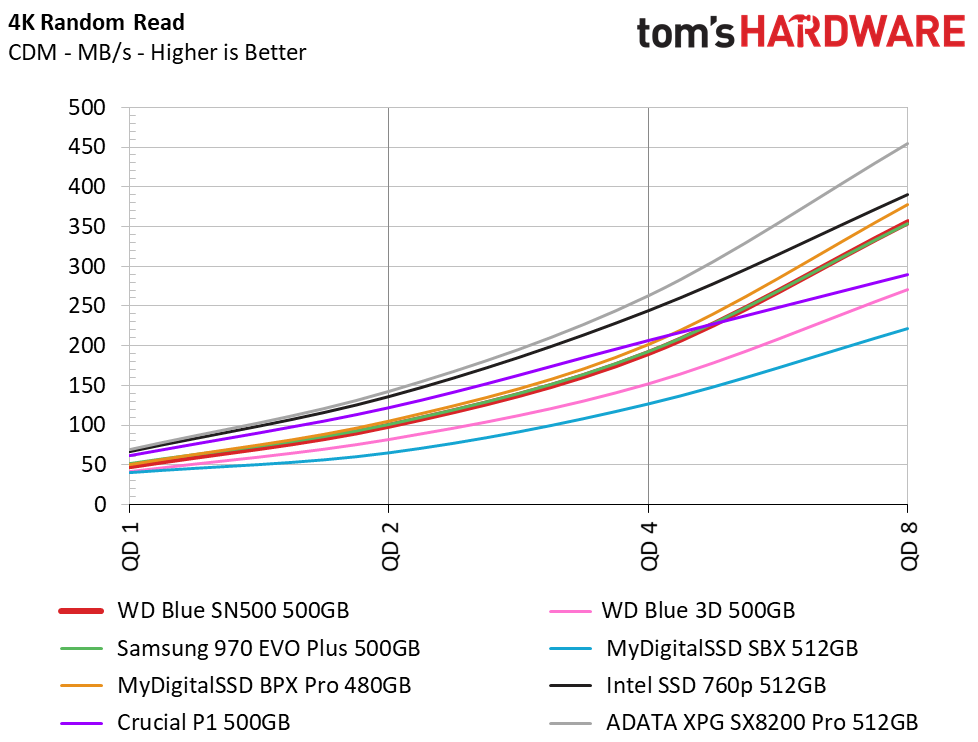
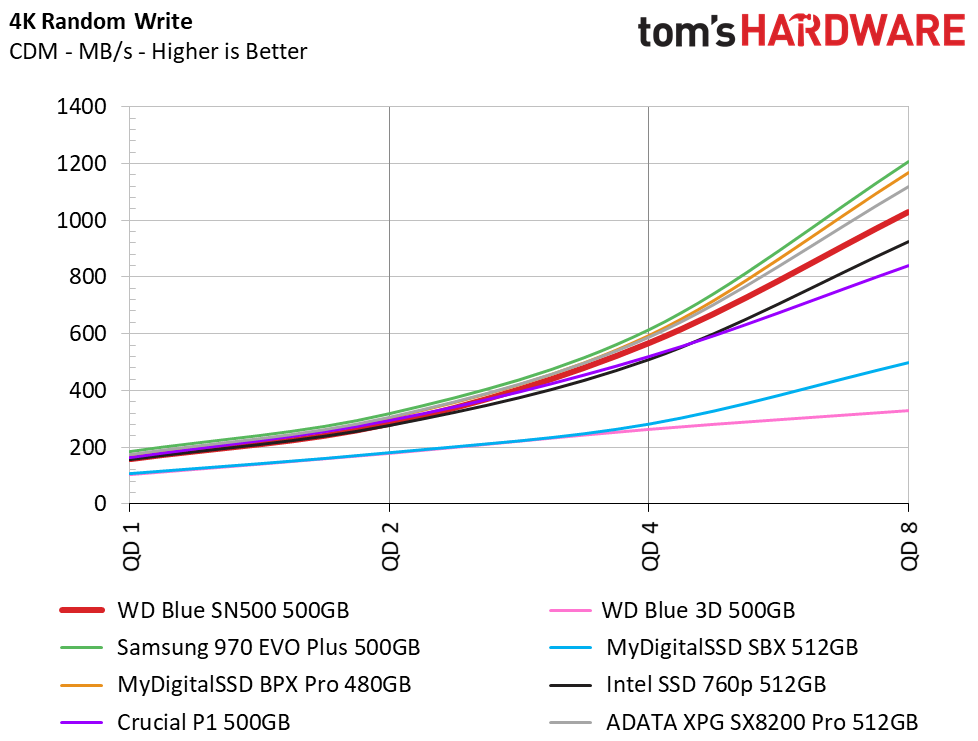
Sequential performance results from CDM nearly tie that of ATTO. Average read/write speeds come in at about 1.7/1.4GBps read/write at a QD of 32. Scaling back down the load to a more realistic QD of 1, we can see that read performance is a bit lower than the QLC based Crucial P1, but write performance is about 250MBps faster.
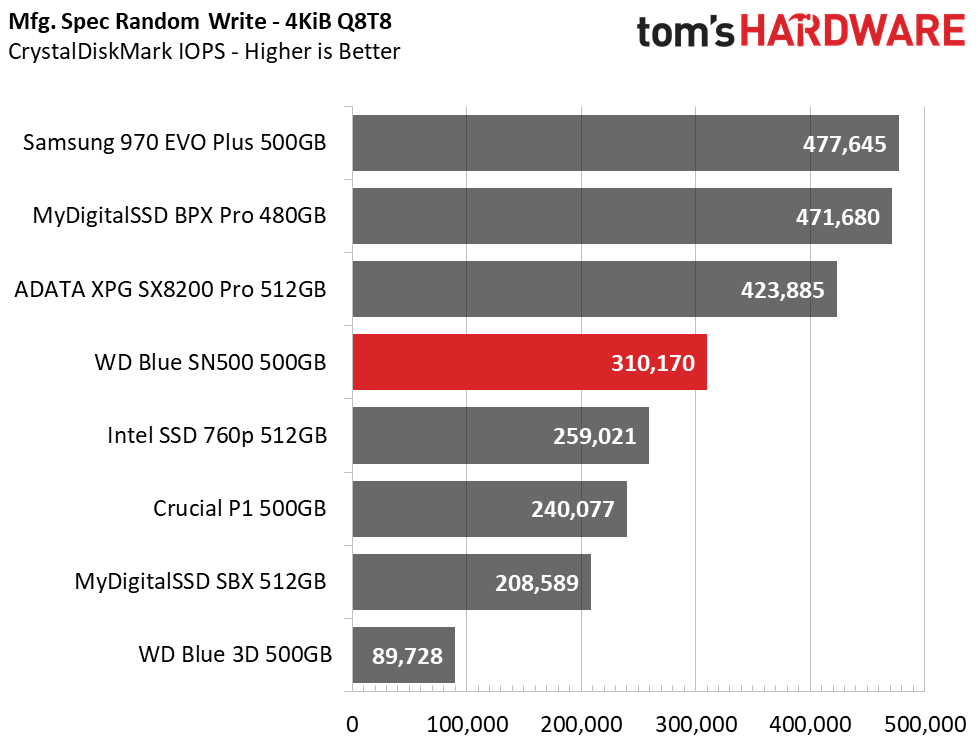
Also, random 4K performance hits nearly 280K/310K IOPS read/write at a QD of 64, though this number is basically meaningless to any desktop user. What really matters is its 4K performance at QD1. At this lower QD, the WD drive was able to deliver ~12.5K/40K IOPS read/write, ranking it sixth on our charts.
Sustained Sequential Write Performance
Official write specifications are only part of the performance picture. Most SSD makers implement an SLC cache buffer, which is a fast area of SLC-programmed flash that absorbs incoming data. Sustained write speeds can suffer tremendously once the workload spills outside of the SLC cache and into the "native" TLC or QLC flash. We hammer the SSDs with sequential writes for 15 minutes to measure both the size of the SLC buffer and performance after the buffer is saturated.
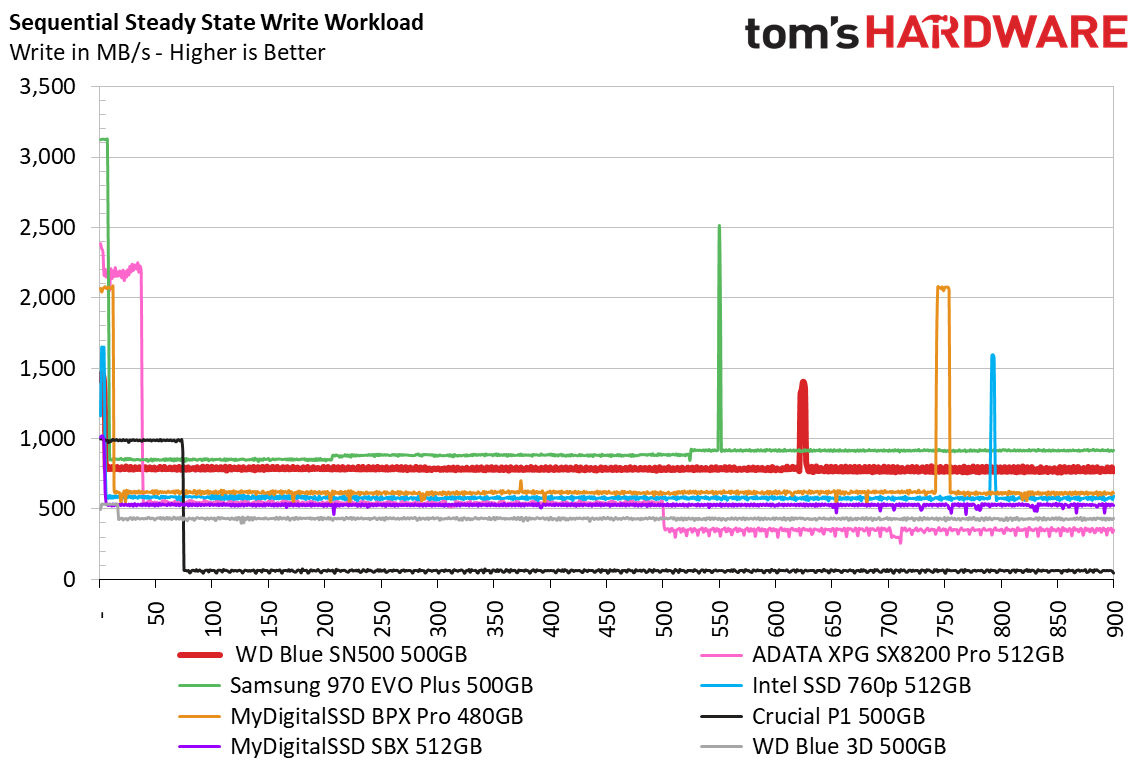
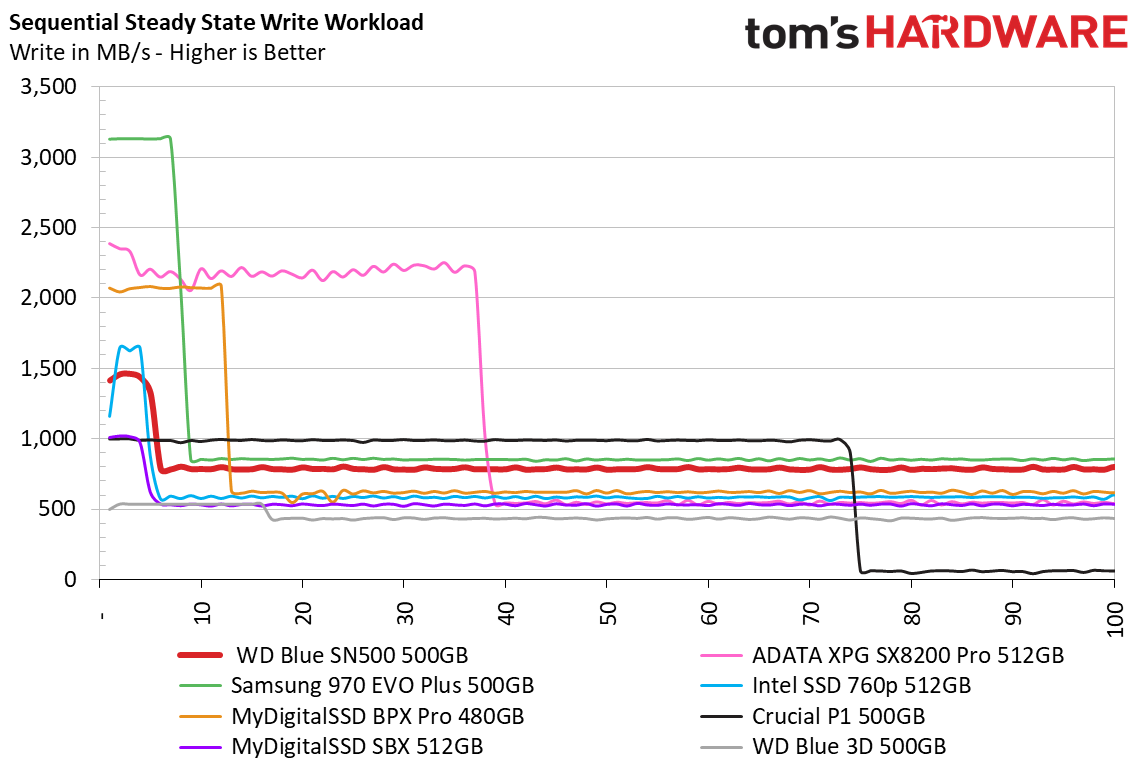
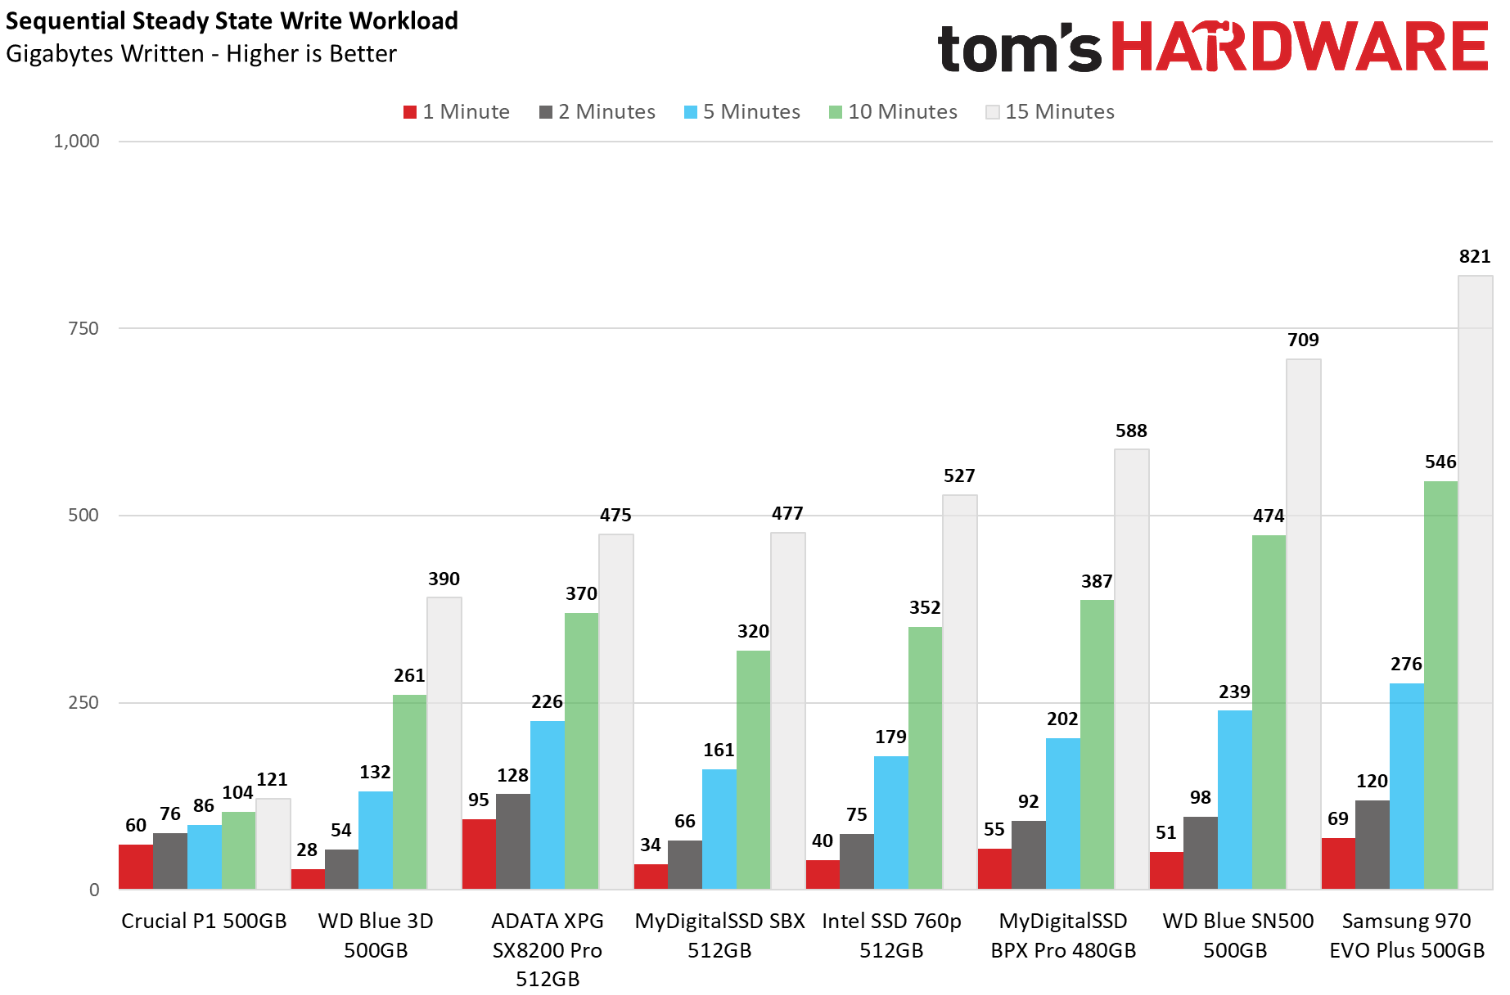
The 500GB WD Blue SN500 has an SLC cache that is about twice the size of the 250GB model. After writing about 7GB at a rate of 1.4GB/s, performance degrades to an average of 780MB/s. This is actually quite impressive and ranks it second overall after writing to it for 15 minutes straight.
Power Consumption
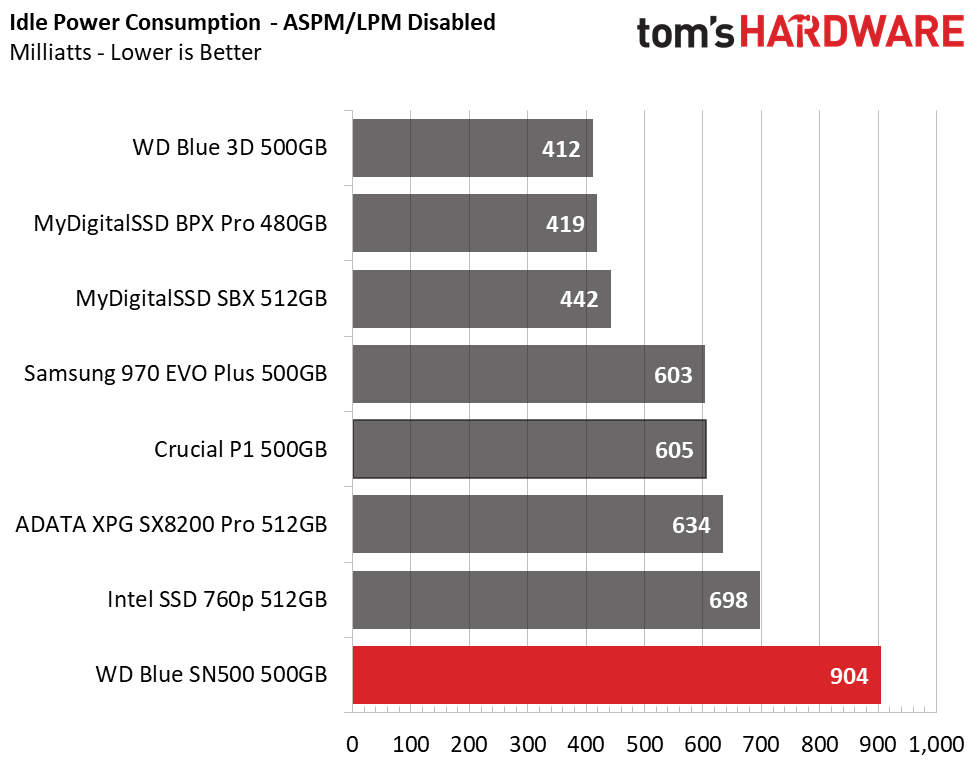
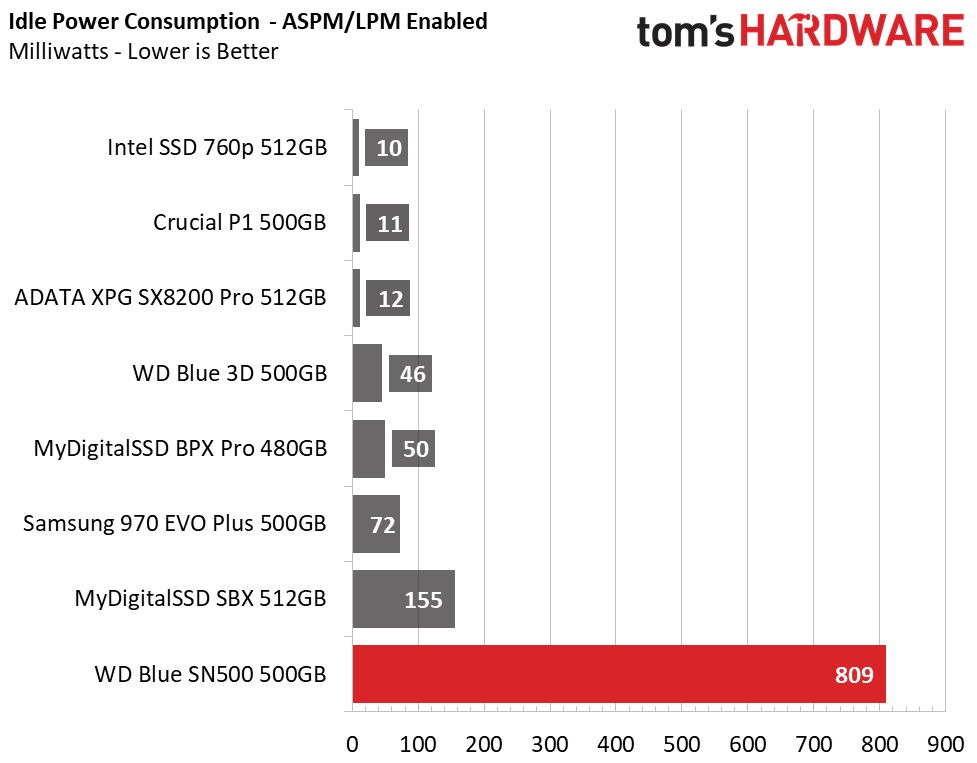
We use the Quarch HD Programmable Power Module to gain a deeper understanding of power characteristics. Idle power consumption is a very important aspect to consider, especially if you're looking for a new drive for your laptop. Some SSDs can consume watts of power at idle while better-suited ones sip just milliwatts. Average workload power consumption and max consumption are two other aspects of power consumption, but performance-per-watt is more important. A drive might consume more power during any given workload, but accomplishing a task faster allows the drive to drop into an idle state faster, which ultimately saves power.
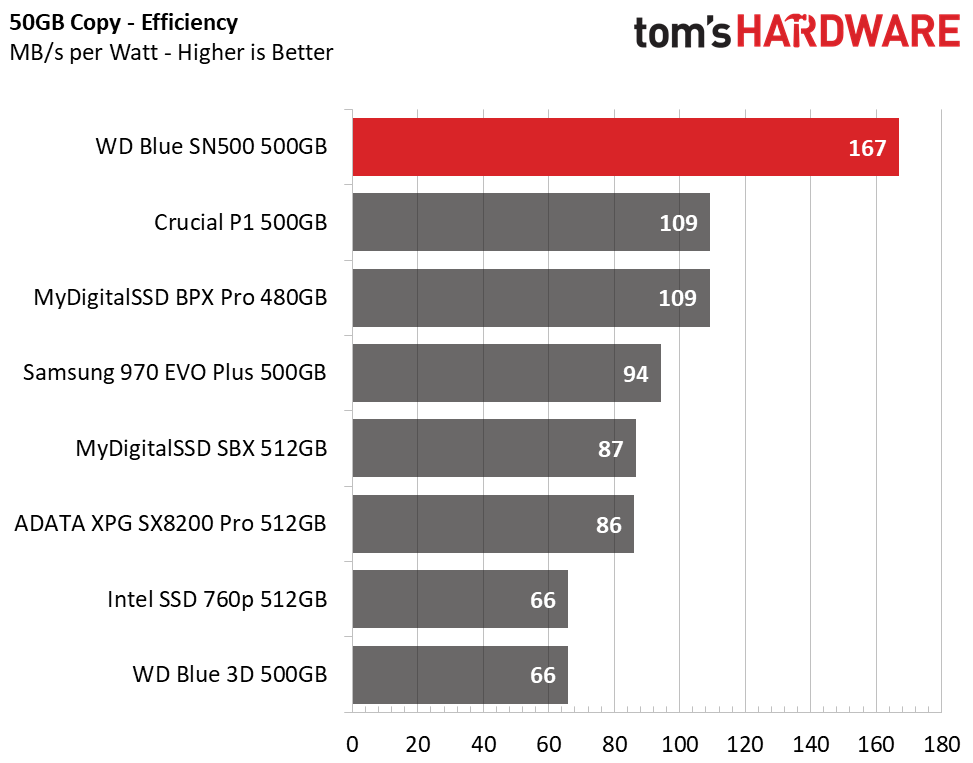
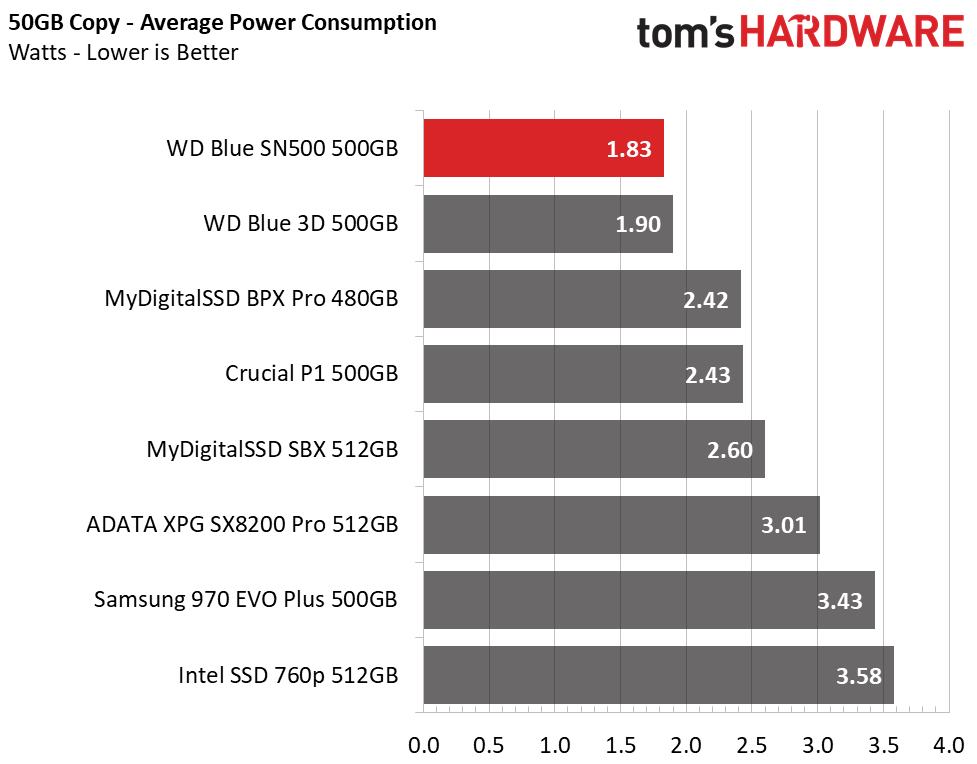
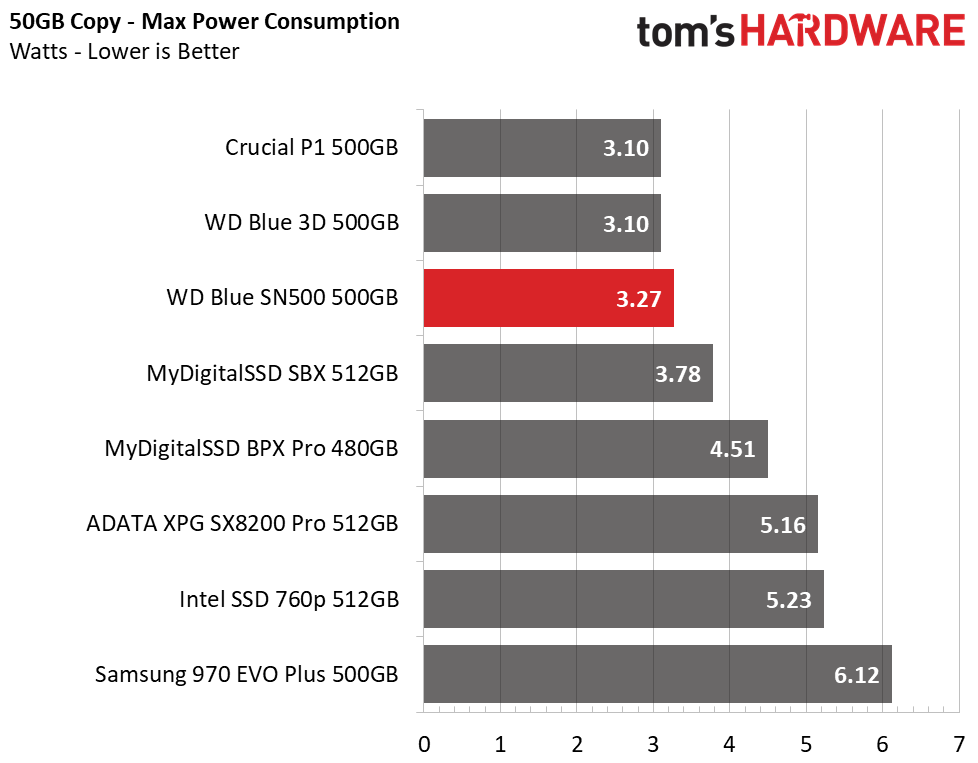
Average and max power consumption is well regulated here. During our 50GB file copy, the SN500 consumed a bit less than the WD Blue 3D SATA. But, with more bandwidth available to it, it consumed a bit more power under peak load. With its low average power consumption and high write performance, the 500GB WD Blue SN500 outperformed every other device on our efficiency comparison chart.
The only downside here seems to be some rather unoptimized idle power consumption. We are a bit disappointed to see just a 100mW variance between idle with ASPM disabled and enabled. Most other devices have the capability to drop down to 10-70mW while in their idle states.
MORE: Best SSDs
MORE: How We Test HDDs And SSDs
MORE: All SSD Content

Sean is a Contributing Editor at Tom’s Hardware US, covering storage hardware.
-
thuckabay Since when did Tom's Hardware start passing off advertisements and propaganda as "positive reviews?" This drive, which Tom's Hardware is recommending, is grossly expensive for its capacity, and for just a few dollars more, any bargain hunter can find a higher capacity 1TB drive that is vastly more performant. I have seen this patter over the course of multiple reviews from Tom's Hardware, particularly on SSD drives, and it has dramatically reduced Tom's Hardware's credibility for independent reviews. I no longer trust opinions from Tom's Hardware as a consequence.Reply -
USAFRet Grossly expensive?Reply
This WD Blue NVMe, 500GB
$65
https://www.amazon.com/Blue-SN500-250GB-NVMe-Internal/dp/B07P7TFKRH
Crucial MX500 SATA III, 500GB
$60
https://www.amazon.com/Crucial-MX500-NAND-2280SS-Internal/dp/B077SQ8J1V
Now...if you go for bottom of the barrel off brand SATA drives...sure, you can find them a lot cheaper.
Cheap, for a reason. -
thuckabay ReplyUSAFRet said:Grossly expensive?
This WD Blue NVMe, 500GB
$65
https://www.amazon.com/Blue-SN500-250GB-NVMe-Internal/dp/B07P7TFKRH
Crucial MX500 SATA III, 500GB
$60
https://www.amazon.com/Crucial-MX500-NAND-2280SS-Internal/dp/B077SQ8J1V
Now...if you go for bottom of the barrel off brand SATA drives...sure, you can find them a lot cheaper.
Cheap, for a reason.
Your comparison is INVALID. You are here attempting to equate a SATA SSD with an NVMe SSD, which is apples to oranges. There are vastly more performant 1TB NVMe SSDs than the WD Blue NVMe 500GB and for only a few dollars more; the WD Blue is a comparatively poor deal. -
USAFRet Reply
Specifically, which "1TB NVMe" drives are you referring to, that are "only a few dollars more" than this 500GB WD?thuckabay said:Your comparison is INVALID. You are here attempting to equate a SATA SSD with an NVMe SSD, which is apples to oranges. There are vastly more performant 1TB NVMe SSDs than the WD Blue NVMe 500GB and for only a few dollars more; the WD Blue is a comparatively poor deal.
Degree of Difficulty in your upcoming list - No bottom of the barrel junk drives. -
seanwebster Reply
Advertisements and propaganda? Where? Have you not seen the test data? Of course, I would recommend it. Have you not read other reviews of this drive? It isn't the best, but that doesn't mean it isn't any good. It delivers good performance (similar to competitors in most applications give or take), quality brand and support, and it is decently priced, even now months after the review...thuckabay said:Since when did Tom's Hardware start passing off advertisements and propaganda as "positive reviews?" This drive, which Tom's Hardware is recommending, is grossly expensive for its capacity, and for just a few dollars more, any bargain hunter can find a higher capacity 1TB drive that is vastly more performant. I have seen this patter over the course of multiple reviews from Tom's Hardware, particularly on SSD drives, and it has dramatically reduced Tom's Hardware's credibility for independent reviews. I no longer trust opinions from Tom's Hardware as a consequence.
What 1TB drive do you speak of that is faster for just dollars more than the 500GB WD Blue SN500. The market pricing is changing drastically monthly and sales don't count as current average market pricing, which should go without saying, I consider always.
Its not apples to oranges. Not all applications need high seq performance. Besides that, good SATA SSDs are nearly just as responsive in most office applications. Just look at the numbers...thuckabay said:Your comparison is INVALID. You are here attempting to equate a SATA SSD with an NVMe SSD, which is apples to oranges. There are vastly more performant 1TB NVMe SSDs than the WD Blue NVMe 500GB and for only a few dollars more; the WD Blue is a comparatively poor deal.
Please link that drive... I'm really curious. -
Ncogneto Replyseanwebster said:Advertisements and propaganda? Where? Have you not seen the test data? Of course, I would recommend it. Have you not read other reviews of this drive? It isn't the best, but that doesn't mean it isn't any good. It delivers good performance (similar to competitors in most applications give or take), quality brand and support, and it is decently priced, even now months after the review...
What 1TB drive do you speak of that is faster for just dollars more than the 500GB WD Blue SN500. The market pricing is changing drastically monthly and sales don't count as current average market pricing, which should go without saying, I consider always.
Its not apples to oranges. Not all applications need high seq performance. Besides that, good SATA SSDs are nearly just as responsive in most office applications. Just look at the numbers...
Please link that drive... I'm really curious.
I don't think you will ever get that link ;)
I would be curious to see how 2 of these perform in RAID, compared to a pricier 1 TB NVMe -
dmitche31958 Replythuckabay said:Since when did Tom's Hardware start passing off advertisements and propaganda as "positive reviews?" This drive, which Tom's Hardware is recommending, is grossly expensive for its capacity, and for just a few dollars more, any bargain hunter can find a higher capacity 1TB drive that is vastly more performant. I have seen this patter over the course of multiple reviews from Tom's Hardware, particularly on SSD drives, and it has dramatically reduced Tom's Hardware's credibility for independent reviews. I no longer trust opinions from Tom's Hardware as a consequence.
I question the rosy picture of this drive when it comes to the 50GB read/write. Those numbers for the 6GB read put the drive in 6th place behind the SSDs. That doesn't sound like a drive that I want to pay a premium for nor does it sound like "The end of the SSD drive" to me.
