From $100 To $160: Five Z68-Based Boards, Compared
Value-oriented system builders celebrate new-found performance and features as Intel continues pushing its mainstream platform towards the high-end. Today, we draw a line in the sand and consider five motherboards priced between $100 and $160.
Overclocking
| BIOS Frequency and Voltage settings (for overclocking) | |||||
|---|---|---|---|---|---|
| Row 0 - Cell 0 | ASRock Z68 Pro3 | Biostar TZ68A+ | Gigabyte Z68XP-UD3 | Intel DZ68DB | MSI Z68A-GD55 |
| CPU Base Clock | 95-110 MHz (0.1 MHz) | 100-300 MHz (1 MHz) | 80-200 MHz (0.1 MHz) | 100-300 MHz (1 MHz) | 38-282 MHz (0.1 MHz) |
| CPU Multiplier | Up to 60x | Up to 100x | Up to 59x | Up to 255x | Up to 60x |
| DRAM Data Rates | 1066-2133 (266.6 MHz) | 1066-2133 (266.6 MHz) | 800-2400 (266.6 MHz) | 1066-2133 (266.6 MHz) | 800-2133 (266.6 MHz) |
| CPU Vcore | 0.723-1.52 V (5 mV) | 1.00-1.79 V (10 mV) | 0.75-1.70 V (5 mV) | 1.00-1.35 V (12.5 mV) | 0.80-1.80 V (5 mV) |
| VTT Voltage | 0.77-1.63 V (9 mV) | 1.05-1.70 V (12.5 mV) | 0.86-1.53 V (5 mV) | Not Adjustable | 0.95-1.55 V (20 mV) |
| PCH Voltage | 0.78-1.65 V (9 mV) | 1.05-1.20 V (50 mV) | Not Adjustable | Not Adjustable | 0.78-1.72 V (5 mV) |
| DRAM Voltage | 1.20-1.80 V (14 mV) | 1.30-2.20 V (12.5 mV) | 0.89-2.14 V (5 mV) | 1.20-1.80 V (50 mV) | 1.11-2.46 V (7.25 mV) |
| CAS Latency | 5-15 Cycles | 3-15 Cycles | 5-15 Cycles | 5-12 Cycles | 5-15 Cycles |
| tRCD | 4-15 Cycles | 3-15 Cycles | 1-15 Cycles | 5-16 Cycles | 4-15 Cycles |
| tRP | 4-15 Cycles | 3-15 Cycles | 1-15 Cycles | 5-16 Cycles | 4-15 Cycles |
| tRAS | 10-40 Cycles | 9-63 Cycles | 1-40 Cycles | 15-75 Cycles | 10-40 Cycles |
All of today’s motherboards offer a wide enough range of voltage and frequency settings to satisfy the majority of semi-serious overclockers, yet no motherboard in this price comes with a voltage regulator we'd feel comfortable taking into an overclocking competition. Differences in trace layout also affect signal strength between devices, setting us up for an interesting overclocking comparison.
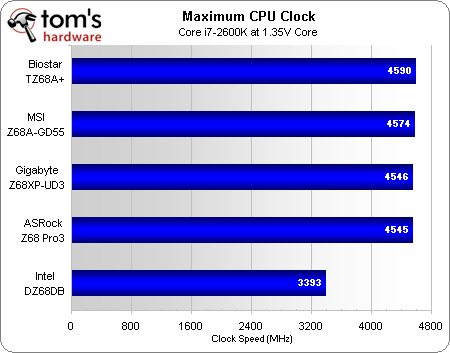
The chart does not tell the whole story in today’s CPU overclocking chart. Intel actually had the highest stable CPU clock, but it eventually throttled back down to its stock 3.4 GHz frequency after a few minutes of load. This unfortunately took the board with the best CPU stability out of the running in the overclocking comparison. We tried lower voltage, but all that did was delay the onset of the same symptoms. This test was done with maximum power and thermal limits set in the BIOS, of course.
Thus, with the same low price as Intel, Biostar’s reduced-feature overclocking motherboard wins.
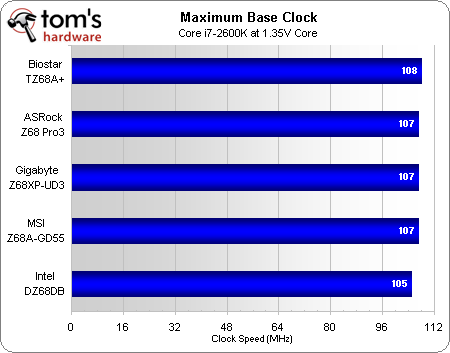
Biostar also has the highest base clock, though this is primarily a restriction of our CPU. We have no idea why the DZ68DB could push our processor’s normal 107 MHz limit, but more conservative settings are better for preserving hardware, and when it comes to longevity in a daily use machine, we err on the side of long-term health.
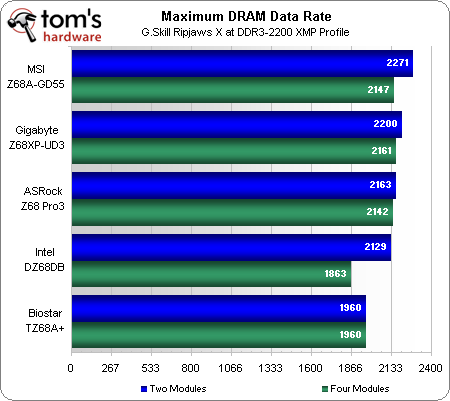
MSI tops our memory overclocking chart with a superb data rate. Biostar sits at the bottom because it wasn’t completely stable at 2129 MT/s and didn’t support BCLK underclocking to assess its capabilities at the same high multiplier.
Get Tom's Hardware's best news and in-depth reviews, straight to your inbox.
Current page: Overclocking
Prev Page Benchmark Results: Productivity Next Page Power, Heat, And Efficiency-
compton I temporarily used a Biostar TH67+ 1155 mobo until I picked up my new board. After seeing the description of the Z chipset's Graphical UEFI I checked Biostar's website. It looks as though they're released the graphical UEFI for all biostar 1155 mobos.Reply
Now I just wish Intel would do the same -- can't they just rip off Asus's UEFI implementation? -
johnnyb_27 Why not use the MSI's Z68A-G65 instead of the MSI's Z68A-G55? They were the same price but now the drop MSI's Z68A-GD55 to 154 before rebate.Reply -
hatethisbull 90% of this article could've been compressed into the summary page. I would've preferred to see comparisons between, say, a $70 h67 and a high-end z68. Instead of four pages of unsatisfying gaming benchmarks, how about focusing on board usability? Which of the boards have cheap PCI-E retention clips that are going to pop off on first use? Which ones will have blocked ports, etc.Reply -
The Greater Good vilenjanWhat about looks? The gigabyte board looks so meh, while the MSI board is sexy!Reply
Do you stare into your case whilst computing, or do you look at the monitor? -
aznguy0028 The Greater GoodDo you stare into your case whilst computing, or do you look at the monitor?I look into my case daily when I use the computer. There's a reason why there is a window, and hours of hard work for your perfect wiring job deserves much credit and to be stared at. Not to mention coloring schemes that matches your case/mobo pcb color/fan led colors/etc.Reply -
Crashman johnnyb_27Why not use the MSI's Z68A-G65 instead of the MSI's Z68A-G55? They were the same price but now the drop MSI's Z68A-GD55 to 154 before rebate.MSI picked the GD55 because it's SUPPOSED to cost $160. MSI did NOT pick the GD65 because it's SUPPOSED to cost $180. MSI's predictions from a few weeks back simply didn't pan out.Reply -
Crashman jerreddreddisn't it time we lost the PS2 port? and maybe even the DB15 VGA port also?Not PS/2, just VGA. They leave the Multi-I/O controller on the board for compatibility in other areas, so PS/2 is "free" and some people still use it at the high end.Reply
Some cheap monitors still use VGA, but these boards are not for the budget market! For VGA compatibility (for external capture devices and such) they could just use DVI-I and let the oddball user who needs VGA for that oddball purpose supply his own adapter.


