Six SSD DC S3500 Drives And Intel's RST: Performance In RAID, Tested
Intel lent us six SSD DC S3500 drives with its home-brewed 6 Gb/s SATA controller inside. We match them up to the Z87/C226 chipset's six corresponding ports, a handful of software-based RAID modes, and two operating systems to test their performance.
Results: JBOD Performance
The first thing we want to establish is how fast these SSDs are, all together, in a best-case scenario? To that end, we'll test the SSDs in a JBOD (or "just a bunch of disks") configuration, exposing them to the operating system as individual units. In this case, we're using the C226 WS's six PCH-based SATA 6Gb/s ports. Then we test each drive in Iometer independently by using one worker per SSD. In this way, we catch a glimpse of maximum performance in RAID, without the losses attributable to processing overhead.
That's all well and good, but what do we actually learn? We basically establish a baseline. Do we hit a ceiling imposed by the platform's DMI? Does this limit sequential throughput or random I/Os? This is the optimal performance scenario, and it lets us frame our discussion of RAID across the next several pages.
Sequential Performance
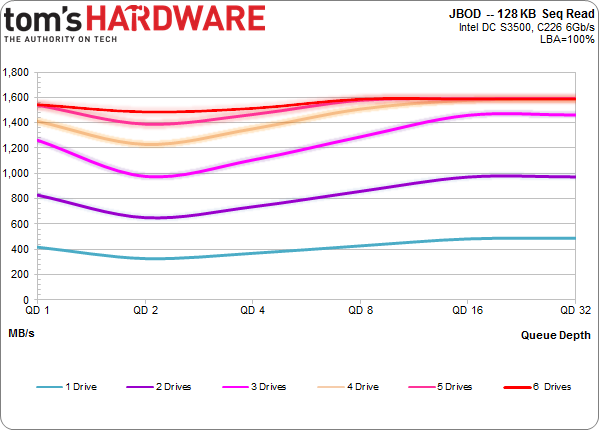
Right off the bat we see that the C226's DMI link restricts the amount of throughput we can cram through the chipset. In theory, each second-gen PCIe lane is good for about 500 MB/s. Practically, that number is always lower.
With that in mind, have a look at our bottleneck. With one, two, and three drives loaded simultaneously, we see the scaling we expect, which is a little less than 500 MB/s on average. Then we get to four, five, and six drives, where we hit a roof. That's right around 1600 MB/s for reads. Really, we weren't expecting much more, given a peak 2 GB/s of bandwidth on paper.
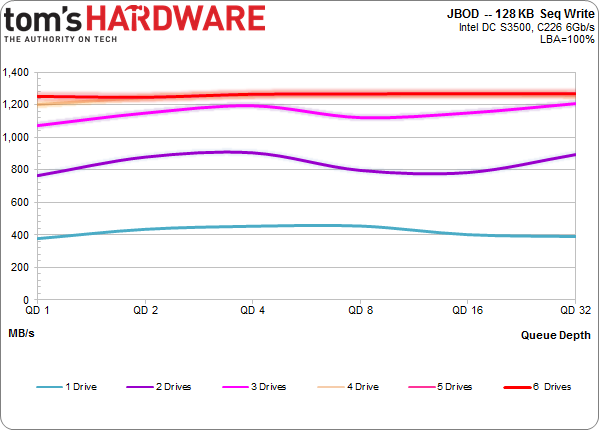
The write results are similar, though the ceiling drops even lower. With four, five, and six drives churning at the same time, we get just over 1200 MB/s. Fortunately, most usage scenarios don't call for super-high sequential performance (even our FCAT testing only requires about 500 MB/s for capturing a lossless stream of video at 2560x1440).
Random Performance
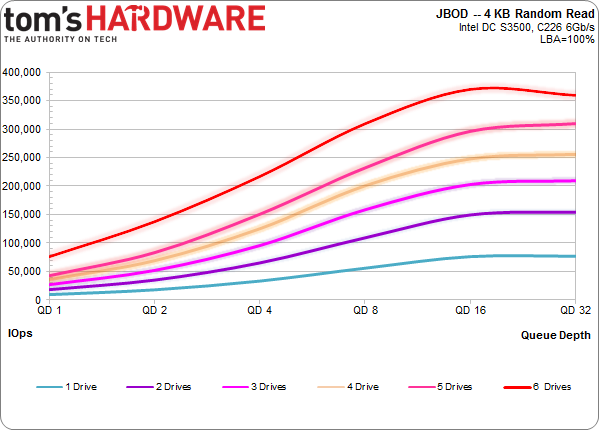
A shift to random 4 KB performance is informative, involving more more transactions per second and less bandwidth. One hundred thousand 4 KB IOPS translates into 409.6 MB/s. So, when total bandwidth is limited (as it is today), we won't necessarily take it in the shorts when we start testing smaller, random accesses. Put differently, 1.6 GB/s worth of read bandwidth is a lot of 4 KB IOPS.
Sure enough, benchmarking each S3500 individually demonstrates really decent performance. With a single drive, we get up to 77,000 read IOPS with this particular setup. It's still apparent that the scaling isn't perfect, though. If one SSD gives us 77,000 IOPS, six should yield 460,000. Even still, performance still falls in the realm of awesome as six drives enable 370,000 IOPS.
Get Tom's Hardware's best news and in-depth reviews, straight to your inbox.
But wait. Remember when I said that we shouldn't be throughput-limited during our random I/O testing? I lied. When you do the math, 370,000 IOPS is more than 1.5 GB/s. So, it's probable that more available bandwidth would yield even better numbers.
Other factors are naturally at work, too. It takes a lot of processing power to load up six SSDs the way we're testing them. Each drive has one thread dedicated to generating its workload, and with six drives we're utilizing 70% of our Xeon E3-1285 v3 to lay down the I/O. The CPU only has four physical cores though, so there could be scheduling issues in play as well. Regardless, the most plausible explanation is that the chipset's DMI is too narrow for our collection of drives running all-out.
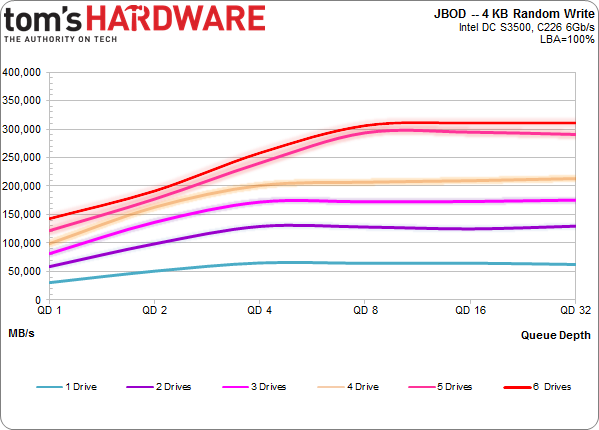
Moving on to 4 KB random writes, we get more of the same. One 480 GB SSD DC S3500 gives us a bit more than 65,500 IOPS. All six running alongside each other push more than 311,000 IOPS.
We now have some important figures that'll affect the conclusions we draw through the rest of our testing, and there are definitely applications where this setup makes sense. If you're building a NAS using ZFS, where each drive is presented individually to the operating system, this is an important way to look at aggregate performance. Of course, in that environment, it'd be smarter to use mechanical storage. Our purpose is to tease out the upper bounds of what's possible. Let's move on to the RAID arrays.
Current page: Results: JBOD Performance
Prev Page Intel Rapid Storage Technology Gets More Useful With RAID Next Page Results: RAID 0 Performance-
SteelCity1981 "we settled on Windows 7 though. As of right now, I/O performance doesn't look as good in the latest builds of Windows."Reply
Ha. Good ol Windows 7... -
vertexx In your follow-up, it would really be interesting to see Linux Software RAID vs. On-Board vs. RAID controller.Reply -
tripleX Wow, some of those graphs are unintelligible. Did anyone even read this article? Surely more would complain if they did.Reply -
utomo There is Huge market on Tablet. to Use SSD in near future. the SSD must be cheap to catch this huge market.Reply -
tripleX Wow, some of those graphs are unintelligible. Did anyone even read this article? Surely more would complain if they did.Reply -
tripleX Wow, some of those graphs are unintelligible. Did anyone even read this article? Surely more would complain if they did.Reply -
klimax "You also have more efficient I/O schedulers (and more options for configuring them)." Unproven assertion. (BTW: Comparison should have been against Server edition - different configuration for schedulers and some other parameters are different too)Reply
As for 8.1, you should have by now full release. (Or you don't have TechNet or other access?) -
rwinches " The RAID 5 option facilitates data protection as well, but makes more efficient use of capacity by reserving one drive for parity information."Reply
RAID 5 has distributed parity across all member drives. Doh!


