Choosing the best thermal paste may sound simple, but a dizzying array of options can turn this seemingly easy choice into a time-consuming and confusing task. We tested 37 different thermal compounds with AMD’s Ryzen 9 9950X and over 90 thermal compounds with Intel Core i9 CPUs to help you find the best one to help cool your CPU.
Thermal paste is designed to minimize microscopic air gaps and irregularities between the surface of the cooler and the CPU's IHS (integrated heat spreader), the piece of metal built into the top of the processor, to transfer heat to the CPU cooler.

Thermal paste can go by many names, such as "thermal compound," "thermal grease," or "TIM" (Thermal Interface Material), but they all have the same purpose — to help keep your chip cool by ensuring that heat passes efficiently from the CPU to the cooler.
Most pastes are made of ceramic or metallic materials suspended within a proprietary binder, allowing for easy application and spread and simple cleanup. Depending on their specific formula, these thermal pastes can be electrically conductive or non-conductive. Electrically conductive thermal pastes can carry electricity between two points, meaning that if the paste squeezes out onto other components, it can cause damage to motherboards and CPUs when you switch on the power. A single drop out of place can lead to a dead PC, so extra care is imperative.
Liquid metal compounds are almost always electrically conductive, so while these compounds perform better than their paste counterparts, they require more focus and attention during application. They are very hard to remove if you get some in the wrong place, which would fry your system.
In contrast, traditional thermal paste compounds are relatively simple for every experience level. Most, but not all, traditional pastes are electrically non-conductive.
We’ve also tested Phase Change compounds. These types of products begin as a solid, and are installed in the same manner as a thermal pad. However, once exposed to heat and pressure, they liquify. The primary downside to this type of material is that it can have a longer burn-in time, and it may not perform as well as pastes in lower power scenarios.
Even though a dizzying array of different thermal pastes is available — some blends have been around for over a decade — new formulations still come to market at a surprising pace. Our testing includes many newly released thermal compounds, as well as tried and true brands of thermal paste.
Lastly, we’ve also tested thermal pads and sheets. These pads can be used as TIM and come as a single sheet you simply apply to your heatsink, but they’re not all made the same. There are some rather interesting non-traditional thermal pads that have entered the market recently, like Thermal Grizzly’s Kryosheet, which is made of graphene rather than the silicone-based pads typically used.
Here are the best thermal pastes, along with our complete test results. Remember that you don't always get what you pay for, as some budget pastes come awfully close to or overtake their more expensive competitors.
Best Thermal Paste for CPUs You Can Buy
Why you can trust Tom's Hardware Our expert reviewers spend hours testing and comparing products and services so you can choose the best for you. Find out more about how we test.
Best Premium Paste
Best Premium Paste

Thermal Grizzly’s Duronaut is the best performing thermal paste we’ve tested, hands down. In addition to its excellent thermal performance, it is designed specifically for long-term stability. Its only downside is that it is more expensive than competitors - but that’s worth spending a few extra bucks!
Runner Up: Best Premium Paste
Runner Up: Best Premium Paste

Arctic’s MX-6 is a favorite among PC enthusiasts, and it's easy to see why, given its excellent thermal results - currently holding the 2nd best spot for traditional thermal pastes in our benchmarks.
Best Premium (Standard) Thermal Paste
Best Premium (Standard) Thermal Paste

ID-Cooling’s Frost X45 is the best-performing thermal paste we’ve tested on our air cooling system, hands down. It’s available for only $6.99 on Amazon, so it’s the hands-down winner if you’re focused on value.
Runner Up: Best Premium (Standard) Paste
Runner Up: Best Premium (Standard) Paste

While many of Noctua’s products carry premium price tags, like the NH-D15 G2 Air Cooler, when it comes to thermal pastes, Noctua’s NT-H2 carries a relatively “budget” price tag of only $12.95 for a 3.5G tube that also includes three cleaning wipes.
Best Premium Thermal Pad
Best Premium Thermal Pad

Thermal Grizzly’s Kryosheet has - thus far - been the best thermal pad we’ve tested. Not only that, but in our testing on AMD’s Ryzen 9 9950X it outperformed all traditional thermal pastes. Its only downside is that it is more expensive than most pastes, but it has the advantage of being reusable.
Runner Up: Best Premium Thermal Pad
Runner Up: Best Premium

Thermal Grizzly’s PhaseSheet is a PTM-type phase change compound - a solid which melts under high pressure. This has the advantage of being reusable. Don’t be alarmed if your CPU reaches peak temperature when you’ve first applied this product. The downside of PTM is that it requires extensive burn-in time with multiple cycles before it performs at optimal levels.
Best Liquid Metal Thermal Paste
Best Liquid Metal Thermal Paste

Alphacool’s Eisfrost Extreme was the best-performing liquid metal we’ve tested, outperforming competitors by a significant (for liquid metal) 0.5C degrees! If you’re looking for the best performance on the market, bar none, you’ll want to pick up Eisfrost Extreme.
Runner Up: Best Liquid Metal Thermal Paste
Runner Up: Best Liquid Metal Thermal Paste

BeQuiet’s DC2 Pro is on par with Thermal Grizzly’s Conductonaut overall but is available for much less. As with all liquid metal compounds, extra care will be needed during installation due to electrical conductivity.
Thermal Paste Performance Rankings
Thermal Paste Performance Rankings
Here's a breakdown of our recent testing, and we'll be adding new pastes to this list over the coming weeks and months. A bit further down, you'll find our original rounds of testing with 85 different pastes tested in 2017 and 90 pastes tested in 2022, some of which we've revisited in this new performance hierarchy. That should give you a good idea of how other pastes that we haven't retested yet would compare to the newer pastes.
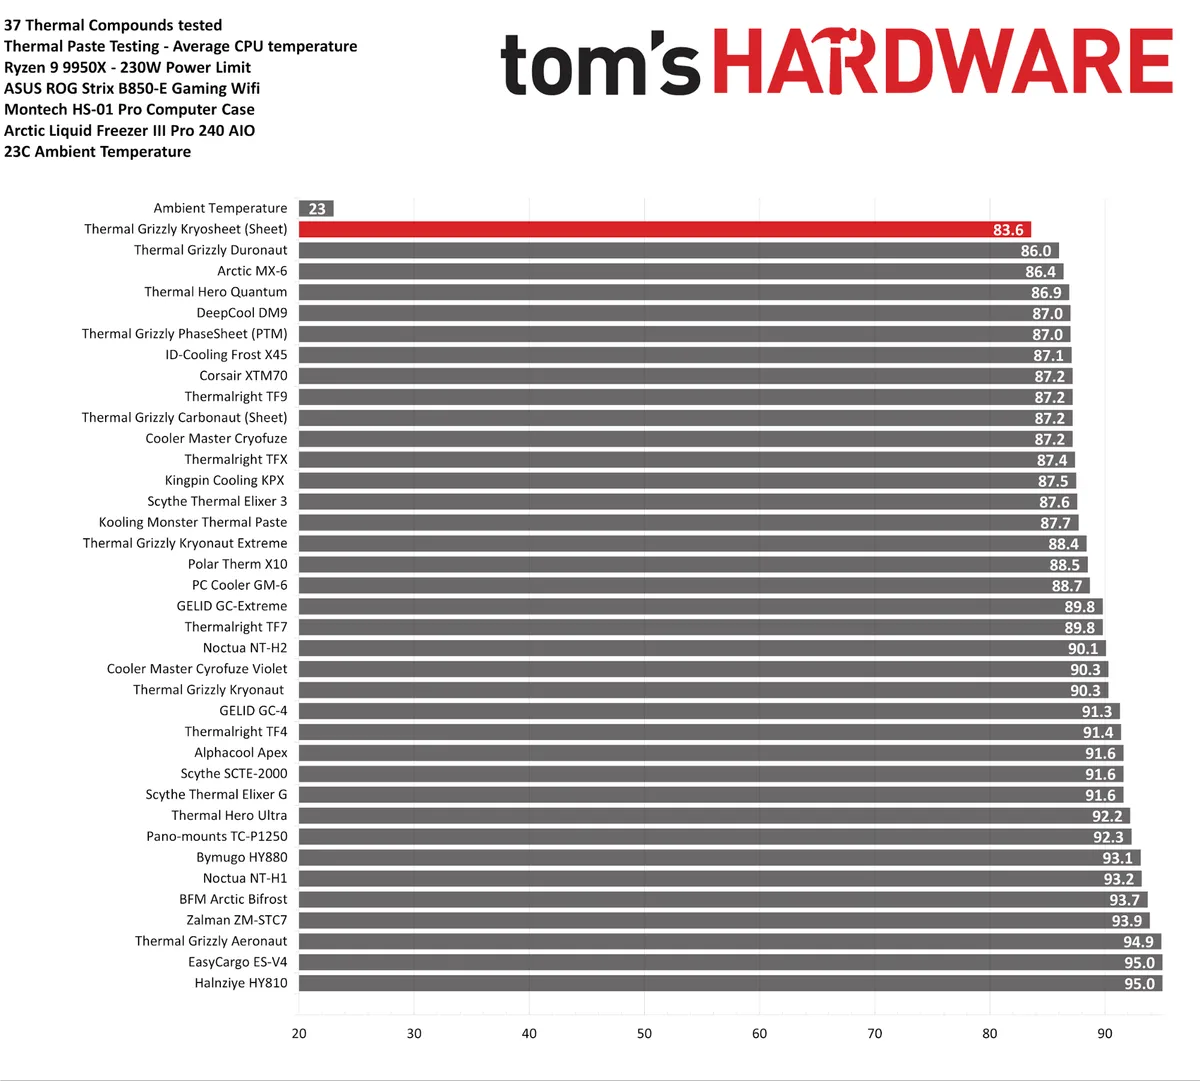
First up, here’s our newest testing with 37 pastes on the Ryzen 9 9950X test system. You can expect this list to grow to include all of our pastes.
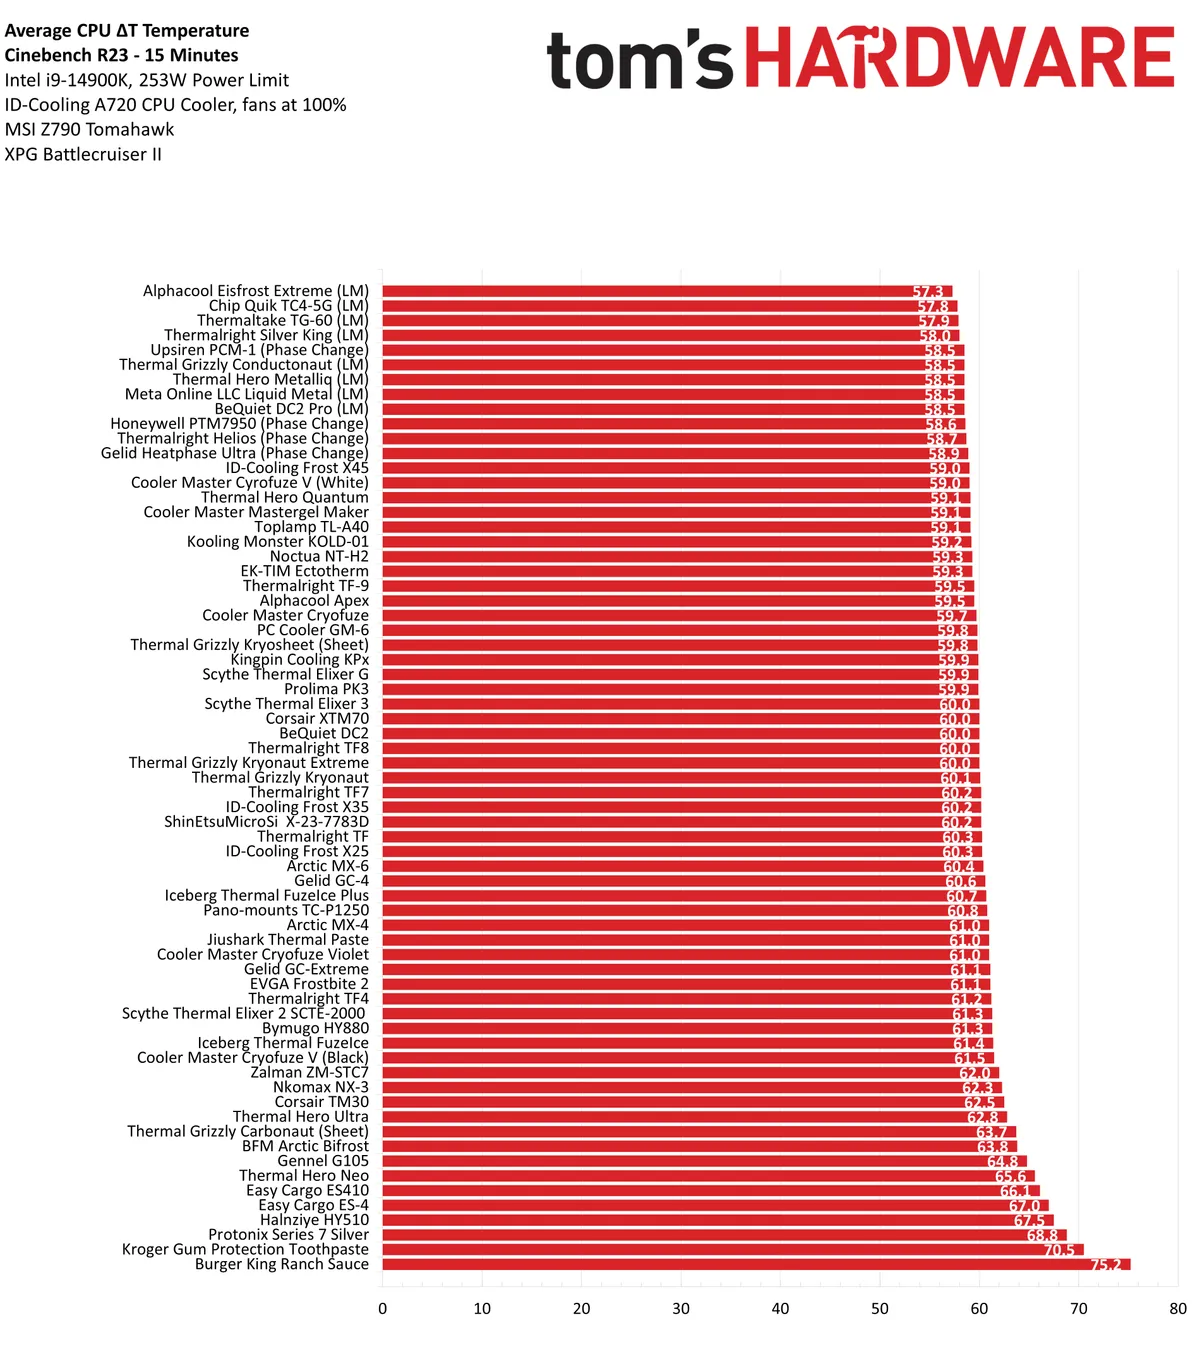

Here’s our testing of 90 different pastes from earlier this year with the Core i9-14900K system. We tested these pastes with both air and liquid cooling, but we’re moving forward with the simplified AIO-cooling test methodology used in the prior results. We’ll retire this down to our archives at the bottom of this article once our new test system has a sufficient number of results.
Thermal Paste Test Results
Thermal Paste Test Results
▶️ Key Takeaways
Thermal compounds might always be compared and debated over, but the simple fact remains: PC system building needs thermal compounds to effectively dissipate thermal loads. Without them, our beloved gaming and content-producing machines would struggle to keep components cool during heated frag sessions, heavy workstation computations, or just simply browsing the web.
Not every system will need the most expensive compound, so even the most budget-minded system builders can rest easy knowing that even lower-cost pastes can still prove very effective. You can see our historical testing results with far more pastes after the test setup.
Test System Configuration and Testing Methods
Test System Configuration and Testing Methods
CPU | |
Motherboard | Asus ROG STRIX B850-E Gaming Wifi |
Cooling | |
Chassis | |
Fan Control | PWM at 100% |
For our thermal compound tests, I used the same hardware and configuration for each and every test to minimize environment variables in our testing. Some of these components were sampled by vendors, without whom this testing wouldn’t be possible. We’re using Ryzen 9 9950X paired with Arctic’s Liquid Freezer III Pro AIO and an ASUS ROG Strix B850-E Gaming Wifi motherboard. We’d like to take a quick moment to thank our partners at MSI, Arctic, ASUS, and AMD for sampling the components used for this testing.

While most thermal compounds scale similarly with AMD and Intel CPUs, I feel I should point out there were a few notable exceptions to this rule: the most impressive being Thermal Grizzly’s Kryosheet, which outperformed all traditional thermal pastes on our AMD Ryzen 9950X.
Each compound is properly burned in before testing, with a burn-in period appropriate to the compound being tested. Most paste applications are burned in with 30 minutes of Cinebench R23 Multi-core testing, split between two 15-minute tests with a cool-down period afterward. There are some exceptions to this rule. With phase change materials like Honeywell’s PTM7950, I ran Cinebench for four or more 30-minute tests with cool-down periods in between. With Liquid Metal (LM) materials, only a single burn-in test for 15 minutes was needed, as LM doesn’t really require a burn-in period at all.
To test each thermal compound, I ran Cinebench R23’s multi-core stress test for 15 minutes after each compound had been burned in. This is a long enough thermal load that most pastes will reach their maximum temperature by the end of the benchmark. I measured the average temperature of the CPU during testing to demonstrate the effectiveness of a thermal compound.
The reason I use the average temperature instead of the peak temperature is consistency: I observed more variation with peak temperature results than I was comfortable with, but the average temperature results recorded were very consistent.
Excluding results that were thrown out and retested with a different tube of thermal paste, most verification results had a variance of no more than 0.3C. I’d prefer to reduce that variance to 0.1C or less - but there’s only so much one can do to eliminate variance without having an expensive custom testing lab.
There are a lot of factors that can impact the performance of a paste. How you apply Thermal Paste and mount your cooler are the two biggest factors, but there can also be variations in the quality of different tubes of the same brand and model of thermal paste. We have retested results to ensure accuracy, but we can’t account for all potential variances in product quality. That said, if testing results from one tube were worse than expected, another tube was obtained.
Legacy Thermal Paste Testing
Legacy Thermal Paste Testing - 90 Pastes Tested
Here's our legacy thermal paste testing chart that we generated back in 2022. As you'll notice, many of the same popular pastes in 2022 are still on the market, making it into our new round of testing.
We do have new testing equipment for our updated tests, such as a more modern CPU, motherboard, and coolers for our tests - and we use a different stress test. That means these tests are not quite comparable to our legacy results.
We'll be adding more thermal pastes to our new hierarchy; stay tuned.
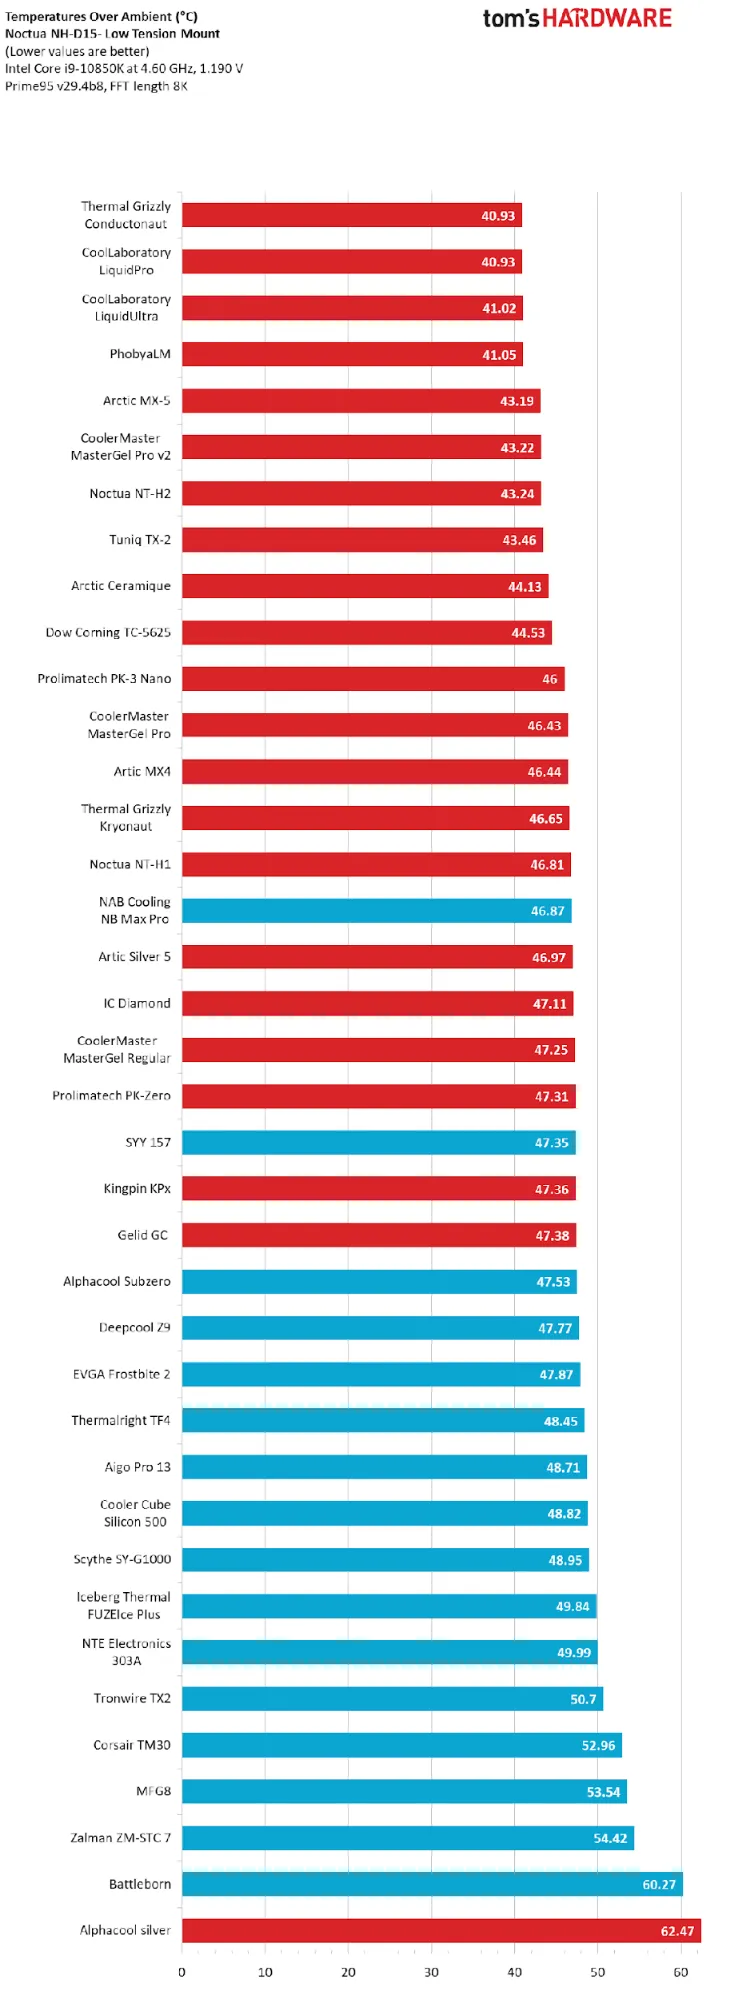
▶️ Best Thermal Paste 2017 Legacy Benchmark Results


▶️ Best Thermal Paste 2022 Legacy Benchmark Results