AMD Radeon VII 16GB Review: A Surprise Attack on GeForce RTX 2080
AMD is first to market with a 7nm gaming GPU. The company complements its Vega 20 processor with 16GB of HBM2 on a 4,096-bit bus, packing it all into a 300W Radeon VII graphics card. Should those numbers impress you? Yeah, actually, they should.
Why you can trust Tom's Hardware
Temperatures and Clock Rates
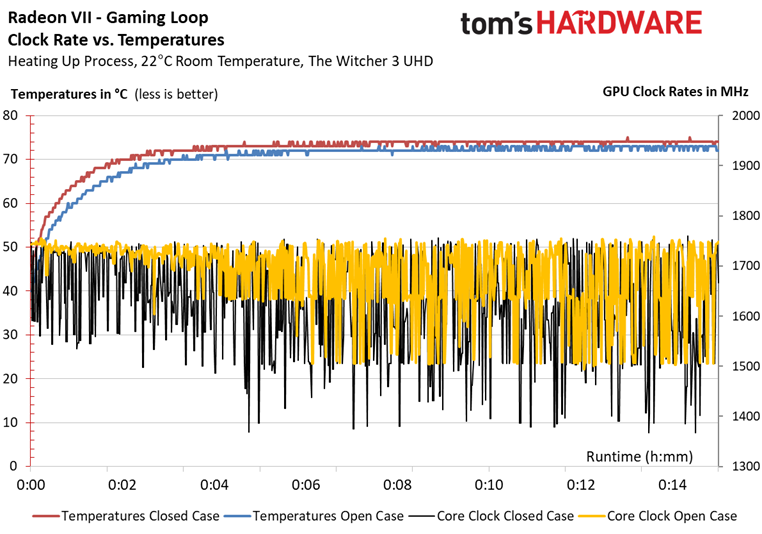
Remember that there are two representations of temperature in play here: edge, or GPU temperature, and junction temperature. In the measurements below, reported as GPU temperature, Vega 20 appears to operate coolly, even though we know the junction temperature AMD uses to control thermal throttling and fan control is quite a bit higher.
Temperatures do rise faster in the closed case and settle about 2°C higher than an open test bench. This isn't too painful at first. After all, AMD's throttling mechanism works differently from Nvidia's, where whole GPU Boost steps are lost as temperature increases.
As our test progresses and Vega 20 warms up, we see that Radeon VII starts switching back and forth between ~1500 MHz and 1740 MHz on the open bench. The jumps progressively become larger and more frequent as the temperature rises. In a closed case, the changes in frequency also seem to be dependent on the rate at which temperature changes. The card even sporadically drops to 1367 MHz!
Since fan speeds and temperatures are held within a very strict limit, clock rates are carefully balanced every step of the way. This behavior is very different from what we've seen from AMD's Radeon RX Vega and Nvidia's GeForce cards. In fact, we haven't seen such severe clock rate fluctuations from any other graphics card.
From what we can tell, Radeon VII doesn't really have a fixed boost frequency. So, you have to distinguish between peak, minimum, and average clock rates. Programs like WattMan and 3DMark reflect maximum values. But the practical relevance of those numbers is debatable. In order to make reliable observations about Radeon VII's boost clock, you need to record several seconds and calculate an average from them.
Let's again draw a comparison between Radeon VII and GeForce RTX 2080 Founders Edition using our benchmark results:
| Header Cell - Column 0 | Radeon VII Initial Value | Radeon VII End Value | GeForce RTX 2080 End Value |
|---|---|---|---|
| Open Test Bench | |||
| GPU Temperature | 34°C | 73°C | 75°C |
| GPU Clock Rate | 1,758 MHz | 1,498 to 1,741 MHz (Alternating) | 1,815 MHz |
| Ambient Air Temperature | 22°C | 22°C | 22°C |
| Closed Case | |||
| GPU Temperature | 36°C | 75°C | 75°C |
| GPU Clock Rate | 1,755 MHz | 1,367 to 1,747 MHz (Alternating) | 1,800 MHz |
| Ambient Air Temperature | 23°C | 46°C | 43°C |
Board Analysis: Infrared Images
Get Tom's Hardware's best news and in-depth reviews, straight to your inbox.
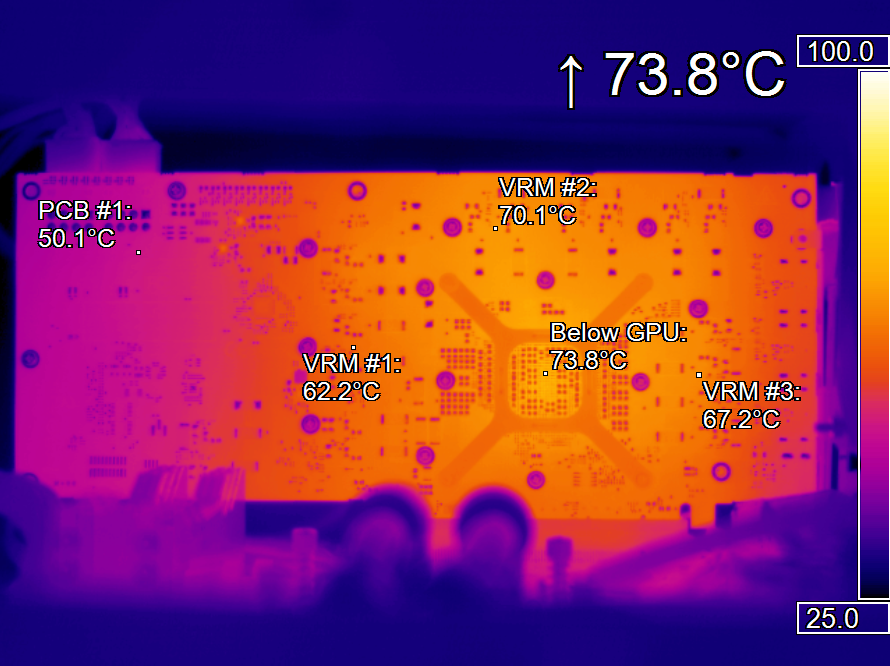
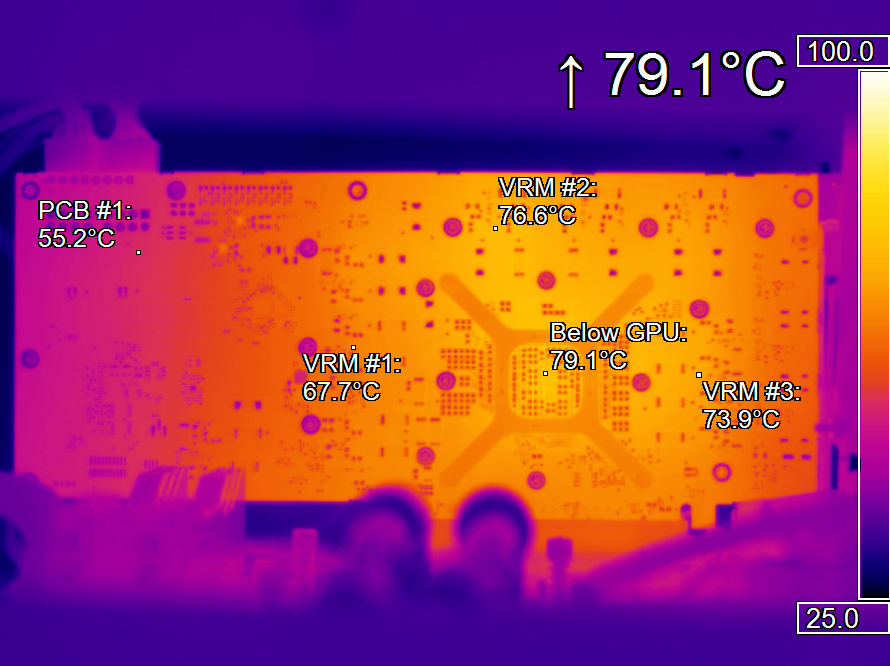
We brushed the board with a special lacquer before collecting measurements, and calibrated the system with thermal sensors at four unique reference points. The homogeneous coating gives us a known emissivity of 0.975, and we take readings at an angle of 90 degrees.
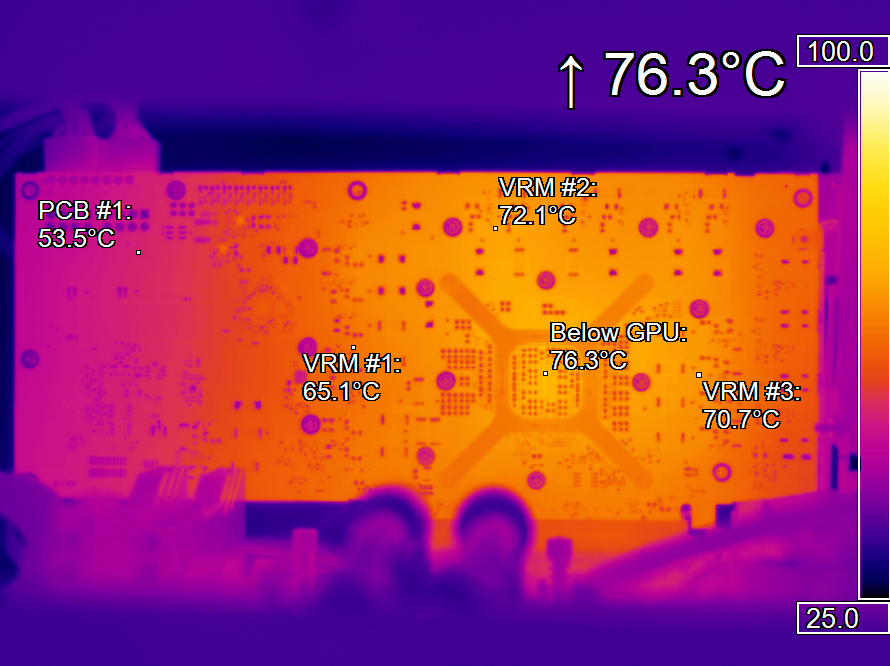
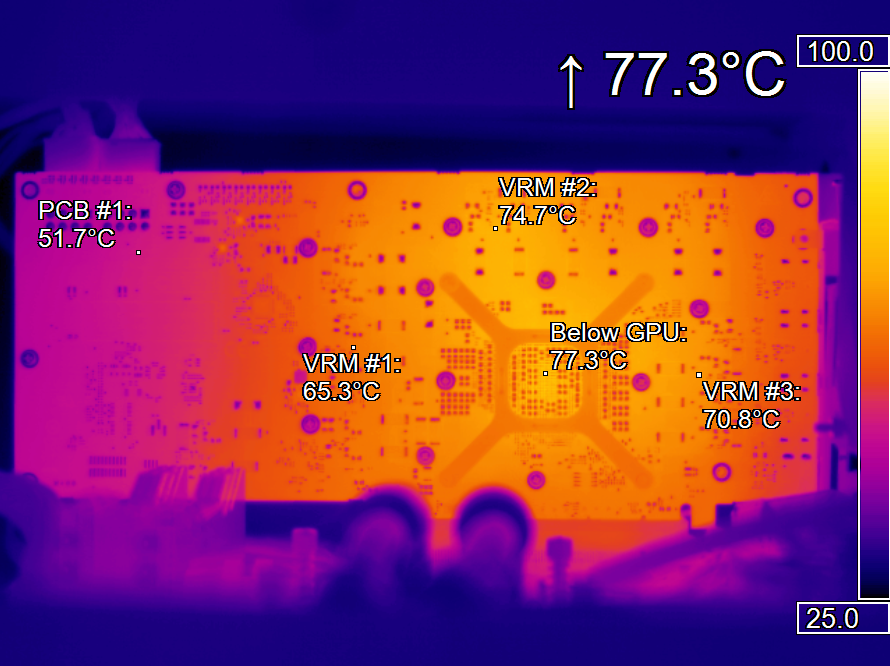
The following infrared images, captured during our gaming loop and stress test in a closed case and on an open test bench, convey meaningful real-world information. Compared to WattMan, which made logging data problematic at best, our infrared measurements are far more reliable.
Differences in the gaming loop between our open bench table and closed case are visible, but within the expected range of two to three degrees.
Our stress test imposes up to 20W-higher power consumption, which is dissipated as waste heat. Interestingly, the temperature we read below the GPU package was higher than the value that WattMan reported as GPU temperature.
In a closed case, everything gets hotter. What's reported as GPU temperature nearly hits 80°C, and according to AMD, junction temperature should be even higher.
Unfortunately, we couldn't log the results of our stress test with WattMan because the program returned nonsensical data. In several measurements, the software simply stopped recording after only a few lines. At least we have values from our camera.
MORE: Best Graphics Cards
MORE: Desktop GPU Performance Hierarchy Table
MORE: All Graphics Content
-
cknobman I have to say (as an AMD fan) that I am a little disappointed with this card, especially given the price point.Reply -
velocityg4 This might be an attack on the RTX 2080 if the price was closer to that of an RTX 2070. Looking at the results in the article. It only approaches RTX 2080 performance in games which tend to favor AMD cards. Yet even in those it barely surpases the RTX 2080. While the RTX 2080 soundly beats it in nVidia optimized titles. I'd say it would be an RTX 2075 if such a thing existed.Reply
Don't get me wrong. It is still a better card than an RTX 2070. But it's performance doesn't justify RTX 2080 pricing. Based on current pricing on PCParticker of the 2070 and 2080. $600 USD would be a price better suited for it.
Compute is a different matter. Depending on your specific work requirements. You can get some great bang for your buck.
Still it would be nice if AMD could blow out the pricing in the GPU segment as it does in the CPU segment. Although their strategy may be more of an attack on the compute segment. Given the large amount of memory and FP64 performance.
21749331 said:Under the hood, AMD’s Vega 20 graphics processor looks a lot like the Vega 10 powering Radeon RX Vega 64. But a shift from 14nm manufacturing at GlobalFoundries to TSMC’s 7nm node makes it possible for AMD to operate Vega 20 at much higher clock rates than its processor.
Did you mean predecessor?
-
richardvday they cant lower the price without losing money on each card that memory cost so much its half of the BOMReply -
King_V Reply21749475 said:they cant lower the price without losing money on each card that memory cost so much its half of the BOM
I know this has been mentioned, but do we have any hard data where we know this for certain?
I remember asking someone before, and they posted a link, but even that seemed to be a he-said-she-said kind of thing.
I do have to agree, though, overall, with a vague disappointment. Given its performance, value-wise, it seems this is worthwhile only if you really want at least two of the games in the bundle.
I hadn't thought about what AMD's motivation was, but the thought that even AMD was caught a little by surprise at Nvidia's somewhat arrogant pricing for the RTX 2070/2080/2080Ti, and "smelled blood" as it were, is somewhat plausible. -
redgarl Something is wrong with your Tomb Raider bench, techspot results are giving the RVII the victory.Reply -
timtiminhouston I am an AMD fan but AMD needs to stop letting sales gurus dictate everything. The fact is AMD is WAY behind Nvidia at this point, and there is absolutely no way they should have disabled anything from the datacenter card to make up for not having Tensor OR Ray Tracing; they should have only had less memory. I understand reviewers trying not to savage the card, but let's be honest, if I won this card I would probably sell it unopened. I am all about GPGPU, and in the HD7970 at least I had massive compute compared to the competition (125k Pyrit hashes/sec), even though Nvidia was still better in most games. Not only is this card not better in gaming, it is way behind in GPGPU technology. I look forward to buying a used RTX card in a year or two to see what else the Tensor cores can be used for on Linux, but not so much this card. If I saw it for $300 on Craigslist I might be tempted, but GPU and memory prices are still way over inflated due to the cryptoscam boom. Luckily it looks like they are running short of suckers. This is a hard pass, and no way I can recommend it. A used GTX 1070 or Vega 56 for 200 is far better bang for buck. Hold your money for a year or so.Reply -
edjetorsy I am not impressed by this AMD graphical card at almost the same price for a RTX2080 more performance and lower power consumption.Reply
The Ryzen CPU however I am interested in, the 2700X is a good deal and waiting for the Ryzen 3e generation to appear and see what this baby can do compare to Intel high end . But no I own a GTX1070 il think I pass this whole RTX and Radeon VII generation, there is not so much to gain for the price at this time. -
shapoor12 can't understand the 331mm2 die size on readon vii while rtx 2080 have 545mm2 , amd could smash Nvidia by making bigger cards. why u doing this to yourself AMD? WHY?WHY?Reply -
Olle P At least it's the first 7nm consumer-marketed GPU to the market.Reply
The price cut from ~$5,000 (vanilla MI50) to $700 doesn't hurt.
Some undervolting and -clocking should do wonders to noise and heat.
Time to sit back and wait for Navi... -
Fulgurant "Nvidia’s Turing-based cards proved this by serving up solid performance, but simultaneously turning many gamers off with steep prices. It was only when the company worked its way down to GeForce RTX 2060 and had to compete against Radeon RX Vega 56/64 that it got serious about telling a more compelling value story."Reply
I don't see how the 2060 is a compelling value story. Sure, it's more cost-efficient than its high-end cousins, but the 2060 offers very little in the way of a performance increase to people who were in the same price bracket previously (1070 owners), and it offers an enormous price and power premium to people who own 1060s.
Spent ~$370 almost 3 years ago for an Nvidia card? Well now you can plop down roughly the same money for about a 15% performance increase and a 2 GB loss of VRAM. That tech-journalists actually tout this as great progress mystifies me.
Unfortunately this newest release from AMD doesn't look like it presages significant price pressure to bring Nvidia back down to earth. Things might get better as AMD drives towards down towards the midrange segment, but who knows? Here's hoping.
