BenQ RL2460HT 24-Inch Monitor Review: Is Gaming Good At 60 Hz?
Does a true gaming monitor need to have a 120 or 144 Hz refresh rate? BenQ’s RL2460HT offers plenty of features that cater to enthusiasts, but it tops out at 60 Hz. Can those extra capabilities compensate, or should you continue your search elsewhere?
Results: Brightness And Contrast
Uncalibrated
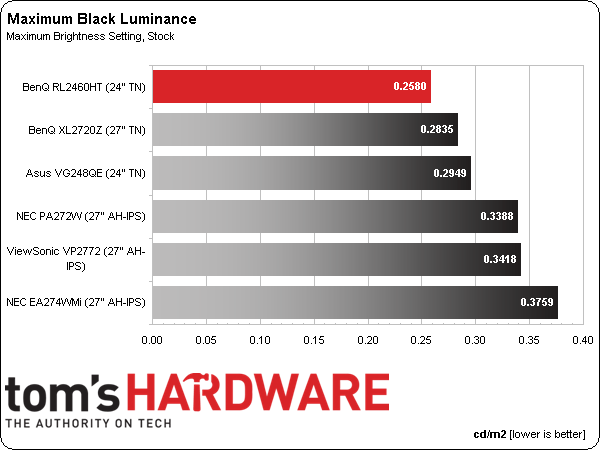
Before calibrating any panel, we measure zero and 100-percent signals at both ends of the brightness control range. This shows us how contrast is affected at the extremes of a monitor's luminance capability. We do not increase the contrast control past the clipping point. While that would increase a monitor’s light output, the brightest signal levels would not be visible, resulting in crushed highlight detail. Our numbers show the maximum light level possible with no clipping of the signal.
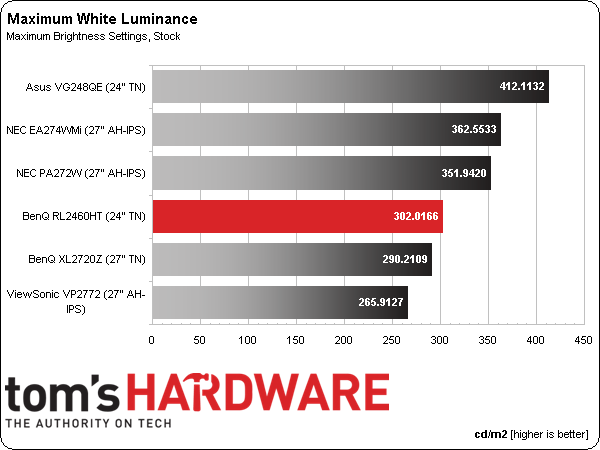
All three recently reviewed gaming monitors are represented in this round-up: the RL2460HT, plus BenQ’s XL2720Z and Asus’ VG248QE. We also have three professional QHD screens: NEC’s PA272W and EA274WMi, along with ViewSonic’s VP2772.
The RL2460HT’s default picture mode is Fighting and that's where you'll find the brightest image. Our measurement of 302.0166 cd/m2 exceeds BenQ’s spec by over 20 percent. There are a couple of color gamut issues in that mode, plus, grayscale and gamma accuracy are merely average. If you switch to Standard or sRGB, you still get around 240 cd/m2, which is decent performance. This monitor isn’t a light cannon. It is bright enough for any gaming situation we can think of, though.
TN is still the go-to panel technology for black levels, as our results show. Even though IPS is getting better, it isn’t quite there yet. And as you’ll see later, TN retains its edge for gamers with lower response times and less input lag.
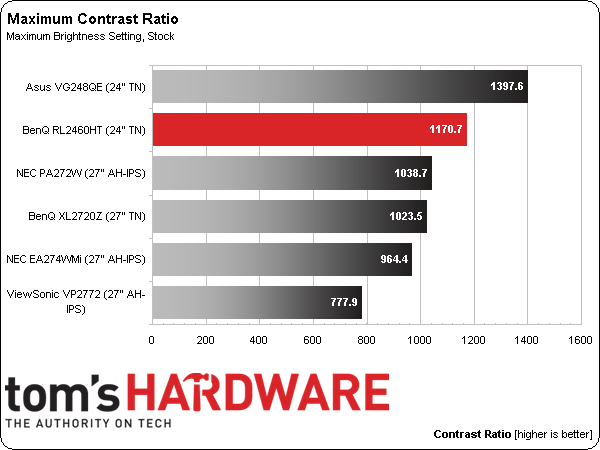
The only display to beat BenQ's RL2460HT in this group is Asus’ VG248Q high-refresh rate model. Still, 1170.7 to 1 is an excellent number that sails right over our benchmark figure of 1000 to 1. Once you dial in gamma properly, this screen delivers a nice image with plenty of detail and pop.
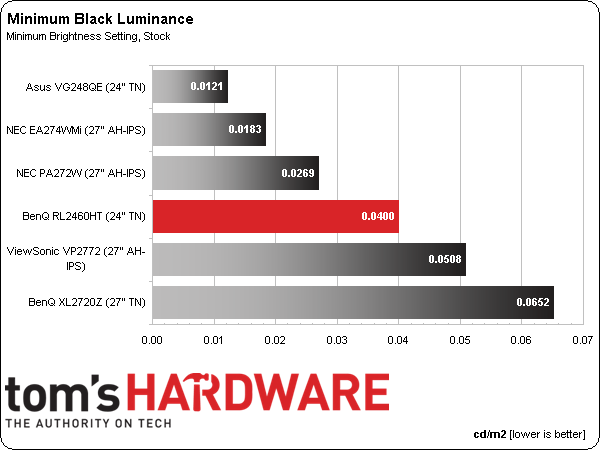
We believe 50 cd/m2 is a practical minimum standard for screen brightness. Any lower and you risk eyestrain and fatigue. The RL2460HT puts out 45.5816 cd/m2 at its lowest Brightness setting. Conceivably, you could use the screen like that in a room devoid of ambient light. As you’ll see in the next two charts, black levels and contrast maintain excellent consistency.
A result of .0400 cd/m2 represents a great black level, considering the minimum white level is over 45 cd/m2. The two NECs beat the RL2460HT only because they bottom out at less than 20 cd/m2. If you like playing games with the brightness at the bottom, you may want to experiment with different gamma presets to make sure no shadow or highlight detail is lost.
Get Tom's Hardware's best news and in-depth reviews, straight to your inbox.
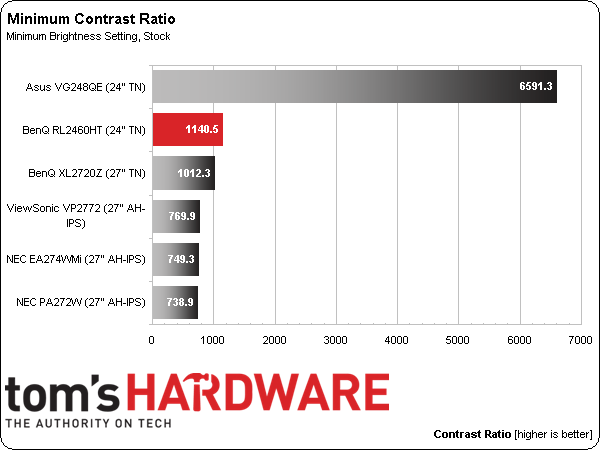
If you ignore Asus’ freakish result, the BenQ becomes one of our top contrast performers. After checking the ratio at 80, 120, and 160 cd/m2, we found that you’ll always see about 1100 to 1, yielding the kind of consistent performance we look for in any monitor.
After Calibration
Since we consider 200 cd/m2 to be an ideal point for peak output, we calibrate all of our test monitors to that value. In a room with some ambient light (like an office), this brightness level provides a sharp, punchy image with maximum detail and minimum eye fatigue. On many monitors it’s also the sweet spot for gamma and grayscale tracking, which we'll look at on the next page.
In a darkened room, some professionals prefer a 120 cd/m2 calibration, though we've found it makes little to no difference on the calibrated black level and contrast measurements.
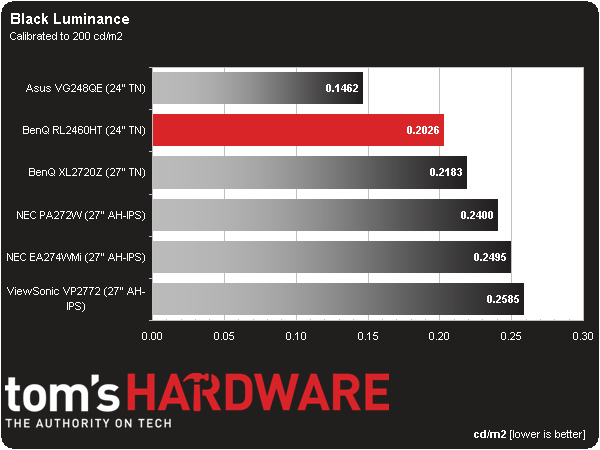
The calibrated black level stays nice and low at .2026 cd/m2. We made minor changes during calibration, so minimum brightness and on/off contrast aren't much different.
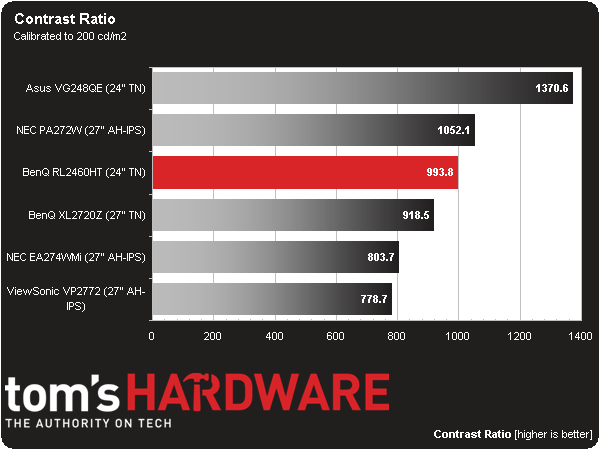
Calibrated contrast only takes a slight hit down to 993.8 to 1. We couldn’t see any difference in image quality other than the color improvement that always accompanies calibration. Some tradeoffs have to be made with regards to gamma to achieve the very best contrast. We’ll talk about them on the next page.
ANSI Contrast Ratio
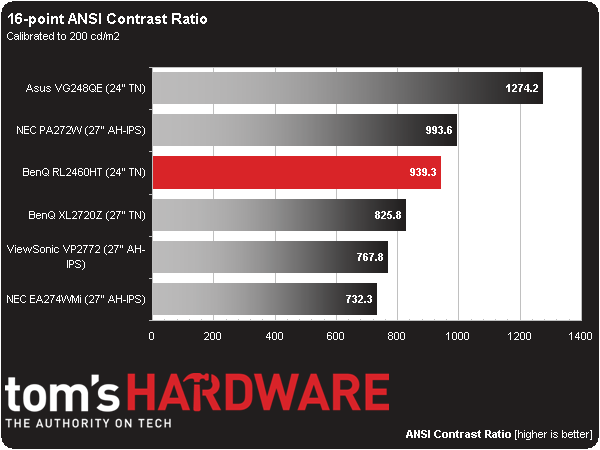
Another important measure of contrast is ANSI. To perform this test, a checkerboard pattern of sixteen zero and 100-percent squares is measured, yielding a somewhat more real-world metric than on/off readings because we see a display’s ability to simultaneously maintain both low black and full white levels, factoring in screen uniformity, too. The average of the eight full-white measurements is divided by the average of the eight full-black measurements to arrive at the ANSI result.
We’re seeing more and more displays achieving higher and higher ANSI contrast results. It’s a trend we like because it means greater image depth in more kinds of content. When a relatively inexpensive monitor like the RL2460HT can match the performance of displays costing three and four times as much, you know progress is being made. Prices may not be dropping to everyone’s satisfaction, so we have to cheer about increased quality and performance.
Current page: Results: Brightness And Contrast
Prev Page Measurement And Calibration Methodology: How We Test Next Page Results: Grayscale Tracking And Gamma Response
Christian Eberle is a Contributing Editor for Tom's Hardware US. He's a veteran reviewer of A/V equipment, specializing in monitors. Christian began his obsession with tech when he built his first PC in 1991, a 286 running DOS 3.0 at a blazing 12MHz. In 2006, he undertook training from the Imaging Science Foundation in video calibration and testing and thus started a passion for precise imaging that persists to this day. He is also a professional musician with a degree from the New England Conservatory as a classical bassoonist which he used to good effect as a performer with the West Point Army Band from 1987 to 2013. He enjoys watching movies and listening to high-end audio in his custom-built home theater and can be seen riding trails near his home on a race-ready ICE VTX recumbent trike. Christian enjoys the endless summer in Florida where he lives with his wife and Chihuahua and plays with orchestras around the state.
-
eldragon0 ReplyDoes it even matter when games automatically enable Vsync setting to 60 Hz?
No, but chances are if you're dropping 300+ on a monitor and genuinely want the extra frame rate you will be the type of person who is ready and expecting to tweak the game's files to run at those frame-rates. -
Heironious Yes, it matters. After buying the ASUS VG248 with Lightboost enabled in 2D gaming, I can not go back to a 60hz monitor. Is it really that hard for you to disable Vsync in the games settings?Reply -
envy14tpe I think most mid-range gamers go 60Hz TN panel monitors that sell for $150 or less. This monitor seems pretty pricey and is stuck between those and the 144Hz monitors. I don't' think this will sell all that well.Reply -
therogerwilco The ZR30W is 2560x1600, yet only 60 hz.Reply
I achieve first place in multiple games when playing multiplayer, on a regular basis.
60hz is not the problem, the problem is your system if it CAN'T sustain 60 fps. -
Xivilain If your monitor supports 30hz, 60hz, or even 120hz, its nice to see the visual difference they make when compared side by side. I like to show other people this demo to compare FPS:Reply
http://frames-per-second.appspot.com/ -
xenol When frame rate time periods start exceeding the fastest reaction times of humans, I start to question whether or not even faster frame rates are necessary.Reply
I don't think competitive players win because they have 144Hz monitors and can react with all that information being fed to them. I think they win because they are proactive, and that there are many tells anyway to allow someone who's tuned in the game to react quickly.
I mean, StarCraft has choppy animation that is independent of refresh rates (they look like they move at 20FPS), but there's a lot of high level competition there. -
heydan Im still don´t know how people reach the 120-144 fps in any game even at 1080p, maybe they refer to fps higher than 60fps, like 70, 80, and maybe for some old games the 120-144 fps, or they play games with low settings in order to reach those fps?, can someone explain me?, because I can find any review about any high end GPU and found that there´s so little games that achieve 120-144 fps at 1080p with everything max out...Reply -
tipmen ReplyIm still don´t know how people reach the 120-144 fps in any game even at 1080p, maybe they refer to fps higher than 60fps, like 70, 80, and maybe for some old games the 120-144 fps, or they play games with low settings in order to reach those fps?, can someone explain me?, because I can find any review about any high end GPU and found that there´s so little games that achieve 120-144 fps at 1080p with everything max out...
You do have a point with newer games that have very nice graphics. Such as, BF, Metro LL, and Arma 3 you need a beefy GPU set up or some people turn down the settings. (Eye candy is nice but if it is going to be a slideshow it isn't worth it) However, older titles such as CS GO where having the higher FPS will give you an edge doesn't take much to get 200+ FPS. Basically computers with at least an i5 and a 6970 or 580 can hit FPS 100+ on older titles. Newer titles i5/i7 (depends on the game if it take advantage of the hyper threading) 7970(280)/290x or 680/780. Crossfire or SLI helps but I personally find the gaming experience smoother playing CS GO on one 7970 instead of two in crossfire. With one I am still well over 100 FPS. When I play BF4 I have crossfire enable and high settings with some things turned down I get over 100FPS on DX11 API. When I try mantle (When it works....) I get an extra 10fps if I am lucky and feels smoother. You also can check Toms GPU charts of even their recently released SMB. I own Asus 144hz and never can go back to playing FPS on something less. I just wish they will catch up to my golden days with the CRTs refresh rates .
