SSD Deathmatch: Crucial's M500 Vs. Samsung's 840 EVO
Micron's consumer products division, Crucial, wasn't the first brand to introduce a 1 TB SSD. But it was the first to sell one for less than a fortune, and it sports some snazzy new features to boot. We got our hands on the entire line-up to test.
Results: 4 KB Random Writes
Random write performance is extremely important, no question about it. Early SSDs didn't do well in this metric at all, seizing up in even the most lightweight workloads. Newer SSDs wield more than 100x the performance of drives from 2007, but there's a point of diminishing returns in client environments. When you swap a hard drive out for solid-state storage, your experience improves. Load times, boot times, and system responsiveness all get better. If called upon, your SSD-equipped system could handle a lot more I/O than the spinning media you had in there before. With consumer workloads, it's more about getting to those operations faster, not necessarily handling more of them.
4 KB Random Write
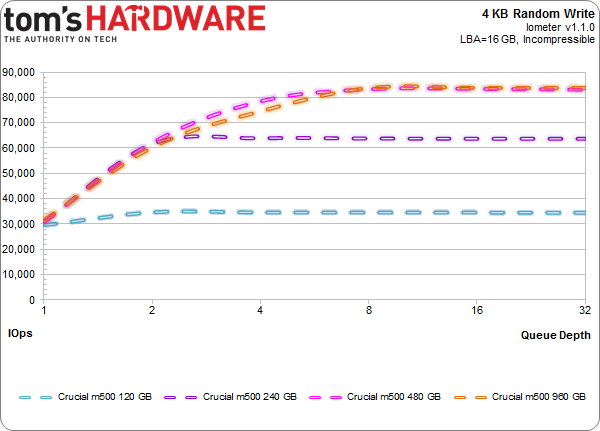
Shining a spotlight on each M500 capacity point gives us a clear look at the impact of parallelism in solid-state storage. Write speed is very much a function of how many dies there are to exploit. We already saw this playing out in the sequential write test, and it's even more pronounced when we write small blocks of data randomly.
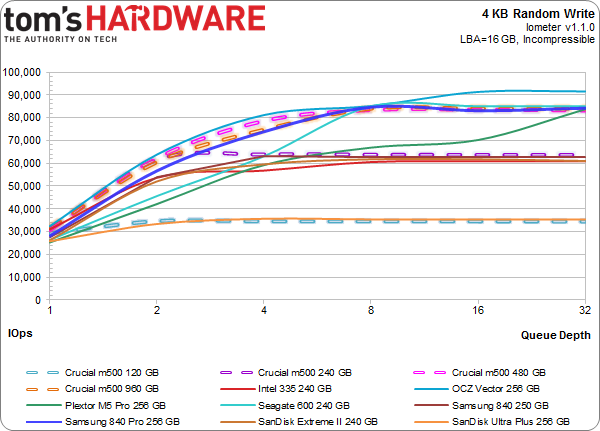
Crucial's 120 GB M500 passes 34,000 IOPS at a queue depth of two. The 240 GB drive doubles that number. Both larger M500s continue scaling, but match each others' performance as they plateau. When you're down at a queue depth of one, though, all four SSDs post the same ~30,000 IOPS finish.
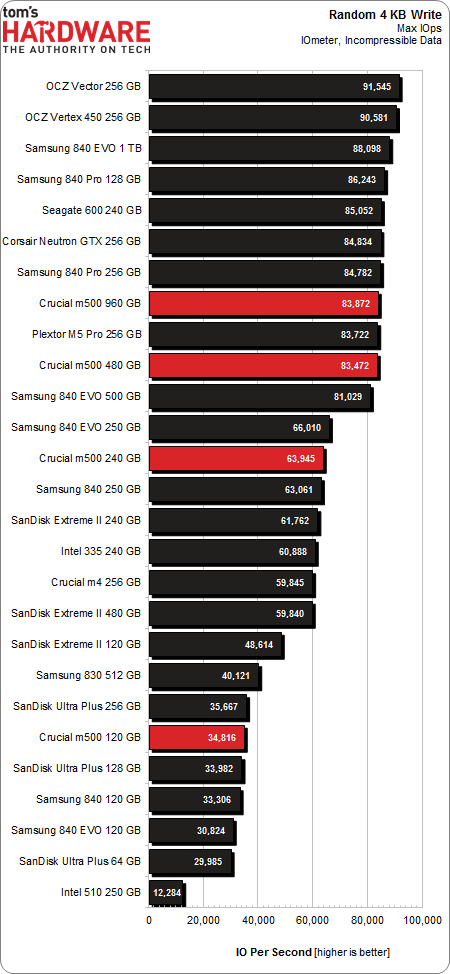
Clearly, the 120 GB M500 can't hang with the big dogs, though it does rub up against the 256 GB Ultra Plus. That one model sports the only four-channel controller on our chart, and the impact is painfully obvious.
Crucial's two highest-capacity M500s give performances worthy of front-runner status. The 240 GB version is more modest. Athough it does a lot better than the 120 GB M500, transitioning to 128 Gb flash hurts the benchmark results in a measurable way.
Write Saturation
Get Tom's Hardware's best news and in-depth reviews, straight to your inbox.
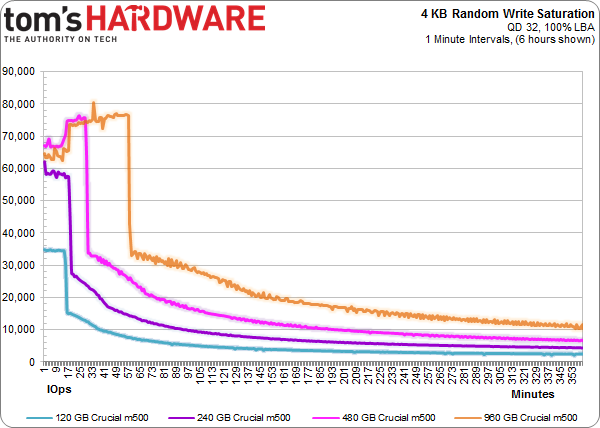
A saturation test consists of writing to a drive for a specific period of time with a defined workload. Technically, this is a fairly enterprise-class write saturation test, where the entire LBA space of the disk is utilized.
In Iometer and in this write saturation test, all four SSDs start out secure-erased. In the write saturation testing, however, where each drive is peppered across its entire LBA range with 4 KB random writes at a queue depth of 32, the larger M500s start by falling short of the big numbers we saw in Iometer (the were both up above 80,000 IOPS previously).
It's possible that both drives have to adjust to a larger LBA range. But if that's the case, then why don't the smaller models exhibit the same behavior? This could be an artifact of the larger drives' higher performance, whereas the 120 and 240 GB M500s are limited to 35,000 and 60,000 IOPS, respectively.
Given that the 480 and 960 GB models are so similar in terms of speed, it's easy to see that the larger SSD takes roughly twice as long to fill up. With the move from 120 to 240 to 480 GB, capacity jumps in proportion to write performance. That's why the 240 GB M500, despite its substantial advantage in IOPS, takes the same amount of time as the 120 GB drive to drop to a lower performance level on its way to steady-state.
Current page: Results: 4 KB Random Writes
Prev Page Results: 4 KB Random Reads Next Page Results: Tom's Storage Bench v1.0-
Someone Somewhere I think you mixed up the axis on the read vs write delay graph. It doesn't agree with the individual ones after, or the writeup.Reply -
Someone Somewhere Even 3bpc SSDs should last you a good ten years...Reply
The SSD 840 is rated for 1000 P/E cycles, though it's been seen doing more like ~3000. At 10GB/day, a 240GB would last for 24,000 days, or about 766 years, and that's using the 1K figure.
You're free to waste money if you want, but SLC now has little place outside write-heavy DB storage.
EDIT: Screwed up by an order of magnitude. -
cryan Reply11306005 said:I think you mixed up the axis on the read vs write delay graph. It doesn't agree with the individual ones after, or the writeup.
You are totally correct! You win a gold star, because I didn't even notice. Thanks for catching it, and it should be fixed now.
Regards,
Christopher Ryan
-
cryan Reply11306034 said:I would only buy SSD that uses SLC memory. I dont wan't to buy new drive every year or so.
Not only are consumer workloads completely gentle on SSDs, but modern controllers are super awesome at expanding NAND longevity. I was able to burn through 3000+ PE cycles on the Samsung 840 last year, and it only is rated at 1,000 PE cycles or so. You'd have to put almost 1 TB a day on a 120 GB Samsung 840 TLC to kill it in a year, assuming it didn't die from something else first.
Regards,
Christopher Ryan
-
Someone Somewhere I'd like to see some sources on that - for starters, I don't think the 840 has been out for a year, and it was the first to commercialize 3bpc NAND.Reply
You may be thinking of the controller failures some of the Sandforce drives had, which are completely unrelated to the type of NAND used. -
mironso Well, I must agree with Someone Somewhere. I would also like to see sources for this statement: "Yes, in theory they last 10 years, in practise they last a year or so.".Reply
I would like to see, can TH use SSD put this 10GB/day and see for how long it will work.
After this I read this article, I think that Crucial's M500 hit the jackpot. Will see Samsung's response. And that's very good for end consumer. -
edlivian It was sad that they did not include the samsung 830 128gb and crucial m4 128gb in the results, those were the most popular ssd last year.Reply -
Someone Somewhere You can also find tens of thousands of people not complaining about their SSD failing. It's called selection bias.Reply
Show me a report with a reasonable sample size (more than a couple of dozen drives) that says they have >50% annual failures.
A couple of years ago Tom's posted this: http://www.tomshardware.com/reviews/ssd-reliability-failure-rate,2923.html
The majority of failures were firmware-caused by early Sandforce drives. That's gone now.
EDIT: Missed your post. First off, that's a perfect example of self-selection. Secondly, those who buy multiple SSDs will appear to have n times the actual failure rate, because if any fail they all appear to fail. Thirdly, that has nothing to do with whether or not it is a 1bpc or 3 bpc SSD - that's what you started off with.
This doesn't fix the problem of audience self-selection
-
Someone Somewhere You were however trying to stop other people buying them...Reply
Sounds a bit like a sore loser argument, unfortunately.
SSDs aren't perfect, but they generally do live long enough to not be a problem. Most of the failures have been overcome by now too.
Just realised there's an error in my original post - off by a factor of ten. Should have been 66 years. -
warmon6 Reply11306841 said:I am not talking about Samsung SSD-s, I am talking about SSDs in general. And I am not going to provide any sources because SSD fail all the time after a year or so. That is the raility. You can find, on the internet, people complaining abouth their SSD failing. There are a lot of them...
Also, SLC based SSD-s are usually "enterprise", so they are designed for reliability and not performance, and they don't use some bollocks, overclocked to the point of failure, controllers. And have better optimised firmware...
Tell that to all the people on this forum still running intel X-25M that launched all the way back in 2008 and my Samsung 830 that's been working just fine for over a year.......
See what you're paying attention too is the loudest group of ssd owners. The owners that have failed ssd's.
See it's the classic "if someone has a problem, there going to be the one that you hear and the quiet group, isn't having the problem" issue.
Those that dont have issues (such as myself) dont mention about our ssds and is probably complaining about something else that has failed.


