System Builder Marathon, June 2012: $500 Gaming PC
Performance Summary And Efficiency
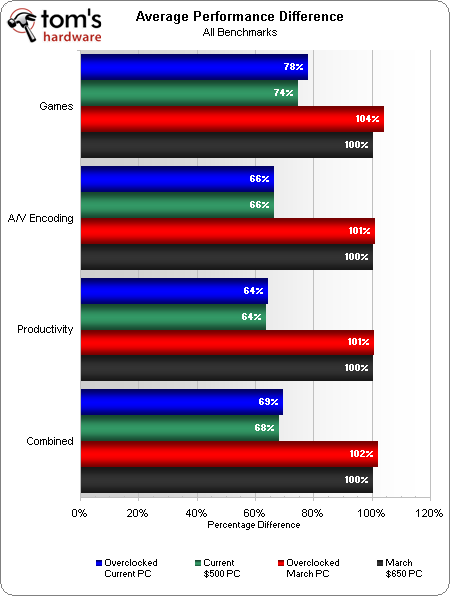
We summarize performance and efficiency using last quarter's stock $650 system as a baseline.
Performance Summary
Earlier this year, the $650 PC delivered just enough performance to edge out Don's pricier enthusiast-oriented system in overall bang-for-the-buck value, despite being GPU-heavy and built specifically for 1920x1080 gaming.
After achieving only 68% of last quarter's overall performance at 77% of that last system's cost, today's $500 build prepares for total embarrassment in tomorrow’s value comparison.
No, this doesn't come as a surprise. By spending just 10% of our smaller budget on an entry-level CPU, we knowingly showed up to this battle armed with big graphics and little more. Don't get us wrong; the Celeron G530 offers very good performance for its low price tag. But it's not able to compensate for the fact that our big-ticket item only shines in one particular component of the SBM's weighting system.
Efficiency
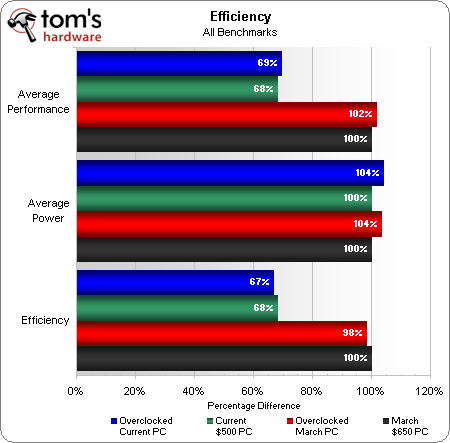
Using the same amount of energy, on average, as last quarter's effort, while only delivering 68% of its overall performance, today's system suffers a big loss in efficiency. But breaking the power results down a little more tells a more complete story.
In office productivity or content creation tasks (or any other time the GeForce GTX 560 Ti sits idle), this machine's power consumption would be extremely low, and its efficiency would be more in line with the preceding build. Where efficiency suffers is gaming, in which case you care more about playable performance than what's being pulled from the wall.
Current page: Performance Summary And Efficiency
Prev Page Power Consumption And Temperatures Next Page Did Our Gamble Pay Off?Get Tom's Hardware's best news and in-depth reviews, straight to your inbox.
-
mayankleoboy1 why are you not increasing the voltages on the GPU to get more clocks ?Reply
any enthusiast with limited budget would want to maximize his core clocks with higher voltages.. the card can keep cool by increasing the fan speed.
More noise for a gaming session is acceptable. -
mayankleoboy1 ReplyDumping the bulk of our funding into graphics is sure to spell disaster throughout the media encoding and productivity benchmarks. But it's time to face the music.
pun intended ? ;) -
s3anister Celeron G530 is what I'm rocking in my gaming rig. It is definitely a capable processor, surprising given the legacy behind anything labeled Celeron.Reply -
s3anister Slomo4shOWould have liked to see Diablo 3 and SC 2 benchmarks for this build.I can't give you exact fps rates, but my machine is very similar to this one (only difference is the GPU: 6950+Z68) and I get similar frame rates in all the tested games. So I'll infer to you what this rig would probably get close to.Reply
Diablo 3 maxes out at 60fps with occasional dips down to ~30fps when getting mobbed on hell. As for SC2, frame rates for me tended to be around 35fps on average with everything maxed out at 1920x1080 for both games. -
pauldh s3anisterCeleron G530 is what I'm rocking in my gaming rig. It is definitely a capable processor, surprising given the legacy behind anything labeled Celeron.Ah, but think way back.... slot 1, 440BX, and the Celeron 300A? I had a 266@412MHz, a 300A@464MHz, a 300A@450MHz, and a 333(that topped out down at an 83 MHz FSB).Reply
While not the first chips I had overclocked, those slot 1 Celeron's gave me the incurable OC bug! *dreams of G530K* -
jestersage Amazing! I never thought an SBM machine would ever come this close to my own rig. And confirm for me that my drooling over $200+ graphics cards is not an impractical fantasy for my current rig. I've been dreaming of retiring my old GT240 for a newer card and had the HD7850 (or comparable Nvidia counterpart when it comes out) in mind, or even an HD7770. I now feel justified and my wife will go nuts over the pc part purchase, again.Reply
I did notice one thing when I compared this build with my system - mine idles at 48-52 watts, too, and I use a 500W S12II. I think right-sizing the PSU will add to the efficiency. A 350w PSU is my bet for bringing the idle power draw closer to the 20% mark of the PSU rating where efficiency starts to pick up (as per 80plus requirements). I say 350w because whoever gets this will likely want to upgrade the CPU to something beefier sooner or later. Nah, sooner!
Thanks, Paul! for tackling love and system-building with reckless abandon. -
bustapr i got a question. if I were to use a phenom 2x4 965 BE(3.4ghz) for a gaming rig on a similar budget to this, would it bottleneck me in gaming and other applications?Reply -
pauldh mayankleoboy1why are you not increasing the voltages on the GPU to get more clocks ?any enthusiast with limited budget would want to maximize his core clocks with higher voltages.. the card can keep cool by increasing the fan speed.More noise for a gaming session is acceptable.As mentioned, it was maiinly a matter of consistency with the past few builds. Dealing with fixed CPU clocks and memory frequency, I just haven't been too aggresive with previous efforts with Radeons, and thus didn't want to boost voltage here with the GTX. Trying to play it fair, that's all. Maybe once we revisit overclockable platforms, and are already dealing with increaded noise, I'll get itchy to max-out the GPU.Reply
Thanks for the feedback though. I'm actually surprised given the balance of the system, that people would desire to see aggressive GPU overclocking.


