Micron 9100 Max NVMe 2.4TB SSD Review
Why you can trust Tom's Hardware
4KB Random Read And Write
To read more on our test methodology visit How We Test Enterprise SSDs, which explains how to interpret our charts. The most crucial step to assuring accurate and repeatable tests starts with a solid preconditioning methodology, which is covered on page three. We cover 4KB random performance measurements on page four, explain latency metrics on page seven and cover QoS testing and the QoS domino effect on page nine.
| Header Cell - Column 0 | 2.4 TB Micron 9100 MAX | 1.6TB Intel DC P3700 | 1.6TB Intel DC P3608 | 3.2TB MemblazePBlaze4 | 2.7TB Mangstor MX6300-270TS |
|---|---|---|---|---|---|
| NAND | Micron 128Gbit 16nm MLC | Intel 20nm HET MLC | Intel 20nm HET MLC | Toshiba 15nm MLC | Toshiba A19nm eMLC NAND |
| Random Read/Write IOPS | 750,000/300,000 | 450,000/150,000 | 850,000/150,000 | 780,000/180,000 | 900,000/300,000 |
| Sequential Read/Write GB/s | 3.2/2.2 | 2.8/1.9 | 5/2 | 3/2 | 3.7/2.4 |
| Endurance | 6.57 PB/2.7 DWPD | 43.8PB/17 DWPD | 8.76PB/3 DWPD | 17.3 PB/3 DWPD | 34.5PB/7 DWPD |
| Active Power | 7-30 | 22W | 30W | 25W | 40+ Watts |
Our test pool consists of SSDs with varying capacity points and over-provisioning levels. This is an important consideration during the procurement process, and we urge readers to reference the performance specifications for each capacity point. Our test pool includes two single-controller PCIe SSDs, the 1.6TB Intel DC P3700 and the 3.2TB Memblaze PBlaze4. We also include the multi-controller 1.6TB Intel DC P3608, which utilizes two ASICs and a PCIe switch, and the 2.7TB Mangstor MX6300-270TS, which employs three Altera FPGAs and a monstrous 100-core Coherent Logix control FPGA.
We typically split our test pool into separate mainstream single-controller PCIe SSDs and bleeding-edge multi-controller SSDs. However, the only SSDs that can challenge the Micron 9100 Max are the DC P3608 and MX6300, so we include them to highlight how much additional performance the 9100 provides in comparison to incredibly complex architectures.
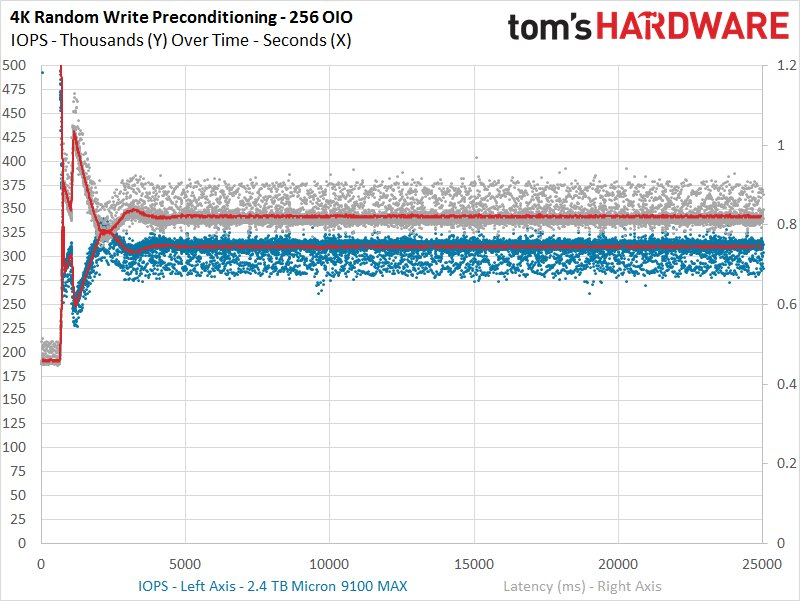
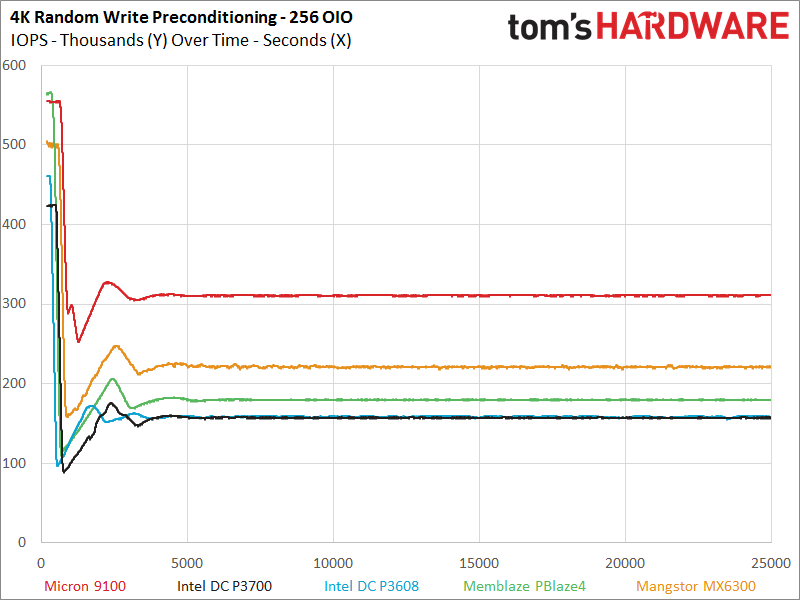
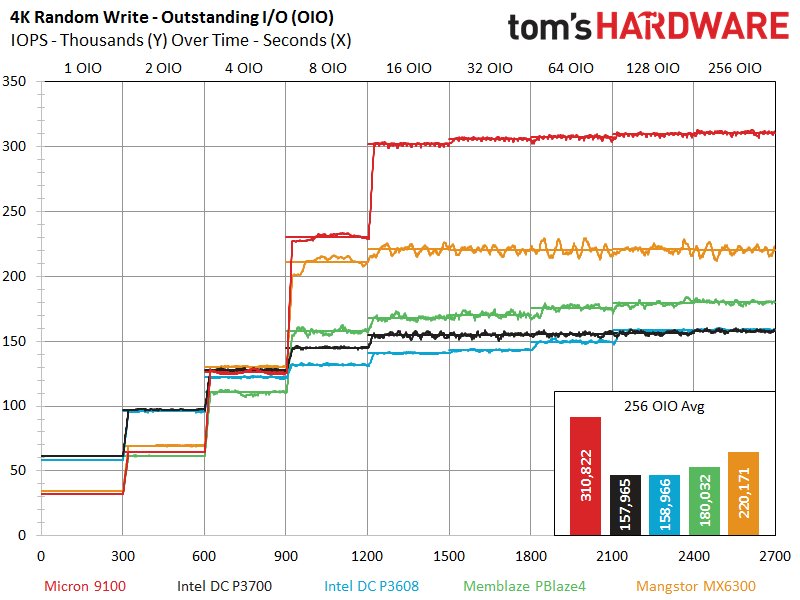
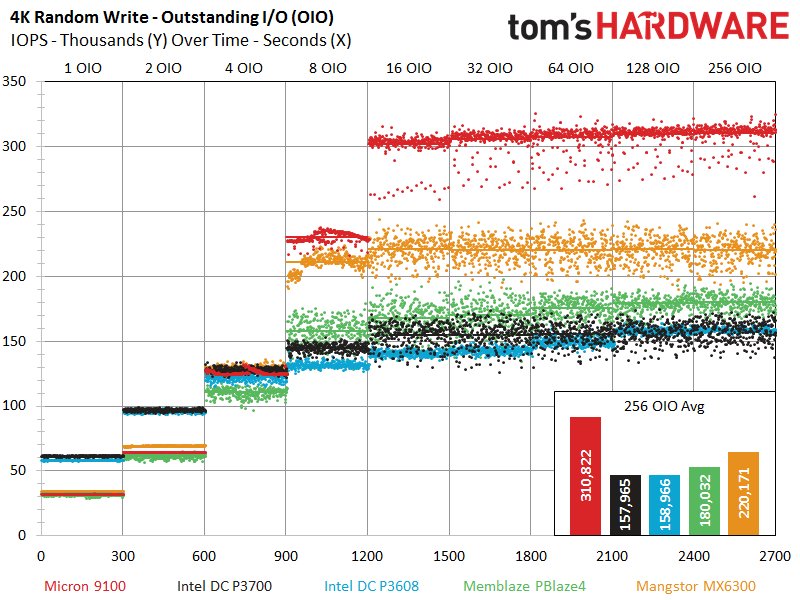
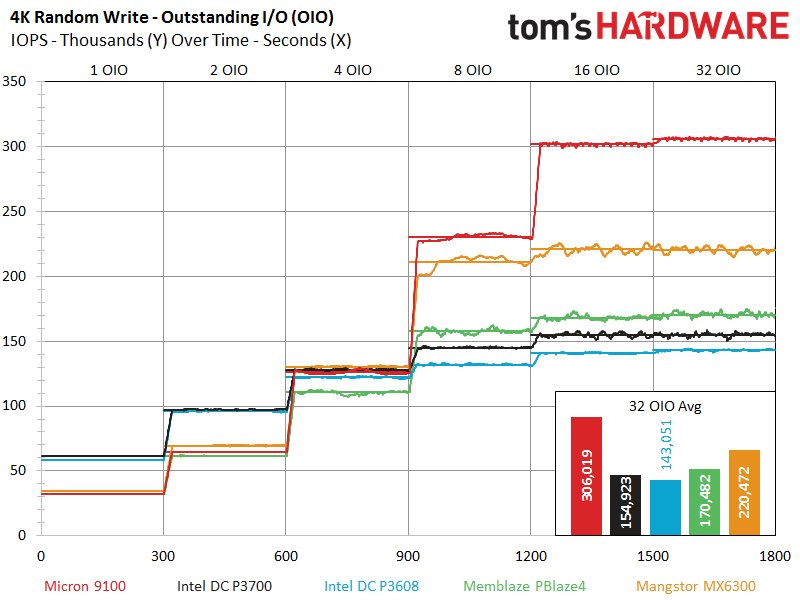
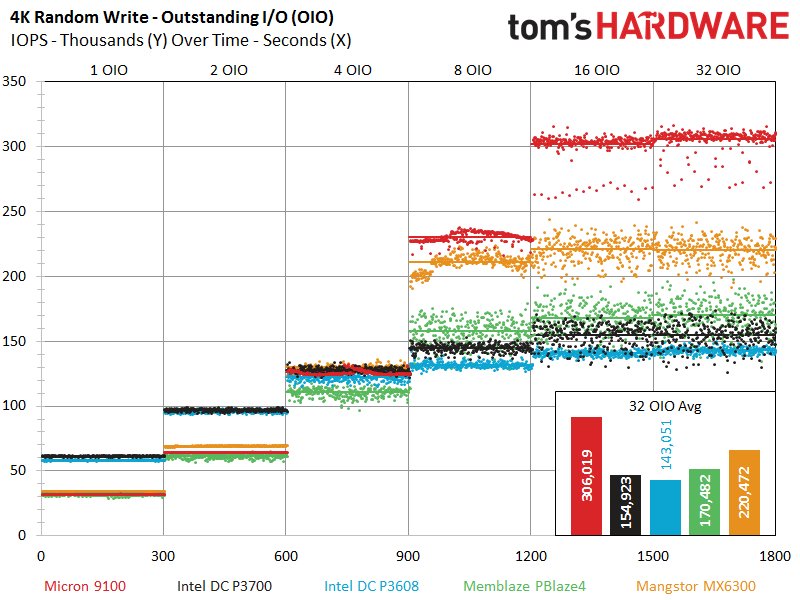
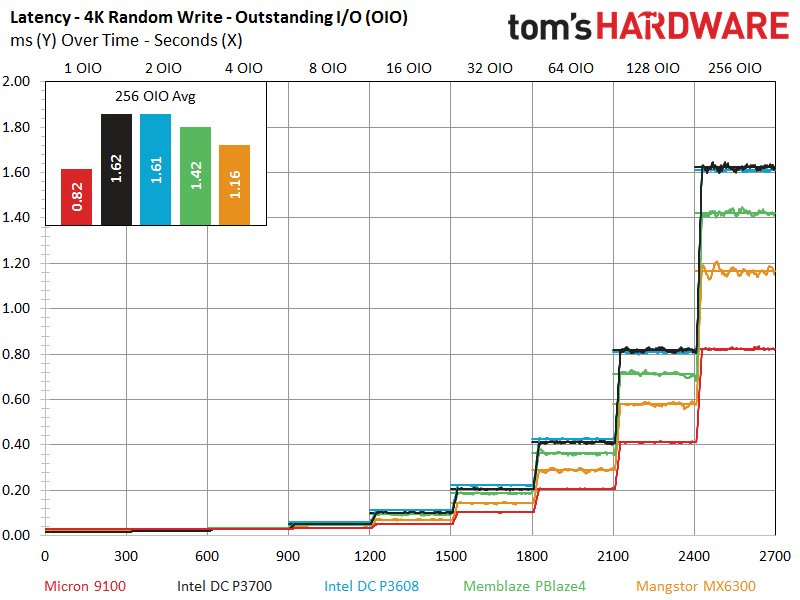
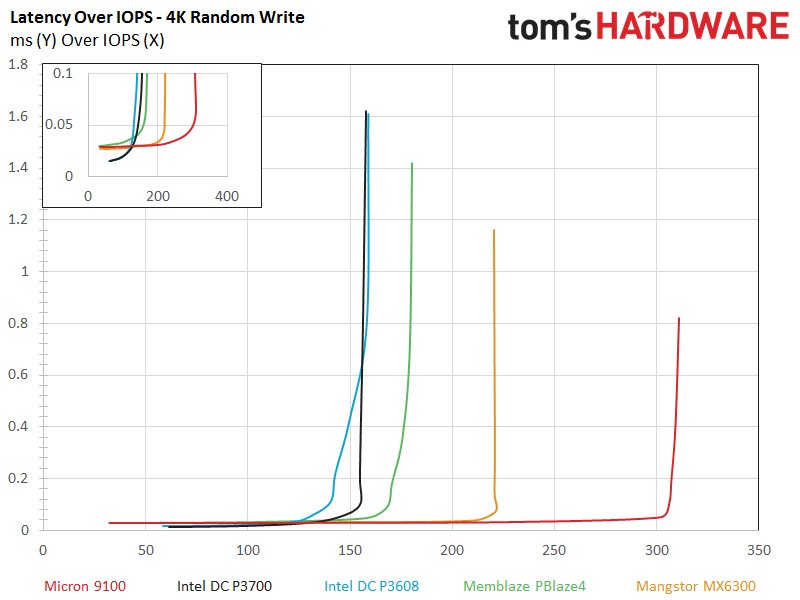
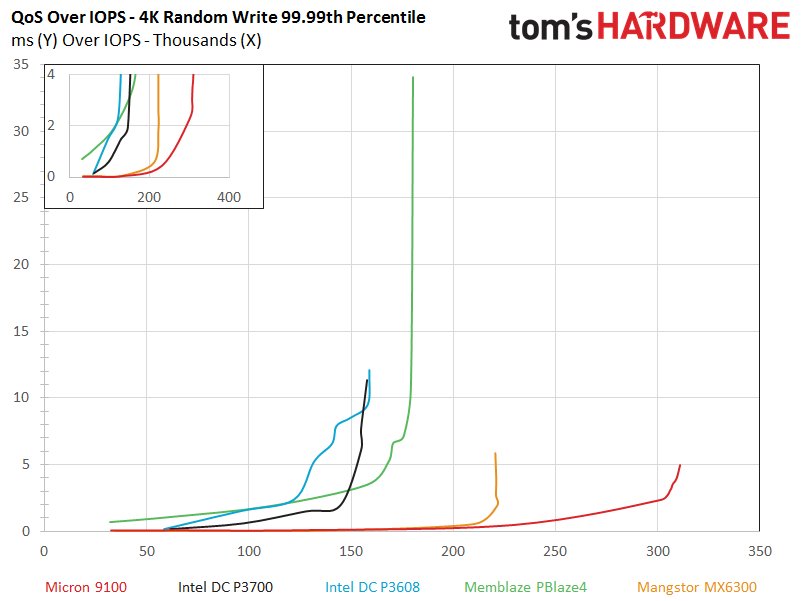
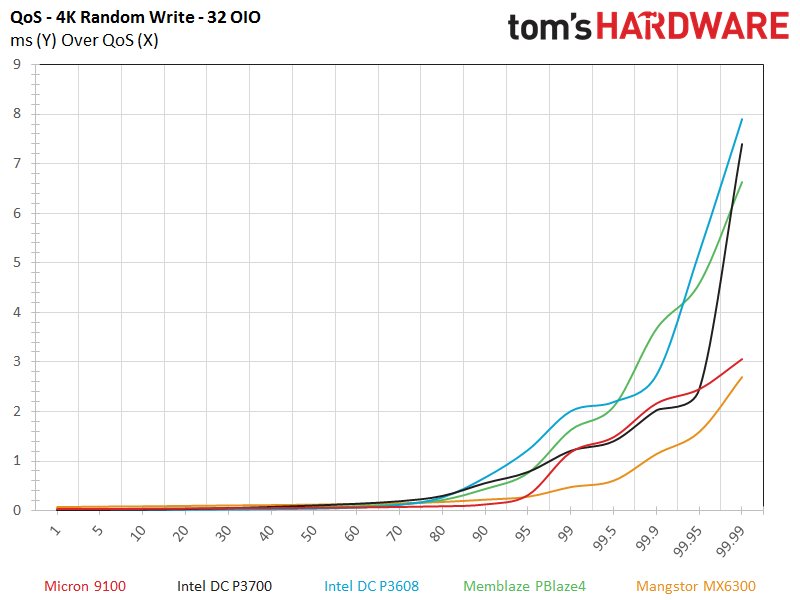
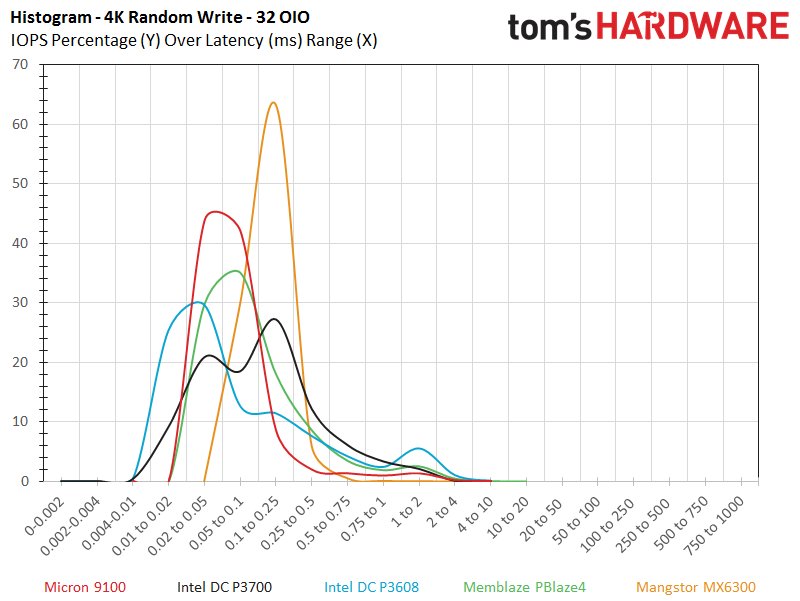
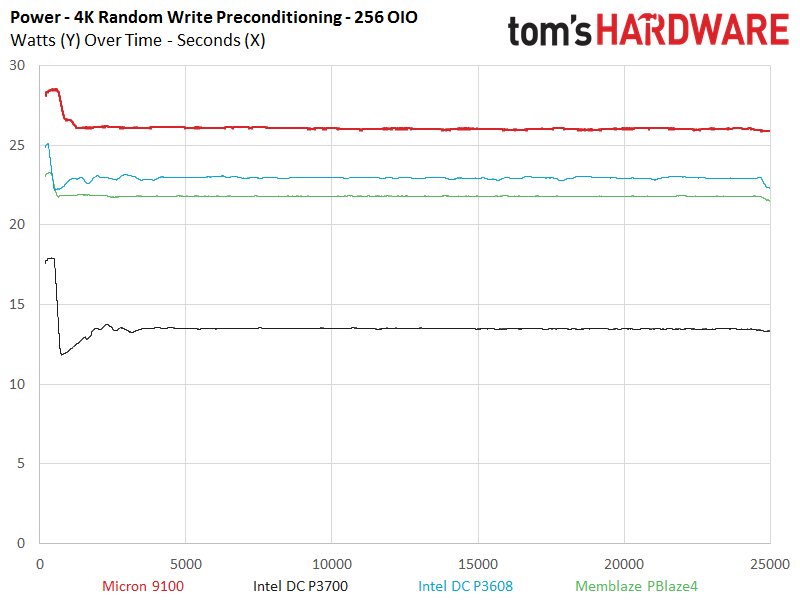
The Micron 9100 Max sets the tone early with its market-leading 4K random write speed at 256 OIO. There simply is not an SSD on the market that can challenge it during an unbridled 4K random write workload; even the multi-chip 100-core Mangstor gets tossed around in its wake. The 9100 also provides a reasonably consistent performance profile, which is a vast improvement over its P420m predecessor, and the sparse variability is easily outweighed by sheer grunt power. However, most normal workloads reside in the lower OIO ranges, and the 9100 falls beneath the Intel SSDs at 1 and 2 OIO but retakes the lead at 4 OIO.
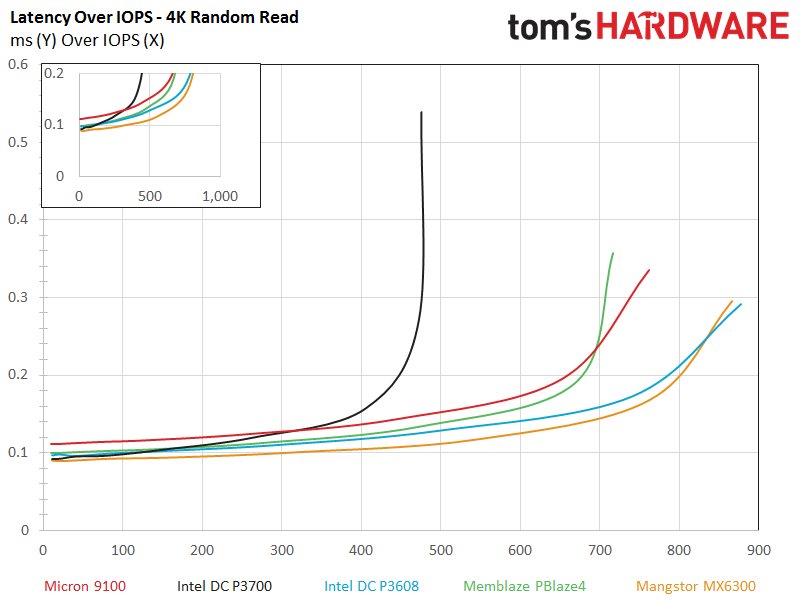
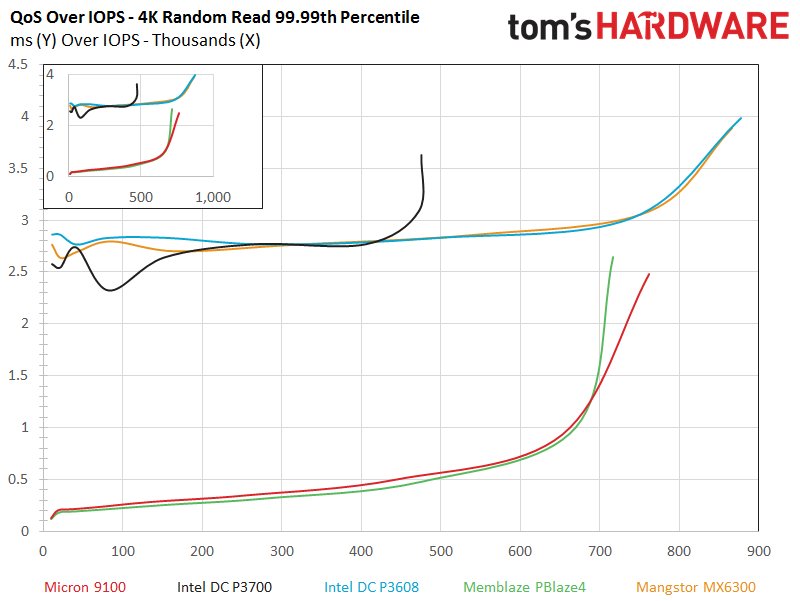
The 9100 also excels in the Latency-over-IOPS chart, and the zoomed in sub-chart reveals that it provides over 300,000 IOPS at 0.05ms. The Mangstor MX6300 challenges in QoS measurements but falls behind due to the 9100's superior performance scaling. The 9100 also musters impressive QoS metrics in the 32 OIO breakout, and though we do not present the chart, it leads the same test at 256 OIO.
You might notice that the Mangstor MX6300 is not in our power consumption charts, and that is due to its excessive power consumption requirements; it averages 40+W and can peak up to 60W. This outstrips our sensitive power testing equipment. In fact, it is the only storage device we have ever tested that exceeded the capabilities of the equipment we use for extended duration testing.
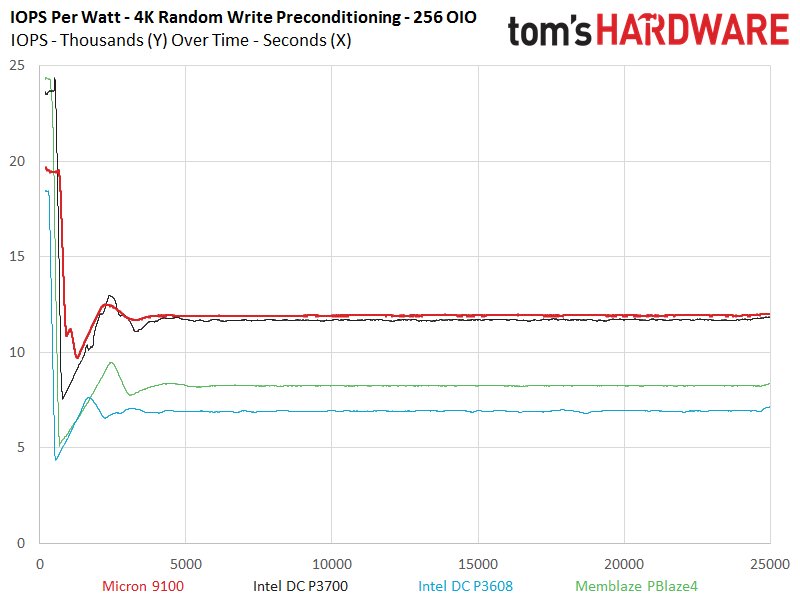
The Micron 9100 Max consumed more power than the competing devices, including the dual-SSD Intel DC P3608. However, when we compare the IOPS-per-Watt efficiency metrics, the 9100 leads the test pool. The DC P3608 scores the worst efficiency metrics, and it is noteworthy that it also requires host compute for the RAID overhead, which is almost impossible to quantify accurately in tandem with our slot measurements.
Get Tom's Hardware's best news and in-depth reviews, straight to your inbox.
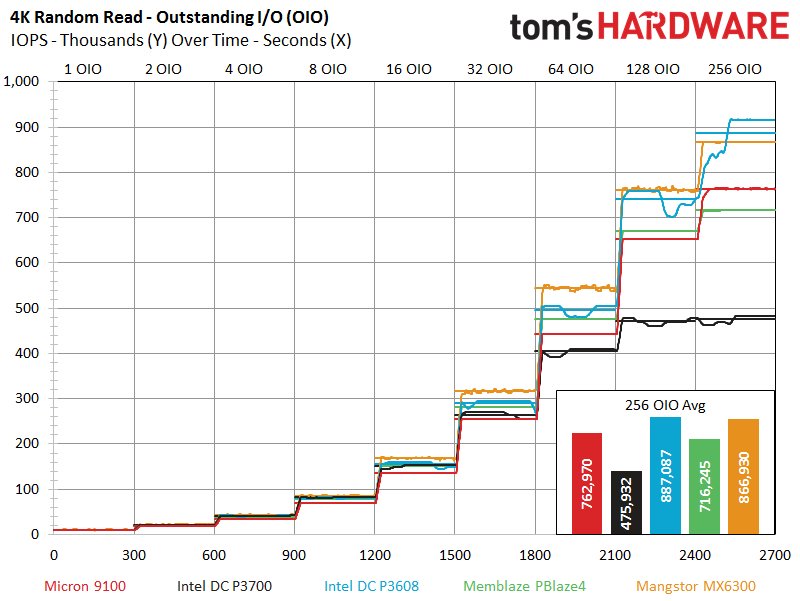
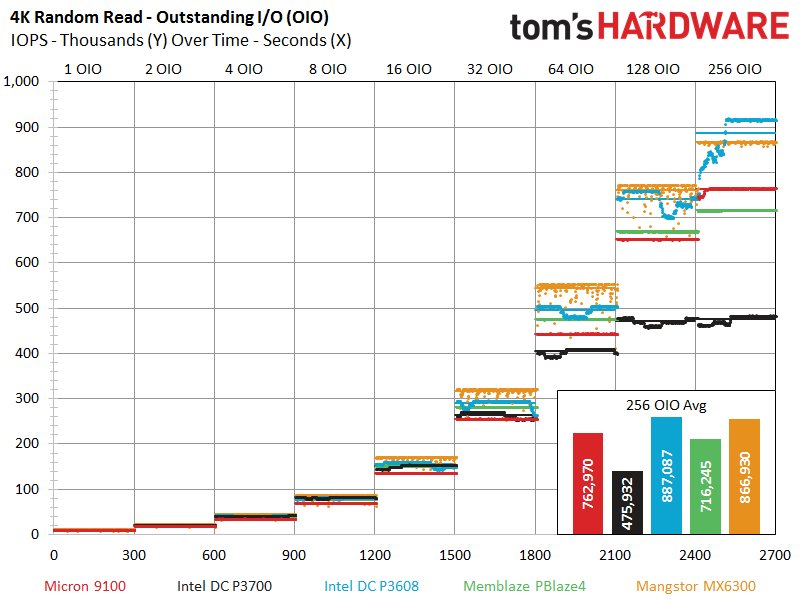
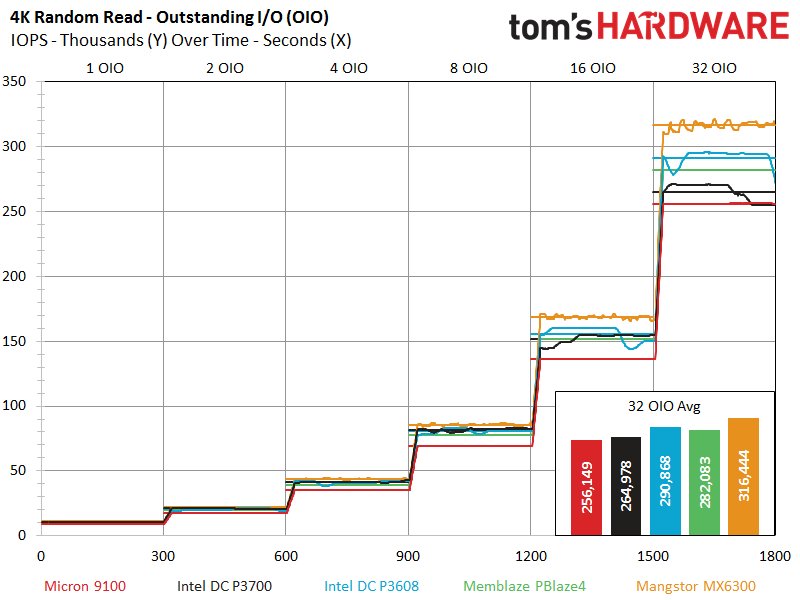
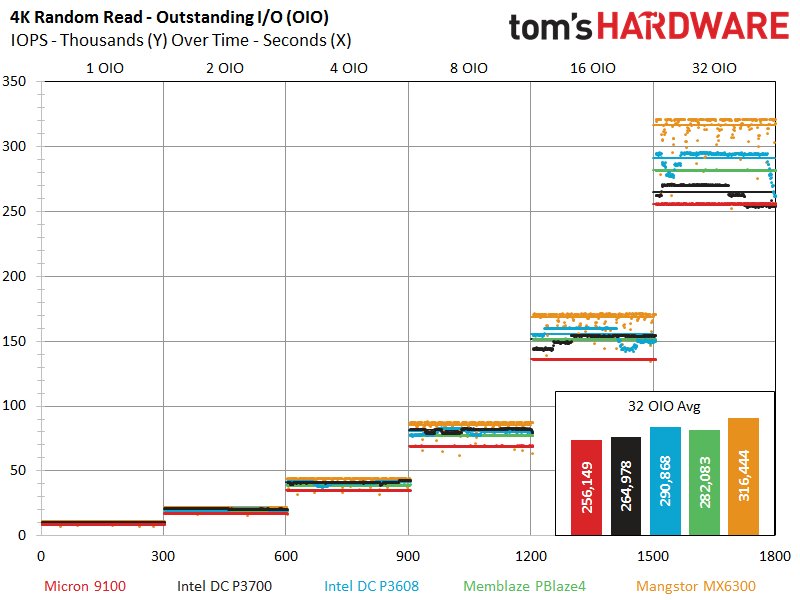
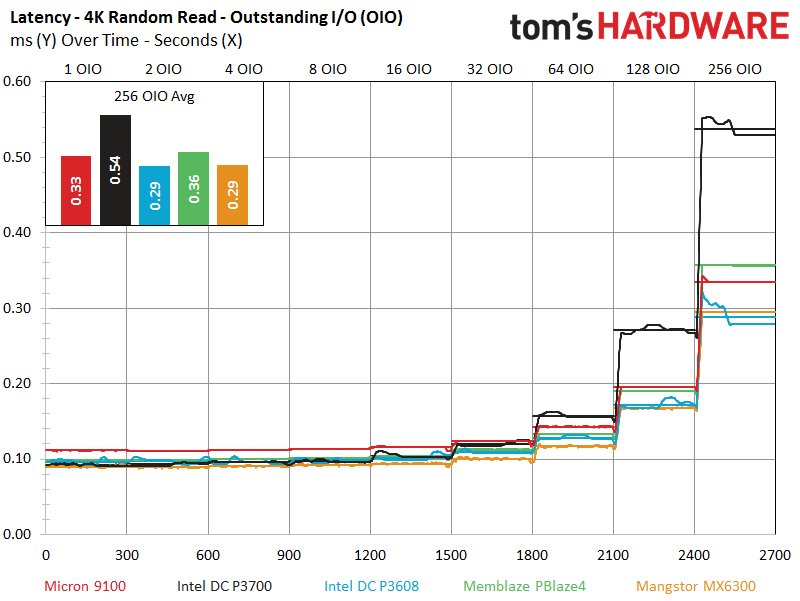
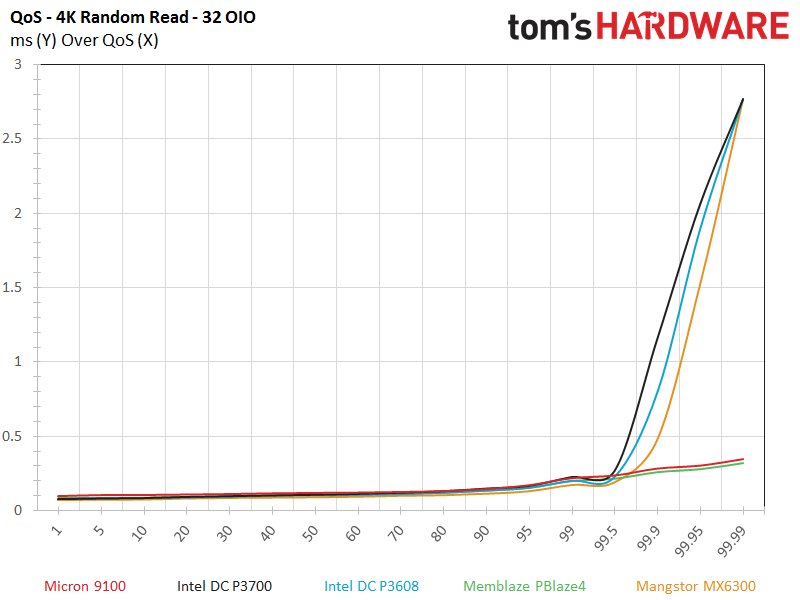
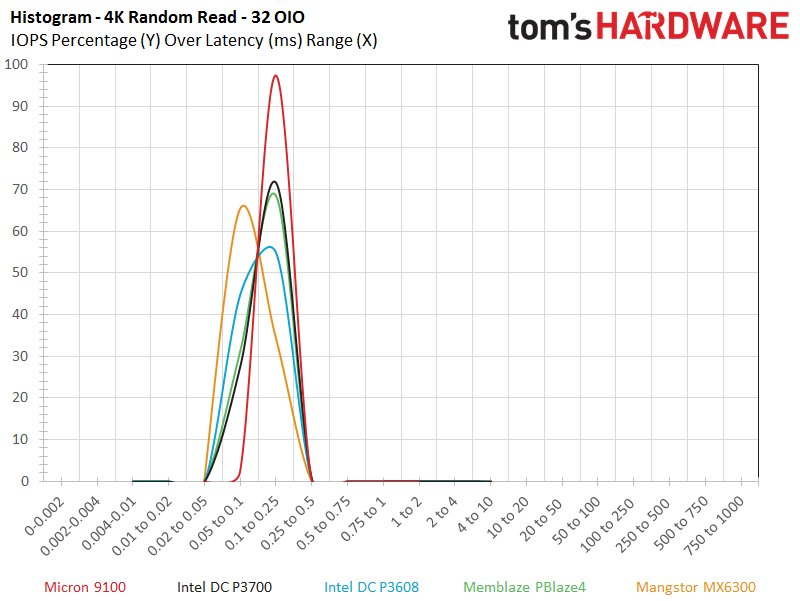
The Micron 9100 also provides impressive performance during our 4K random read workloads, but the DC P3608 and MX6300 manage to outpace it by roughly 100,000 IOPS at 256 OIO. The MX6300 suffers some read variability during the test, which is a somewhat odd occurrence with random read data. The Micron 9100 lags the competing devices from 1 to 32 OIO; it clearly is not at its best with lighter pure random read workloads.
The 9100 has an incrementally higher latency measurement from 1 to 32 OIO, which is evident in both our latency and latency-over-IOPS charts. In spite of its slightly higher latency the drive provides a much more consistent QoS profile under light workloads, as seen in the QoS-over-IOPS chart. In fact, its only rival is its Memblaze PBlaze4 cousin. Our QoS 32 OIO chart also highlights the superior performance in the most challenging percentiles.
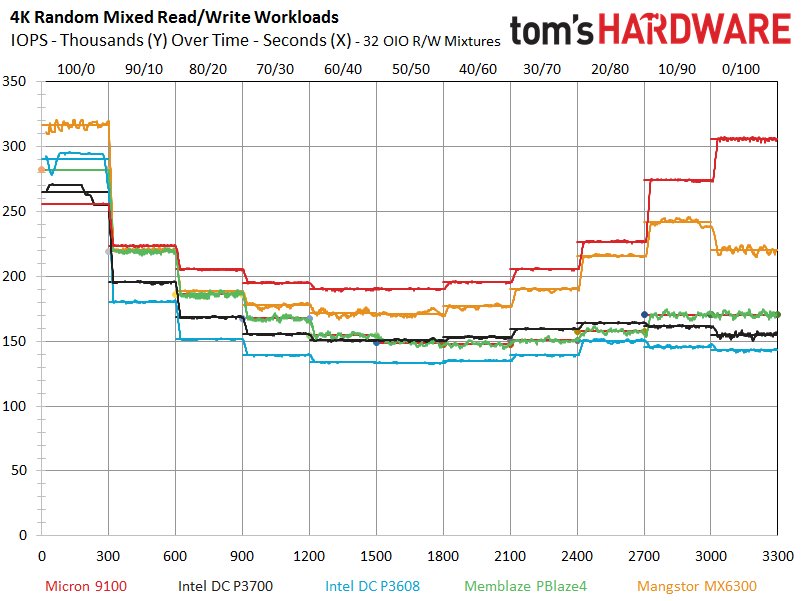
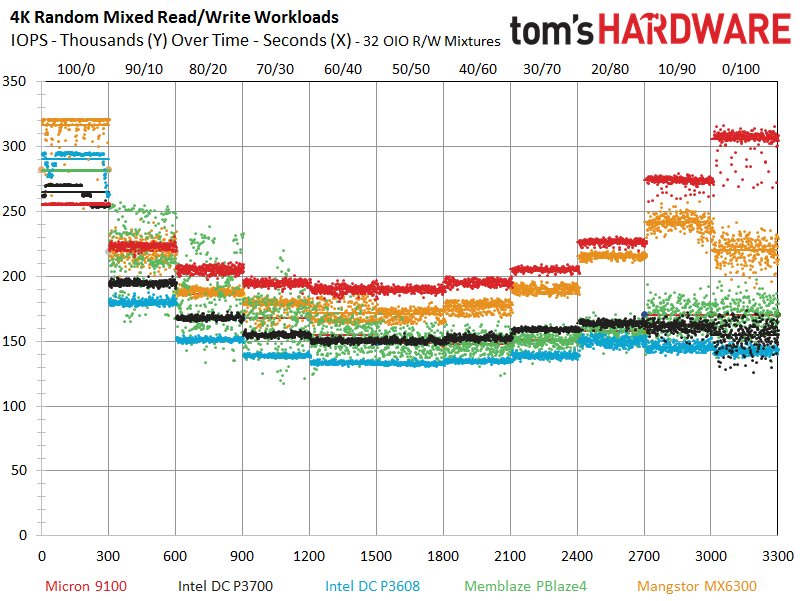
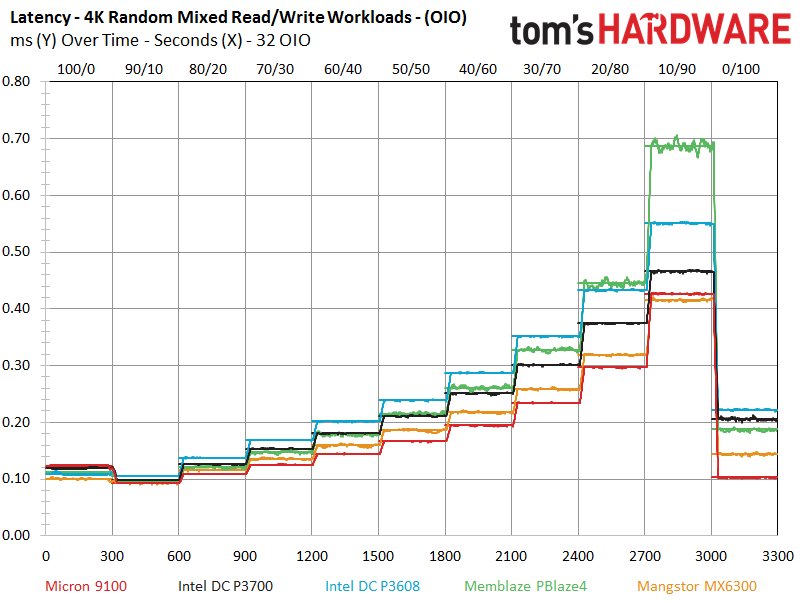
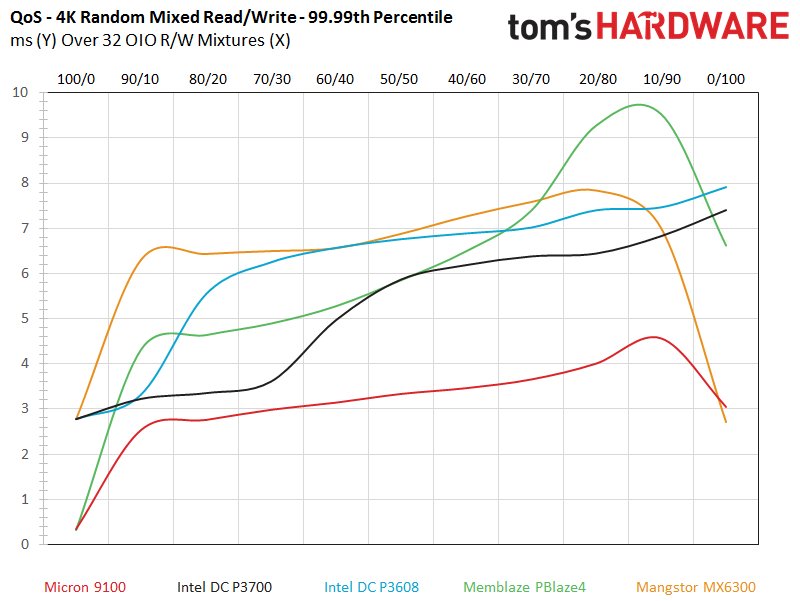
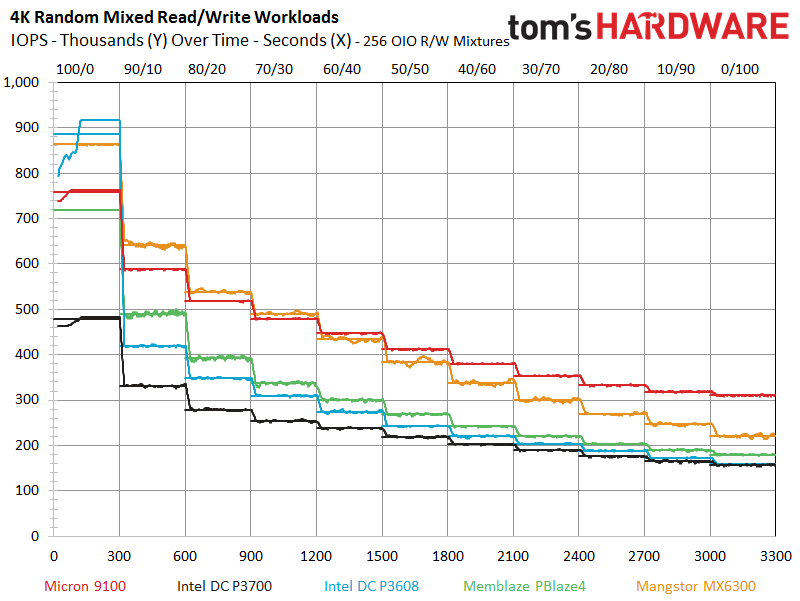
The mixed workload testing separates the wheat from the chaff, and the Micron 9100 takes the crown easily at 32 OIO. Usually, we observe SSDs with very high random read performance on the left side of the chart, but much lower performance as we mix in random write data as we progress to the right side of the chart (where the heavy write workloads reside). The Micron 9100 is the first SSD to offer more performance in the random write categories than it did in the random read workloads. The 9100 puts on an impressive show and wins 10 of the 11 mixtures, and adds class-leading QoS measurements to underscore the victory.
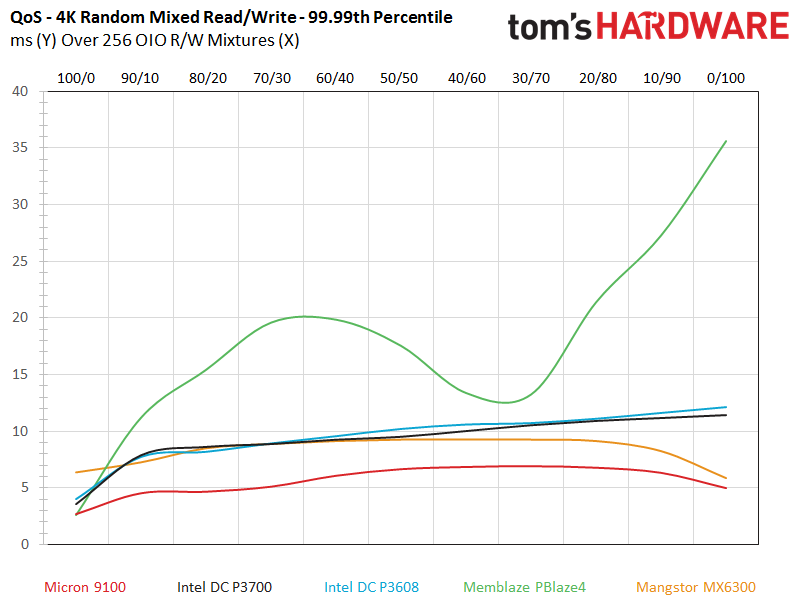
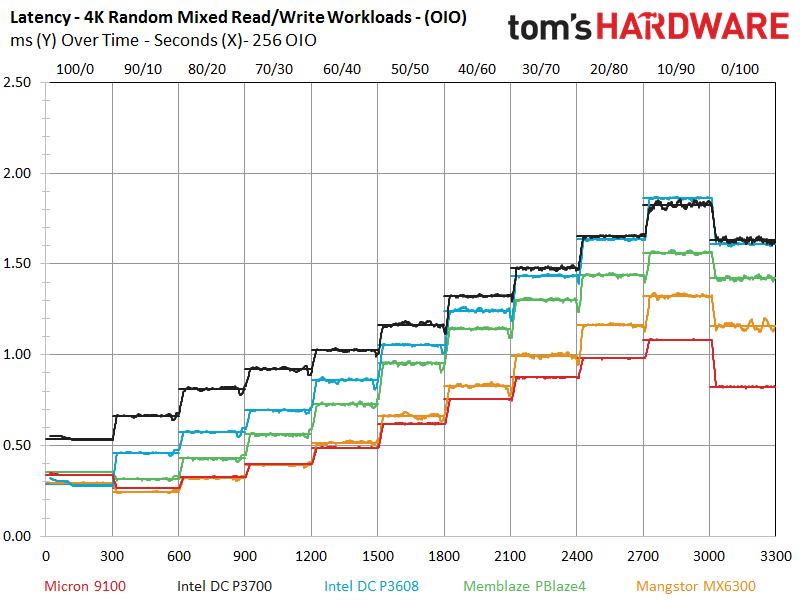
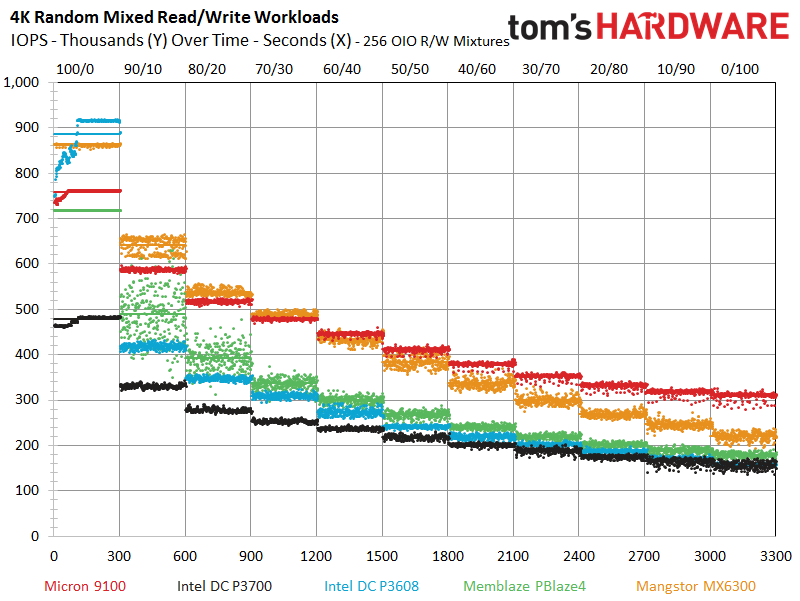
The 9100 also offers admirable performance in the 256 OIO tests, which are less relevant to the majority of applications but indicative of overall performance characteristics. The 9100 and MX6300 trade blows while the rest of the pack recedes into the background, but the 9100 prevails for the majority of the test. The 9100 offers startling performance clarity with very little variability. This shines through in the 256 OIO QoS measurements.
Current page: 4KB Random Read And Write
Prev Page Endurance Matters And Management Next Page 8KB Random Read And Write
Paul Alcorn is the Editor-in-Chief for Tom's Hardware US. He also writes news and reviews on CPUs, storage, and enterprise hardware.
-
Flying-Q If the flash packages are producing so much heat that they need such a massive heatsink, why is there only one? Surely the flash on the rear of the card would need heatsinking too, even just a flat plate would suffice?Reply -
Unolocogringo It appears the heatsink is more for the voltage converters and controller chip to me.Reply -
Paul Alcorn Reply18234127 said:If the flash packages are producing so much heat that they need such a massive heatsink, why is there only one? Surely the flash on the rear of the card would need heatsinking too, even just a flat plate would suffice?
This is a standard configuration, though there are a few SSDs that have rear plates. Thermal pads were more common with larger lithography NAND, 20nm, 25nm, etc, because it generated more heat. New smaller NAND, such as the 16nm here, draws less power and generates less heat. In fact, it was very common with old client SSDs to have a thermal pad on the NAND, whereas now they are relatively rare. I think that they may be relying upon reducing the heat enough on one side to help wick heat from the other side, but the heatsink is primarily for the controller and DRAM with the latest SSDs. Also, it may just be convenient to add additional thermal pads to the NAND to keep the spacing for the HS even across the board.