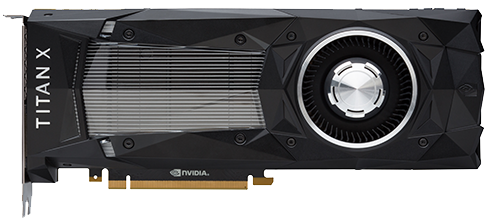
Nvidia Titan RTX Review: Gaming, Training, Inferencing, Pro Viz, Oh My!
Why you can trust Tom's Hardware
Performance Results: Pro Visualization
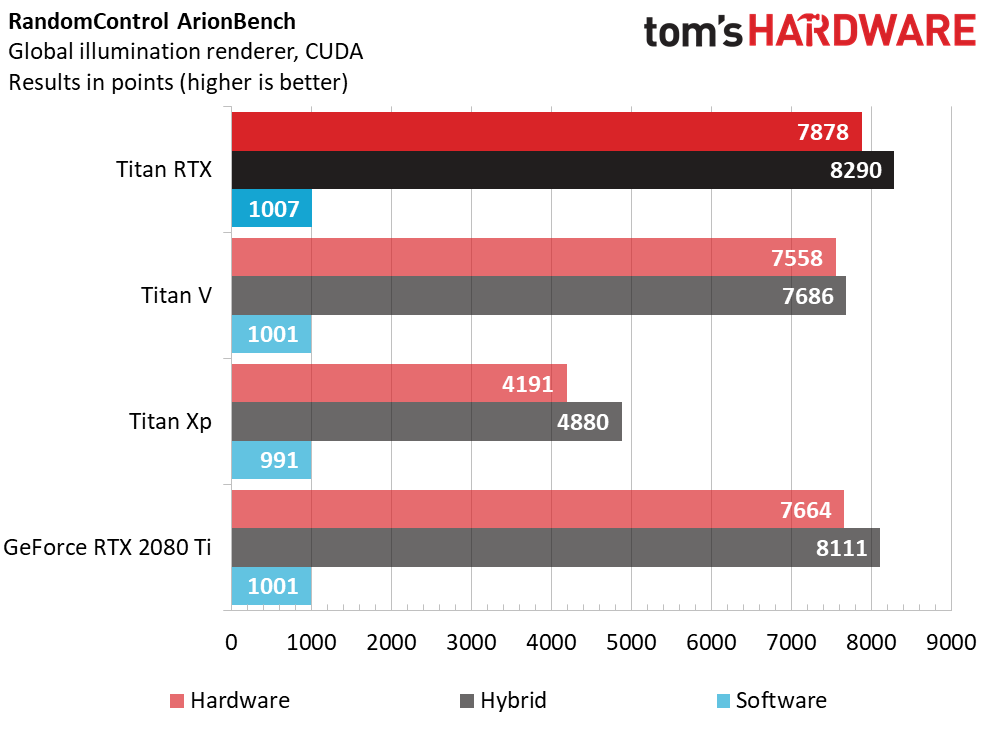
ArionBench
Madrid-based RandomControl offers the Arion Render physically-based path tracing render engine and ArionFX, composed of HDR image processing algorithms. ArionBench is meant as a proxy for the former, measuring GPU and CPU performance through a light simulation in a 3D scene.
The benchmark package includes executables for testing available GPUs, CPUs, and a hybrid combination of the two.
This CUDA-accelerated workload runs best on Titan RTX, followed by GeForce RTX 2080 Ti. Titan V trails the gaming card by about 100 points in the hardware-only test, while Titan Xp finishes far behind the more modern boards.
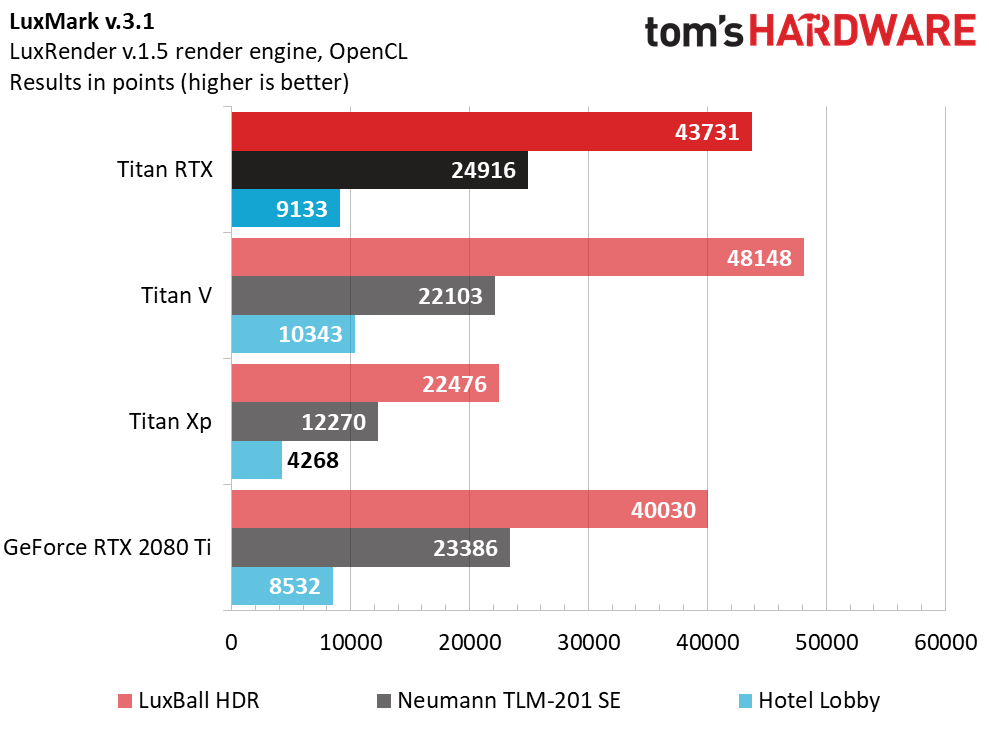
LuxMark v.3.1
The latest version of LuxMark is based on an updated LuxRender 1.5 render engine, which specifically incorporates OpenCL optimizations that invalidate comparisons to previous versions of the benchmark.
We tested all three scenes available in the 64-bit benchmark: LuxBall HDR (with 217,000 triangles), Neumann TLM-102 SE (with 1,769,000 triangles), and Hotel Lobby, with 4,973,000 triangles).
Turing and Volta GPUs trade blows depending on the scene you look at. Titan V scores a win in LuxBall and Hotel Lobby, while the two TU102-based boards score higher in Neumann TLM-102 SE. The main takeaway, however, seems to be that Titan Xp is limited to a fraction of the performance achieved by the newer cards.
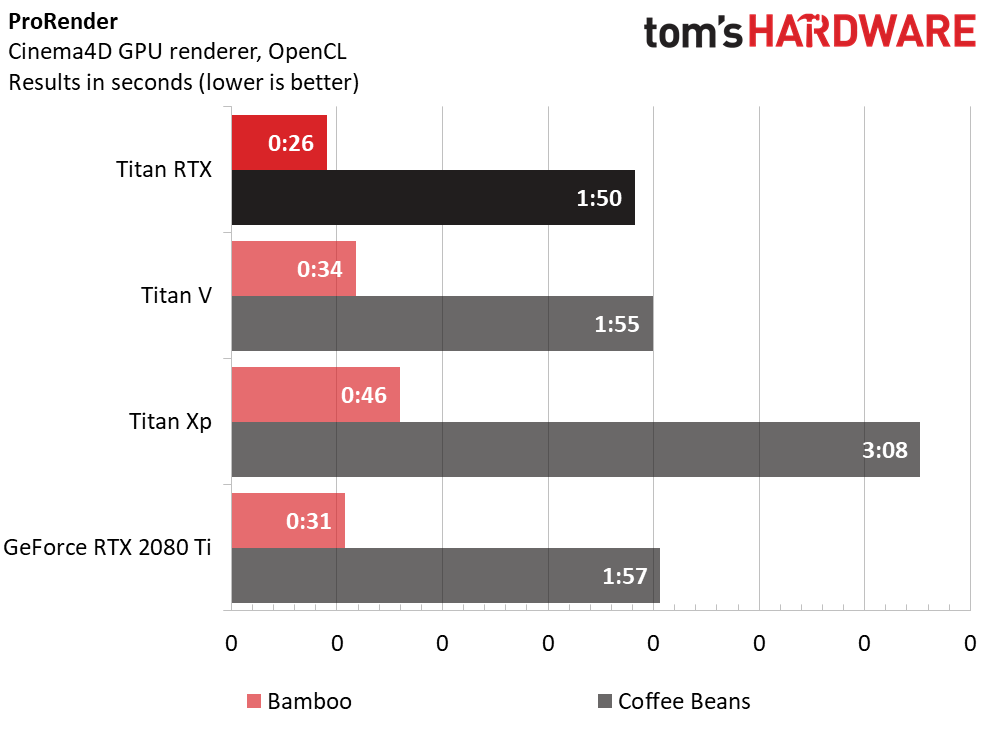
Cinema4D
ProRender is another physically-based GPU render engine. Unlike Arion Render, however, it utilizes OpenCL. It’s also biased, meaning the renderer’s output is based on estimations rather than pixel-by-pixel calculations. Arion Render is unbiased, performing calculations on every pixel and in turn taking longer.
Get Tom's Hardware's best news and in-depth reviews, straight to your inbox.
In both of our test scenes, Titan RTX is faster than its Nvidia-sourced competition.
On-board memory doesn’t seem to be a factor, since GeForce RTX 2080 Ti easily beats Titan Xp with 1GB less capacity. It’s more likely that Turing/Volta’s compute performance, increased number of schedulers, on-die SRAM advantage, and higher memory bandwidth convey big gains over the older Pascal architecture.
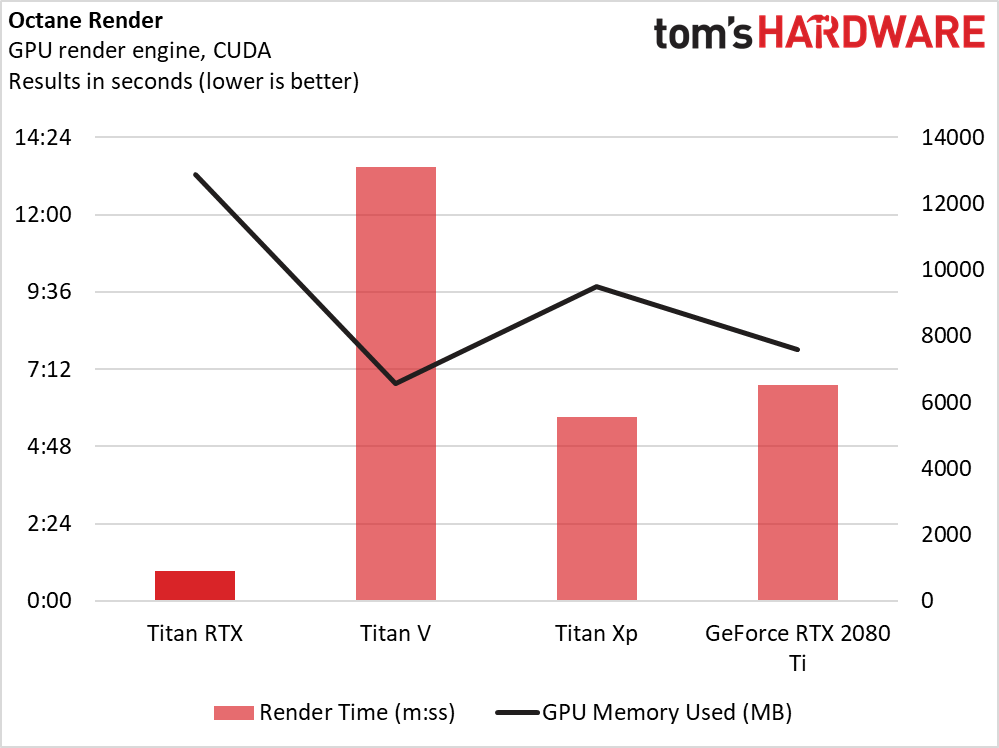
OctaneRender
The latest version of OTOY’s OctaneRender incorporates support for out-of-core geometry, meaning meshes and textures can be stored in system memory while the unbiased GPU renderer works at interactive speeds.
One of Titan RTX’s big selling points is its 24GB of GDDR6. Thus far, our benchmarks haven’t shown a need for that much on-board memory. However, the first test we ran in OctaneRender repeatedly crashed on Titan V and Titan Xp due to running out of memory. A simpler scene allowed us to create a valid comparison, but not before we got our first taste of capacity envy.
Just because we completed runs on the competing cards didn’t mean their outcomes made much sense, though. It’s plausible that GeForce RTX 2080 Ti’s 11GB put it at a disadvantage to Titan Xp’s 12GB, tipping the scale in favor of Pascal. However, Titan V shouldn’t have suffered such a high render time (and low memory utilization number) with just as much RAM. In bouncing ideas back and forth with Nvidia, we could only hypothesize an issue with Titan V’s HBM2 memory subsystem not playing nice with OctaneRender.
SPECviewperf 13
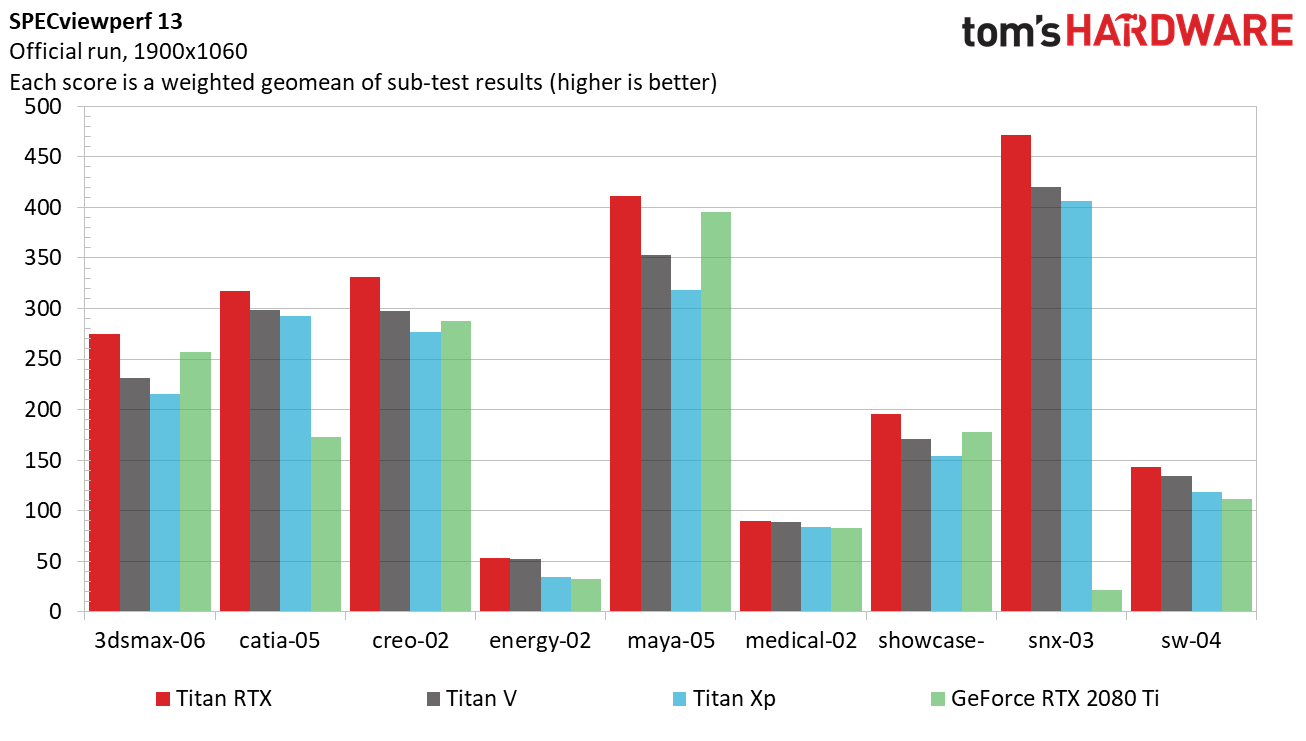
The most recent version of SPECviewperf employs traces from Autodesk 3ds Max, Dassault Systemes Catia, PTC Creo, Autodesk Maya, Autodesk Showcase, Siemens NX, and Dassault Systemes SolidWorks. Two additional tests, Energy and Medical, aren’t based on a specific application, but rather on datasets typical of those industries.
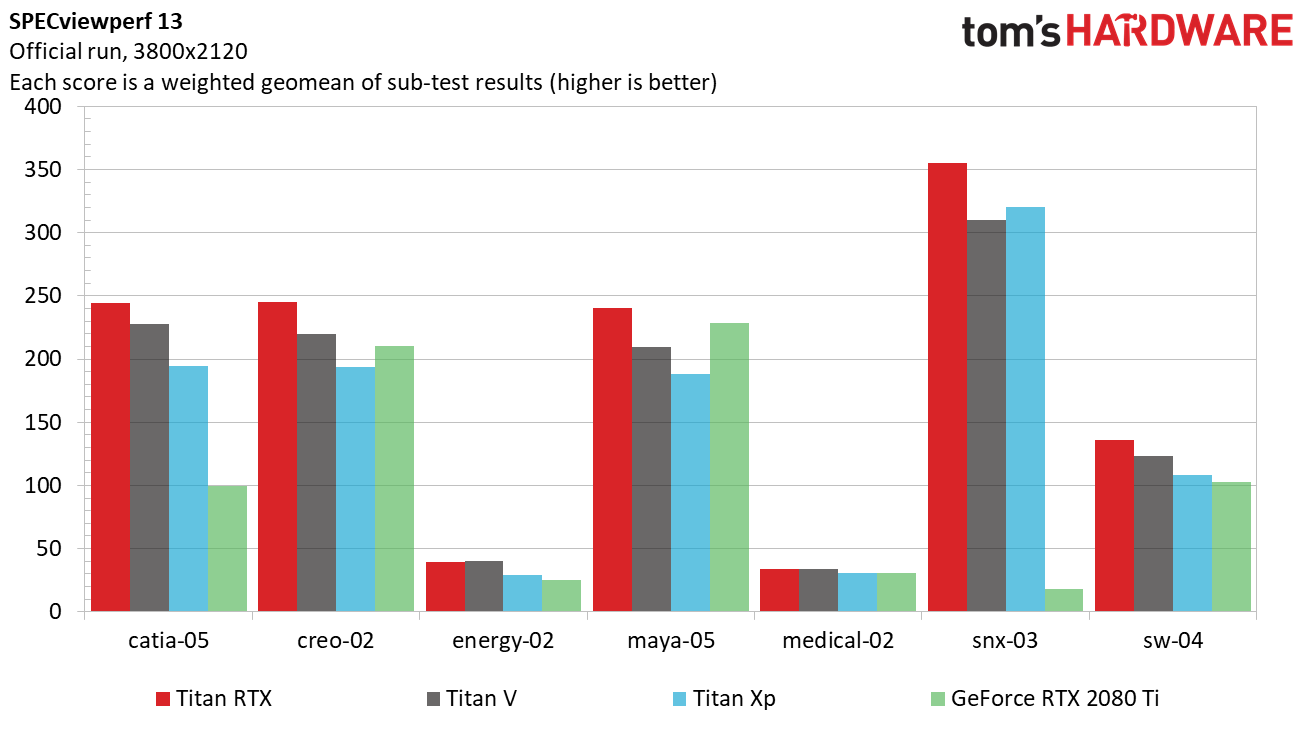
In some workloads, Nvidia’s DirectX driver allows GeForce RTX 2080 Ti to match or even exceed the performance of Titan V. But Catia and NX, specifically, respond well to the professional driver optimizations that benefit Titan cards. The GeForce even loses to the older Titan Xp in those workloads.
Across the board, Titan RTX beats the still-formidable Titan V.
Titan V scores a slight win in the Energy tests, but again succumbs to Titan RTX everywhere else once we step the resolution up to 3800x2120.
MORE: Best Graphics Cards
MORE: Desktop GPU Performance Hierarchy Table
MORE: All Graphics Content
Current page: Performance Results: Pro Visualization
Prev Page Nvidia Titan RTX Review Next Page Performance Results: Deep Learning-
AgentLozen This is a horrible video card for gaming at this price point but when you paint this card in the light of workstation graphics, the price starts to become more understandable.Reply
Nvidia should have given this a Quadro designation so that there is no confusion what this thing is meant for. -
bloodroses Reply21719532 said:This is a horrible video card for gaming at this price point but when you paint this card in the light of workstation graphics, the price starts to become more understandable.
Nvidia should have given this a Quadro designation so that there is no confusion what this thing is meant for.
True, but the 'Titan' designation was more so designated for super computing, not gaming. They just happen to game well. Quadro is designed for CAD uses, with ECC VRAM and driver support being the big difference over a Titan. There is quite a bit of crossover that does happen each generation though, to where you can sometimes 'hack' a Quadro driver onto a Titan
https://www.reddit.com/r/nvidia/comments/a2vxb9/differences_between_the_titan_rtx_and_quadro_rtx/ -
madks Is it possible to put more training benchmarks? Especially for Recurrent Neural Networks (RNN). There are many forecasting models for weather, stock market etc. And they usually fit in less than 4GB of vram.Reply
Inference is less important, because a model could be deployed on a machine without a GPU or even an embedded device. -
mdd1963 Reply21720515 said:Just buy it!!!
Would not buy it at half of it's cost either, so...
:)
The Tom's summary sounds like Nviidia payed for their trip to Bangkok and gave them 4 cards to review....plus gave $4k 'expense money' :)
-
alextheblue So the Titan RTX has roughly half the FP64 performance of the Vega VII. The same Vega VII that Tom's had a news article (that was NEVER CORRECTED) that bashed it for "shipping without double precision" and then later erroneously listed the FP64 rate at half the actual rate? Nice to know.Reply
https://www.tomshardware.com/news/amd-radeon-vii-double-precision-disabled,38437.html
There's a link to the bad news article, for posterity.
