Review: 20" LCD S-IPS Panels
The Principle
The LaCie spectrum analyzer is a pallet set on the screen. When you run the application, it will prompt you to adjust brightness and contrast manually using the chart that follows.
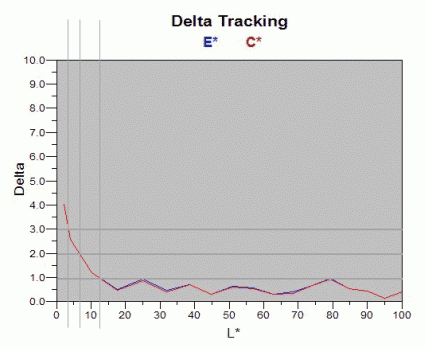
Calibration produces a DeltaE graph. This gives the difference between the color requested and the one the monitor actually produces. A DeltaE of 1 or less means calibration is perfect. There will be no noticeable difference between the original color and the end one. You can only say you have a problem when DeltaE = 3; at this level, the human eye can tell the difference between two shades. LaCie reckons calibration is successful if DeltaE is 2 or less.
On the X-axis, values range from black (0) to white (100).
In the reference graph above, this means:
- DeltaE <3 = 97% of the colors, from dark gray to white, were adequately displayed.
- Delta E <2 = 95% of the colors displayed are good enough to be considered true.
- DeltaE <1 = 92% of the colors are perfectly reproduced on screen.
- Delta E >3 = 3% of the colors displayed are not true. The darkest (including black) are absolutely impossible to reproduce (zone with no curve).
To compare the curves on the test monitors with those of our two reference ones, a CRT and an LCD by LaCie.
Get Tom's Hardware's best news and in-depth reviews, straight to your inbox.
