Seven 650i SLI Motherboards Compared
Performance Summary
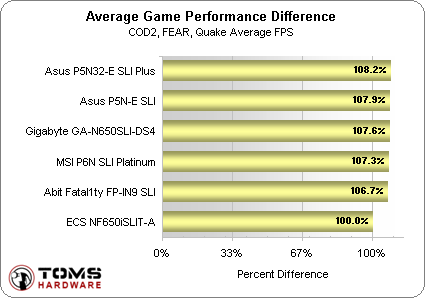
Charts showing the exact performance difference between each board more accurately summarize their capabilities. For games, the total frames per second from all three tests were added together for each board, and the result divided by the FPS of the lowest board. This method shows "100%" for the slowest board and the percent gained by comparison for faster boards.
Five of the boards were nearly identical in performance, with the least of these over 6% faster than the NF650iSLIT-A. The worst performer is handicapped by its permanently-fixed dual x8 graphics card pathways, while others were set to single x16 mode rather than dual x8 mode. Another exception is the P5N32-E SLI Plus, because its different Southbridge allows x16 mode to two slots. The P5N32-E SLI Plus is also clocked slightly higher than the competition, at 267.3 MHz rather than the proper 266.7 MHz, and adjusting for that difference drops its lead over the slowest board to 107.9%
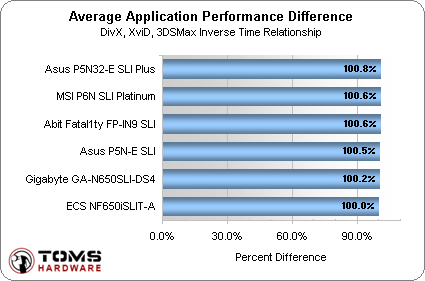
Timed applications show the greatest performance as the least time needed to complete a task, thus the highest total time sets the slow point, and it must be divided by the total times of each board to determine the percent performance gained.
The race got tighter in applications benchmarks because graphics performance isn't a factor. Correcting for the P5N32-E SLI Plus' extra clock speed gives it only a 100.6% lead over the slowest board, identical to the P6N SLI Platinum and Abit Fatal1ty FP-IN9 SLI.
Current page: Performance Summary
Prev Page Synthetic, Continued Next Page Performance Summary, ContinuedGet Tom's Hardware's best news and in-depth reviews, straight to your inbox.


