Asus ROG Swift PG278Q 27-inch G-Sync Monitor Review
We’ve been waiting to experience the wonders of G-Sync for months, and Asus is the first company to deliver a finished product. Its ROG Swift PG278Q is a 27-inch QHD TN-based display with G-Sync, 144 Hz operation, and ULMB, a new blur-reduction feature.
Results: Brightness and Contrast
Uncalibrated
Before calibrating any panel, we measure zero and 100-percent signals at both ends of the brightness control range. This shows us how contrast is affected at the extremes of a monitor's luminance capability. We do not increase contrast past the clipping point. While doing this would increase a monitor’s light output, the brightest signal levels would not be visible, resulting in crushed highlight detail. Our numbers show the maximum light level possible with no clipping of the signal.
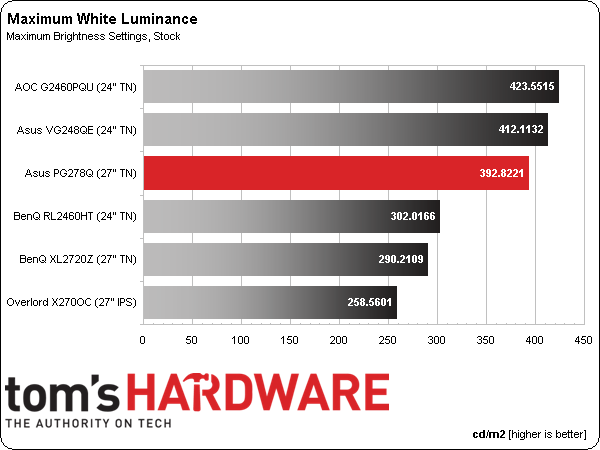
The comparison group today consists of gaming-oriented monitors running at 120 or 144 Hz, with the exception of BenQ’s RL2460HT, which tops out at 60 Hz. We have Asus’ VG248QE, BenQ’s XL2720Z, AOC’s G2460PQU, and the lone IPS screen, an Overlord Tempest X270OC.
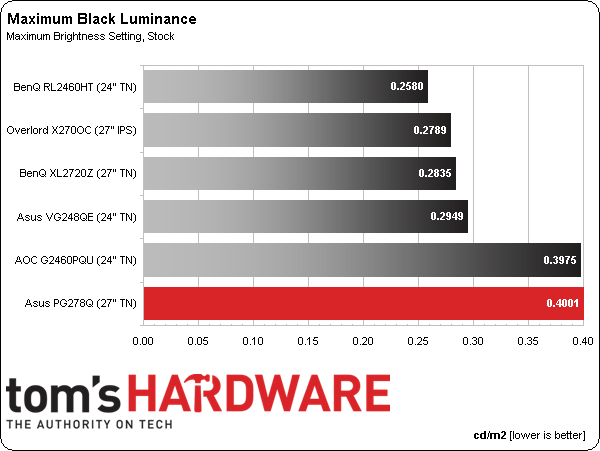
A gaming monitor, especially one with a backlight strobe, needs plenty of output. Asus' PG278Q delivers. It’s rated at 350 cd/m2, but we measured nearly 400 in our test. Of course, enabling ULMB drops this figure by about 57 percent.
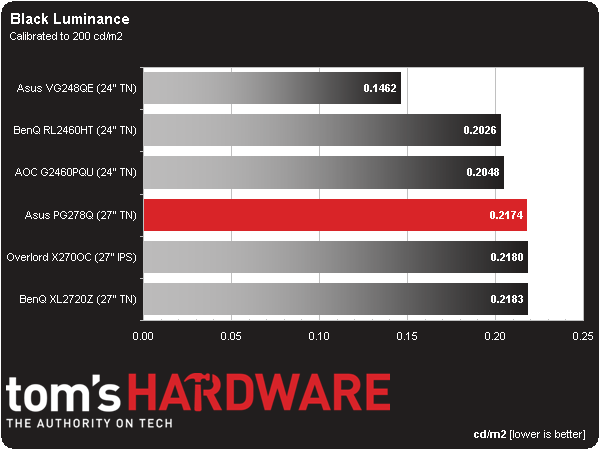
A bright backlight usually means an elevated black level. The Swift just cracks the .4 cd/m2 mark, similar to the brightest competitor, AOC’s G2460PQU.
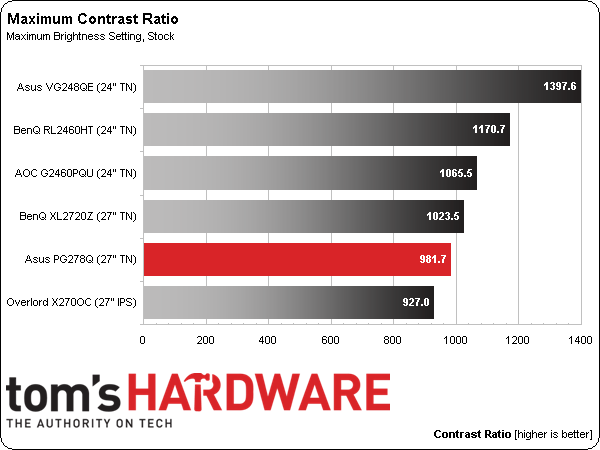
Contrast is pretty solid at just under 1000 to 1. And as we'll point out in subsequent tests, it stays fairly consistent regardless of brightness or level of blur-reduction.
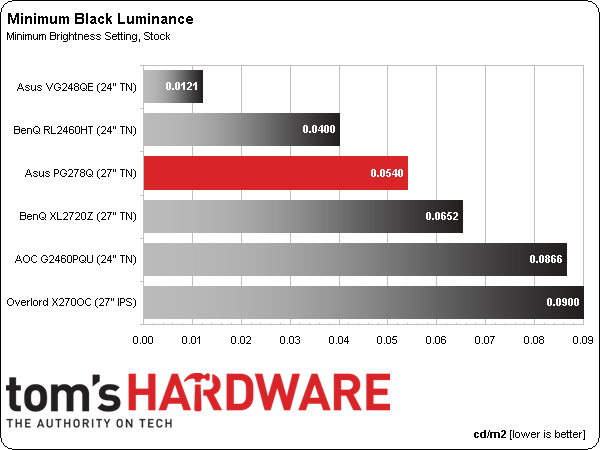
We believe 50 cd/m2 is a practical minimum standard for screen brightness. Any lower and you risk eyestrain and fatigue. The PG278Q bottoms out at 51.9157 cd/m2. This is a great light level for playing games in total darkness as long as you don’t use the ULMB feature. As you’ll see below, black levels and contrast hold up extremely well too.
Minimum output is right in the middle of the group at .0540 cd/m2. The main takeaway is that IPS is still a bit behind TN in the black level department.
Get Tom's Hardware's best news and in-depth reviews, straight to your inbox.
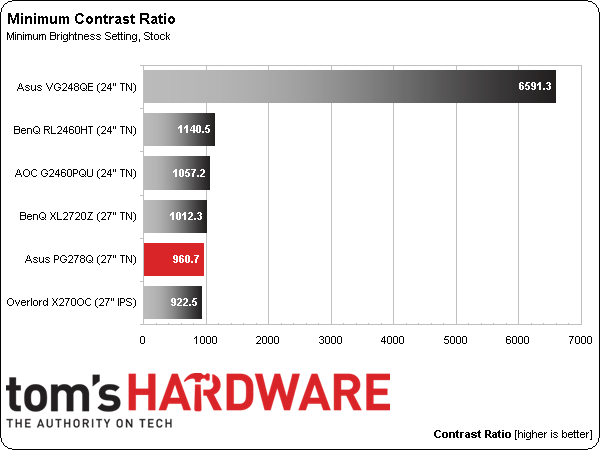
Contrast remains consistent at 960.7 to 1. You’re able to use the Swift in pretty much any room environment we can think of. And you can tailor the brightness to your preference without having to worry about a contrast sweet spot.
After Calibration
Since we consider 200 cd/m2 to be an ideal point for peak output, we calibrate all of our test monitors to that value. In a room with some ambient light (like an office), you get a sharp, punchy image with maximum detail and minimum eye fatigue. On many monitors, this is also the sweet spot for gamma and grayscale tracking, which we'll look at on the next page.
In a dark room, many professionals prefer a 120 cd/m2 calibration. We have found it makes little to no difference on the calibrated black level and contrast measurements, though.
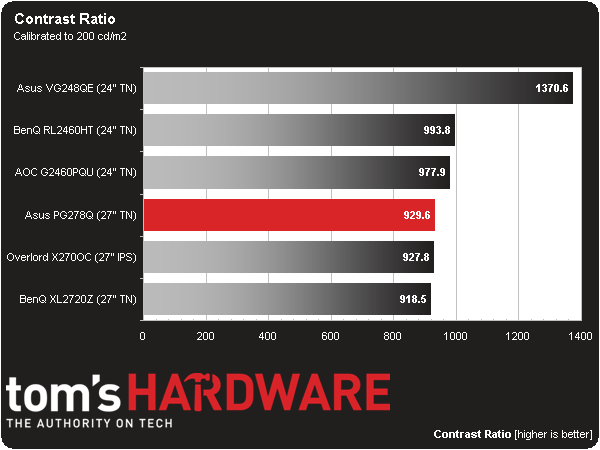
Calibration has little effect on black level or contrast. The adjustments we made were small, so the result is not surprising.
We only took a slight hit to contrast with a final value of 929.6 to 1. That's mainly because we can only reduce the RGB levels, not increase them. It’s always best if the controls start at their center positions.
ANSI Contrast Ratio
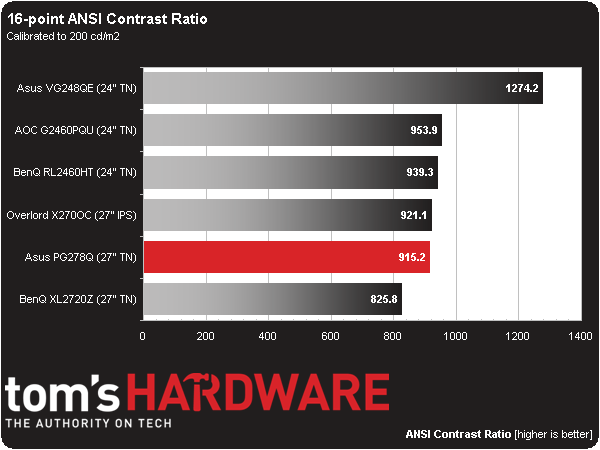
Another important measure of contrast is ANSI. To perform this test, a checkerboard pattern of sixteen zero and 100-percent squares is measured, yielding a somewhat more real-world metric than on/off readings because we see a display’s ability to simultaneously maintain both low black and full white levels, factoring in screen uniformity, too. The average of the eight full-white measurements is divided by the average of the eight full-black measurements to arrive at the ANSI result.
The PG278Q finishes fifth in an extremely tight race. Those middle four screens will look identical to the naked eye, though, and 915.2 to 1 is a solid result. This display shows excellent build quality and an image with good depth and dimension.
Current page: Results: Brightness and Contrast
Prev Page Measurement And Calibration Methodology: How We Test Next Page Results: Grayscale Tracking and Gamma Response
Christian Eberle is a Contributing Editor for Tom's Hardware US. He's a veteran reviewer of A/V equipment, specializing in monitors. Christian began his obsession with tech when he built his first PC in 1991, a 286 running DOS 3.0 at a blazing 12MHz. In 2006, he undertook training from the Imaging Science Foundation in video calibration and testing and thus started a passion for precise imaging that persists to this day. He is also a professional musician with a degree from the New England Conservatory as a classical bassoonist which he used to good effect as a performer with the West Point Army Band from 1987 to 2013. He enjoys watching movies and listening to high-end audio in his custom-built home theater and can be seen riding trails near his home on a race-ready ICE VTX recumbent trike. Christian enjoys the endless summer in Florida where he lives with his wife and Chihuahua and plays with orchestras around the state.
-
TechyInAZ Nice! This is great since I am one of those picky guys that believes that 30fps doesn't bring a good enough gaming experience.Reply
But one thing I do hope for is a 144hz g-sync IPS monitor, ever since I've gotten my new Asus MX239H the ips makes a huge difference in games.
But besides that, it is a glorious monitor, resolution is great, 144hz, and of course g sync makes it a wonderful monitor.
But really $800? I know that it is one of the few g sync equipped monitors, but you can buy a 4k monitor for $650! -
CraigN Yes - please fix that Amazon link. I almost shat myself thinking that was available already.Reply
-
apertotes Anybody knows if the incompatibility between G-Sync and ULMB is something that will get fixed or is here to stay?Reply -
CraigN Reply13933468 said:Anybody knows if the incompatibility between G-Sync and ULMB is something that will get fixed or is here to stay?
Pretty unlikely. ULMB requires a static refresh rate, because it has to strobe the monitor at a constant rate. GSYNC would mean that it would have to strobe in time with each frame, at a variable rate. You would introduce a lag time on the strobing if you tried to do this, since it would be at a variable rate instead of a constant one. -
rh_dog I know it's expensive for 2560x1440, I know it's not IPS, but to get the refresh rate @144hz and the 1ms g2g and g-sync? The few reviews for this monitor that are out there are all glowing. Come on, Asus, release the thing already, I've been waiting since the Jan announcement for this monitor. Shut up and take my money!!!Reply -
Rendezvous Omg! I need this now..... I alrdy have 800 set aside for it...I need a exact release date now!Reply -
agentbb007 Asus has said on Twitter it should be in the US by the end of August. I can't wait for this, I'm checking newegg everyday to see when it shows up! I hope they have enough of these coming in because there seems to be a lot of people waiting to buy this monitor.Reply
