Asus ROG Swift PG278Q 27-inch G-Sync Monitor Review
We’ve been waiting to experience the wonders of G-Sync for months, and Asus is the first company to deliver a finished product. Its ROG Swift PG278Q is a 27-inch QHD TN-based display with G-Sync, 144 Hz operation, and ULMB, a new blur-reduction feature.
Results: Viewing Angles and Uniformity
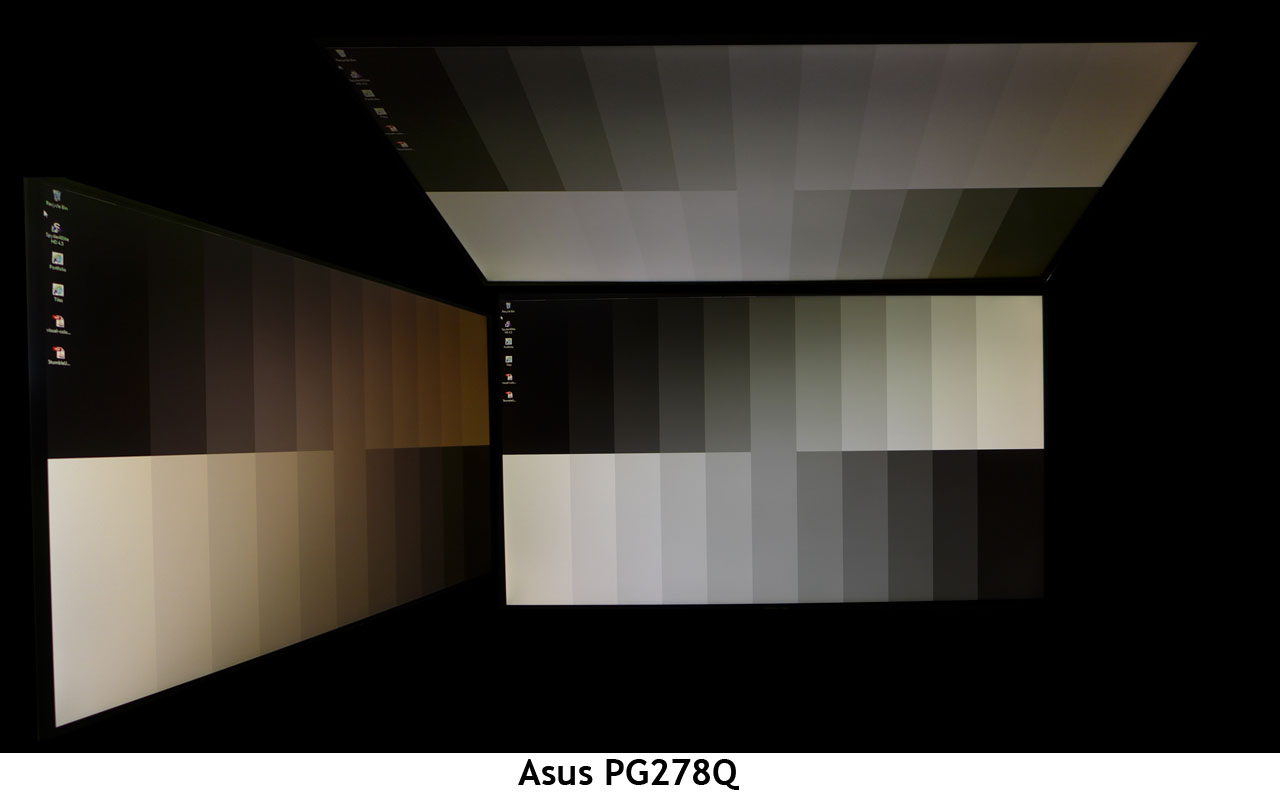
The more monitors we test, the more we can see that off-axis viewing performance is dependent not only on pixel structure (IPS, PLS, TN, etc.) but the backlight technology as well. And we can see that the anti-glare layer makes a difference too.
Despite solid performance numbers and its cutting-edge G-Sync technology, Asus' PG278Q still suffers from the poor off-axis image quality inherent to TN-based monitors. The side view is heavily shifted towards red and the luminance is cut in half. From the top, detail holds up a little better than other TN displays we’ve photographed. But image depth is still compromised.
To get the most from this screen, place its center exactly at eye level, tilt it back slightly, and sit about two feet away.
Screen Uniformity: Luminance
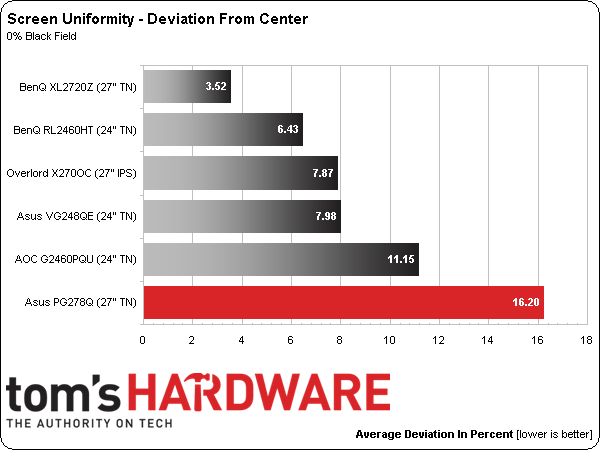
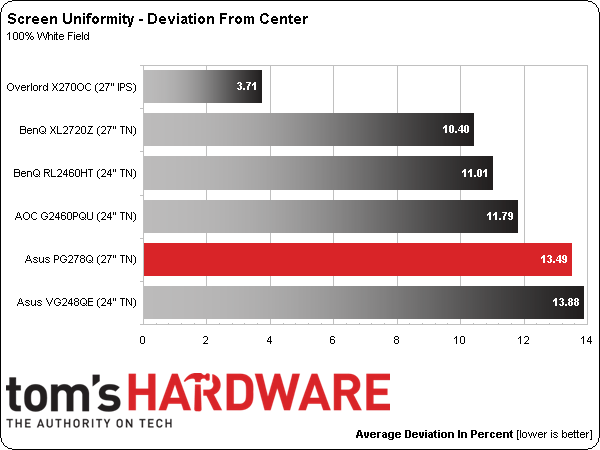
To measure screen uniformity, zero and 100-percent full-field patterns are used, and nine points are sampled. First, we establish a baseline measurement at the center of each monitor. Then the surrounding eight points are measured. Their values get expressed as a percentage of the baseline, either above or below. This number gets averaged. It is important to remember that we only test the review sample each vendor sends us. Other examples of the same monitor can measure differently in this metric.
First up is black field uniformity.
Screen uniformity is a bit less consistent with most TN monitors, and our sample does show a little visible light bleed. The problem areas for us are in the upper-right and center zones. You can see the hotspots in a black field pattern, though not in actual content.
Here’s the white field measurement:
Get Tom's Hardware's best news and in-depth reviews, straight to your inbox.
The white field pattern looks better, demonstrating a single hotspot in the center. It’s pretty subtle and we could only see it with our i1Pro, not our eyes.
Screen Uniformity: Color
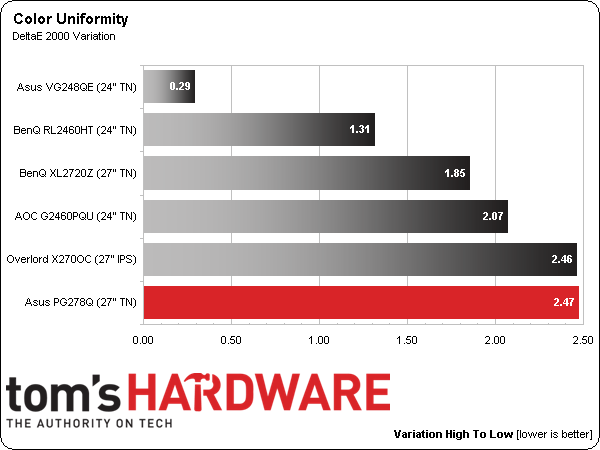
To measure color uniformity, we display an 80-percent white field and measure the Delta E error of the same nine points on the screen. Then we simply subtract the lowest value from the highest to arrive at the result. A smaller number means a display is more uniform. Any value below three means a variation that is invisible to the naked eye.
Color uniformity stays below the visibility threshold with a 2.47 Delta E result. The errors range from 3.01 in the upper-right to a low of .57 in the center.
Current page: Results: Viewing Angles and Uniformity
Prev Page Results: Color Gamut and Performance Next Page Results: Pixel Response, Input Lag and Blur Reduction
Christian Eberle is a Contributing Editor for Tom's Hardware US. He's a veteran reviewer of A/V equipment, specializing in monitors. Christian began his obsession with tech when he built his first PC in 1991, a 286 running DOS 3.0 at a blazing 12MHz. In 2006, he undertook training from the Imaging Science Foundation in video calibration and testing and thus started a passion for precise imaging that persists to this day. He is also a professional musician with a degree from the New England Conservatory as a classical bassoonist which he used to good effect as a performer with the West Point Army Band from 1987 to 2013. He enjoys watching movies and listening to high-end audio in his custom-built home theater and can be seen riding trails near his home on a race-ready ICE VTX recumbent trike. Christian enjoys the endless summer in Florida where he lives with his wife and Chihuahua and plays with orchestras around the state.
-
TechyInAZ Nice! This is great since I am one of those picky guys that believes that 30fps doesn't bring a good enough gaming experience.Reply
But one thing I do hope for is a 144hz g-sync IPS monitor, ever since I've gotten my new Asus MX239H the ips makes a huge difference in games.
But besides that, it is a glorious monitor, resolution is great, 144hz, and of course g sync makes it a wonderful monitor.
But really $800? I know that it is one of the few g sync equipped monitors, but you can buy a 4k monitor for $650! -
CraigN Yes - please fix that Amazon link. I almost shat myself thinking that was available already.Reply
-
apertotes Anybody knows if the incompatibility between G-Sync and ULMB is something that will get fixed or is here to stay?Reply -
CraigN Reply13933468 said:Anybody knows if the incompatibility between G-Sync and ULMB is something that will get fixed or is here to stay?
Pretty unlikely. ULMB requires a static refresh rate, because it has to strobe the monitor at a constant rate. GSYNC would mean that it would have to strobe in time with each frame, at a variable rate. You would introduce a lag time on the strobing if you tried to do this, since it would be at a variable rate instead of a constant one. -
rh_dog I know it's expensive for 2560x1440, I know it's not IPS, but to get the refresh rate @144hz and the 1ms g2g and g-sync? The few reviews for this monitor that are out there are all glowing. Come on, Asus, release the thing already, I've been waiting since the Jan announcement for this monitor. Shut up and take my money!!!Reply -
Rendezvous Omg! I need this now..... I alrdy have 800 set aside for it...I need a exact release date now!Reply -
agentbb007 Asus has said on Twitter it should be in the US by the end of August. I can't wait for this, I'm checking newegg everyday to see when it shows up! I hope they have enough of these coming in because there seems to be a lot of people waiting to buy this monitor.Reply


