Sapphire Nitro+ Radeon RX Vega 56 8GB Review: It's Time to Challenge Turing
Why you can trust Tom's Hardware
Temperatures, Clock Rates and Fan Speeds
Gaming
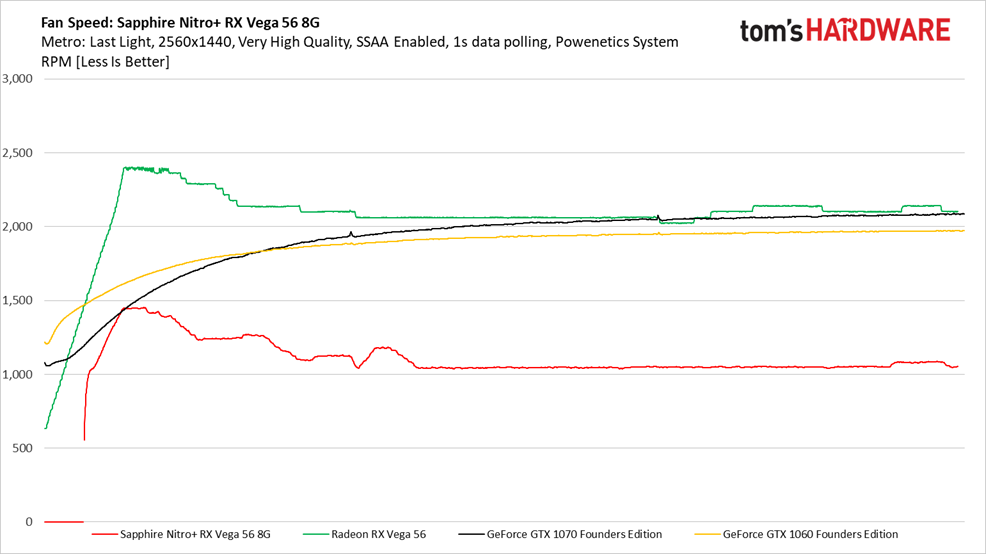
Sapphire’s thermal solution is massive. As a result, the Nitro+ RX Vega 56’s fans can sit idle for a few seconds before AMD’s Vega 10 GPU requires active cooling. At that point, they spin up quickly, peaking at about 1,450 RPM before slowing back down. By the end of our benchmark, the fans only spin at around 1,050 RPM. In comparison, the reference Radeon RX Vega 56 settles at ~2,100 RPM after similarly spiking and cooling off.
Both GeForce cards ramp up more gracefully and stabilize at fan speeds below AMD’s reference Radeon RX Vega 56. Even they top out well beyond Sapphire’s Nitro+ RX Vega 56, though.
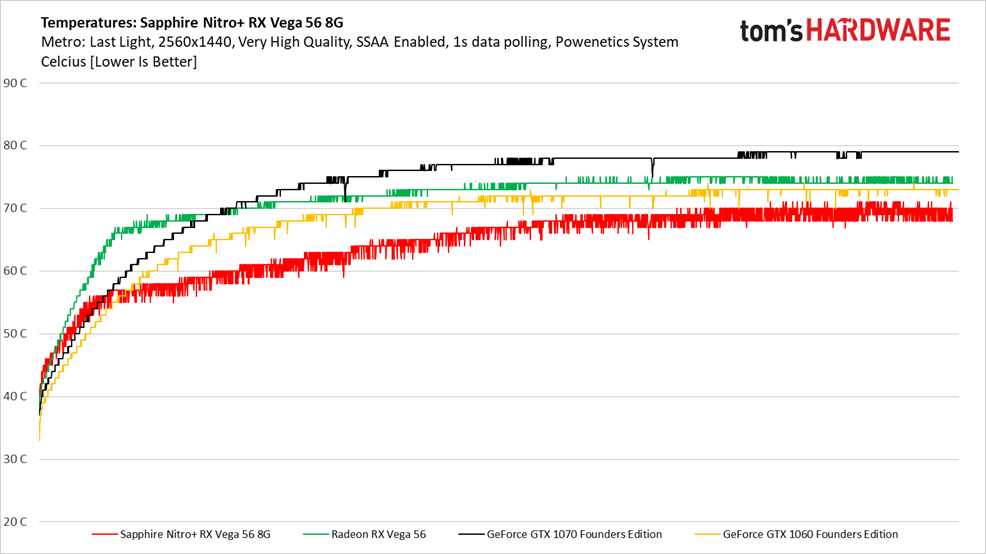
The Sapphire card’s temperature rises quickly in passive mode but slows its ascent once the fans kick on. By the end of our Metro: Last Light benchmark sequence, AMD’s Vega 10 GPU hovers right around 70°C. That’s lower than any other card in our comparison.
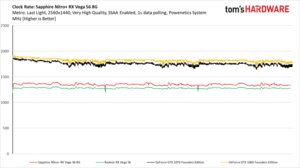
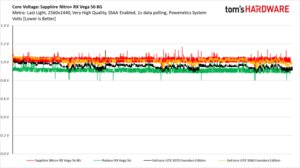
Sapphire must dial in a higher voltage than AMD’s reference Radeon RX 56 to maintain its clock rate advantage through our real-world gaming benchmark. As our fan speed and temperature testing shows, though, it can afford to do so. Despite more aggressive settings, the Nitro+ RX Vega 56 8G runs cooler and quieter.
FurMark
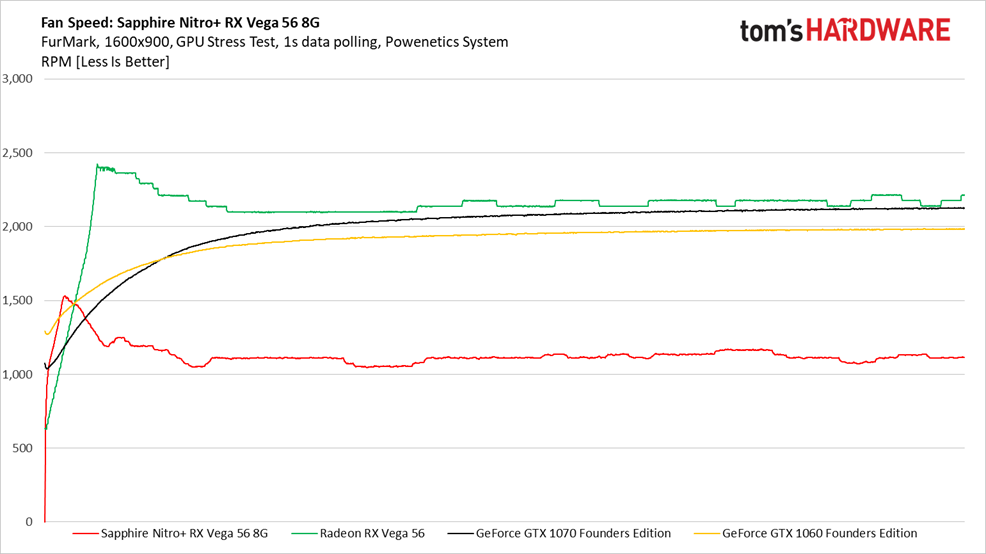
The Nitro+ RX Vega 56 8G’s semi-passive mode doesn’t last as long, its top fan speed peaks above 1,500 RPM, and its eventual steady state is higher under FurMark than Metro: Last Light. However, Sapphire’s card still fares far better than its competition in this comparison thanks to a huge cooler.
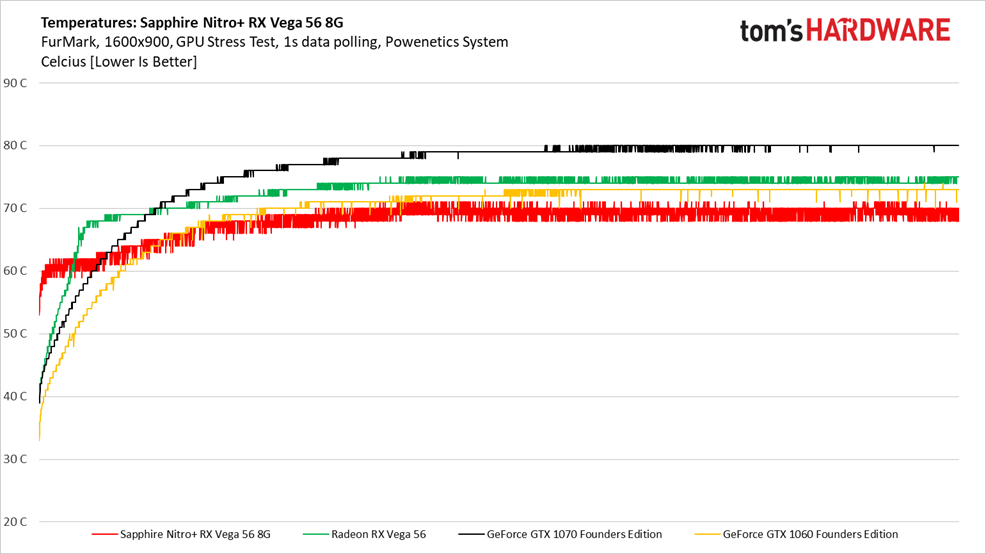
Vega 10’s temperature starts hotter, then levels off faster under FurMark than in our gaming scenario. But in both cases, the GPU on Sapphire’s Nitro+ RX Vega 56 8G tops out around 70°C, which is cooler than the other three cards.
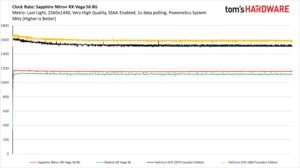
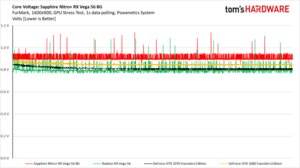
Again, the Nitro+ establishes a slight frequency advantage over AMD’s reference Radeon RX Vega 56 through a notably higher voltage setting. Thus, for its modest performance boost, the Sapphire card consumes quite a bit more power.
Get Tom's Hardware's best news and in-depth reviews, straight to your inbox.
MORE: Best Graphics Cards
MORE: Desktop GPU Performance Hierarchy Table
MORE: All Graphics Content
Current page: Temperatures, Clock Rates and Fan Speeds
Prev Page Power Consumption Next Page Software