Why you can trust Tom's Hardware
Despite the XG320U’s many image modes, it’s easy to see a great image by just leaving Game Mode on Custom 1 and ViewMode on Standard. Calibration is not necessary, but a very accurate grayscale can be achieved with one minor tweak to the red slider.
Grayscale and Gamma Tracking
Our grayscale and gamma tests use Calman calibration software from Portrait Displays. We describe our grayscale and gamma tests in detail here.
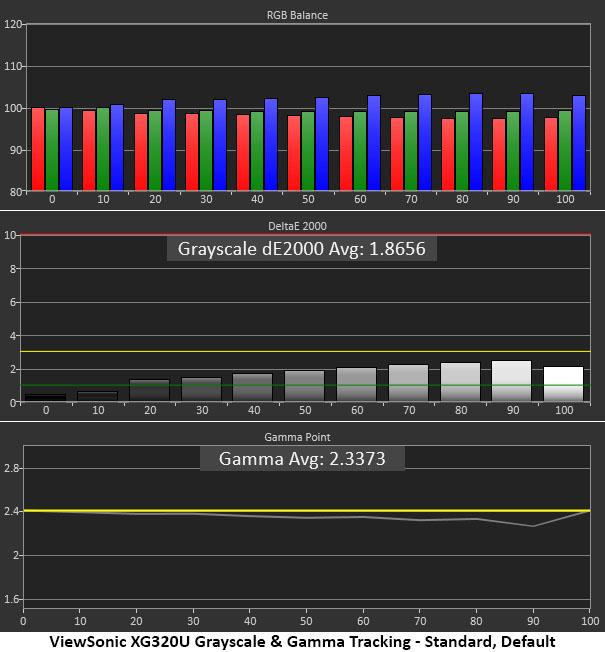
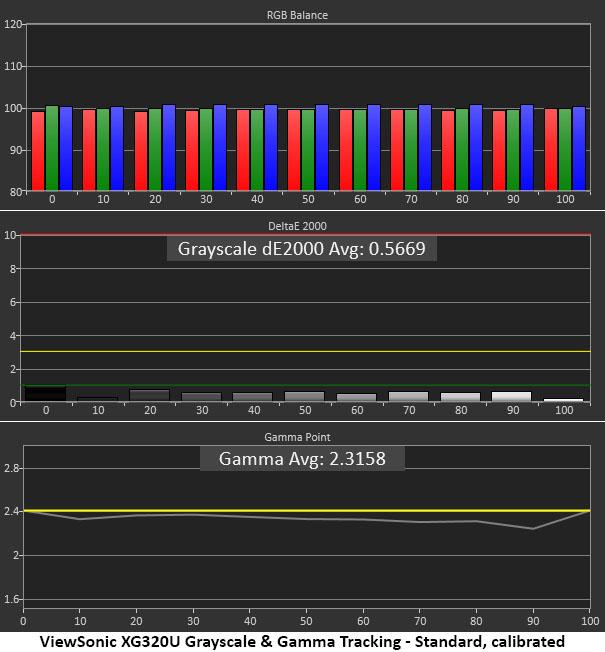
The XG320U has no visible grayscale errors in its factory default state. All dE values are below three, which is the generally accepted threshold of visibility. Gamma is set to 2.4 out of the box, so I measured against that standard. The actual average value is 2.34. Though slightly darker than the 2.2 standard, I like the picture better at that setting. If you prefer 2.2, that option is available.
After changing the red slider down one click, grayscale tracking is now essentially perfect with every value less than 1dE. Gamma is a tad lighter too, and the image really pops now. This is excellent performance.
Comparisons
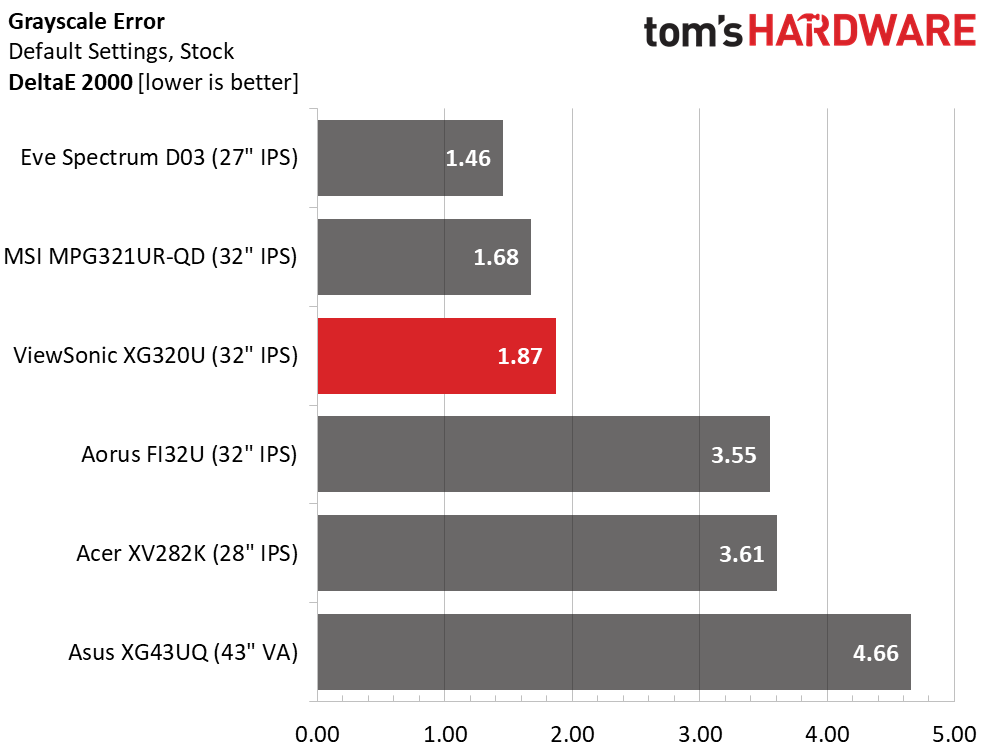
The XG320U clearly does not need adjustment in its factory default mode. A 1.87dE average is among the best I’ve recorded for all monitors and good enough for a solid third-place finish in the comparison. The MSI and Eve screens are also strong contenders.
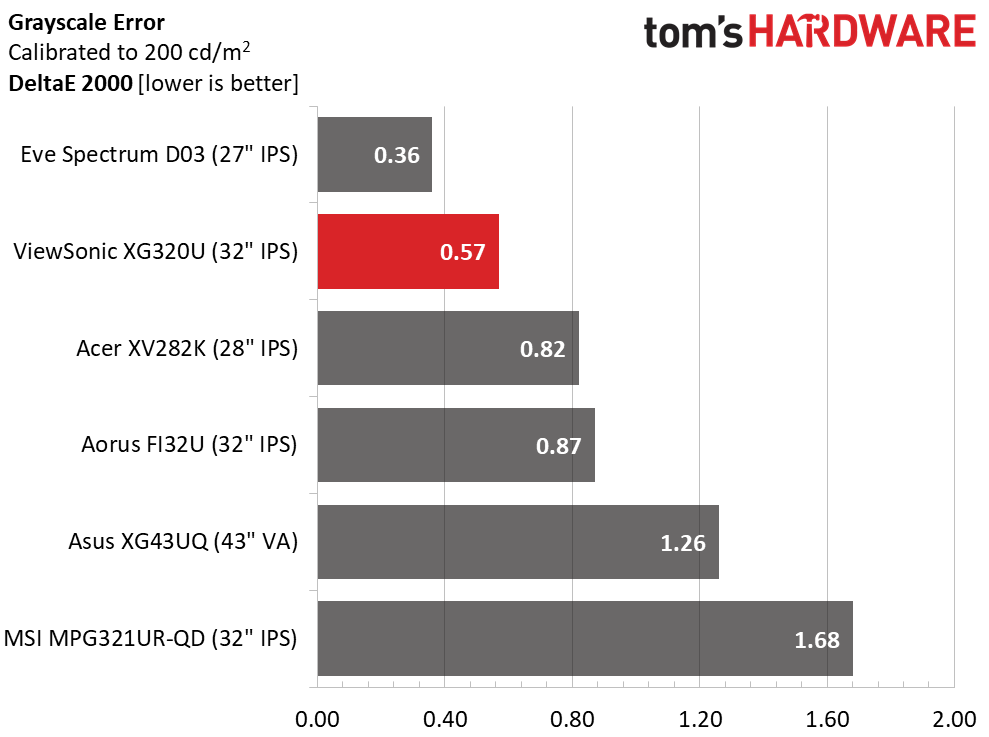
After adjustment, the ViewSonic moves up to second, pipped only by the superb Eve Spectrum I reviewed recently. This is a professional-grade display; it doesn’t get much better.
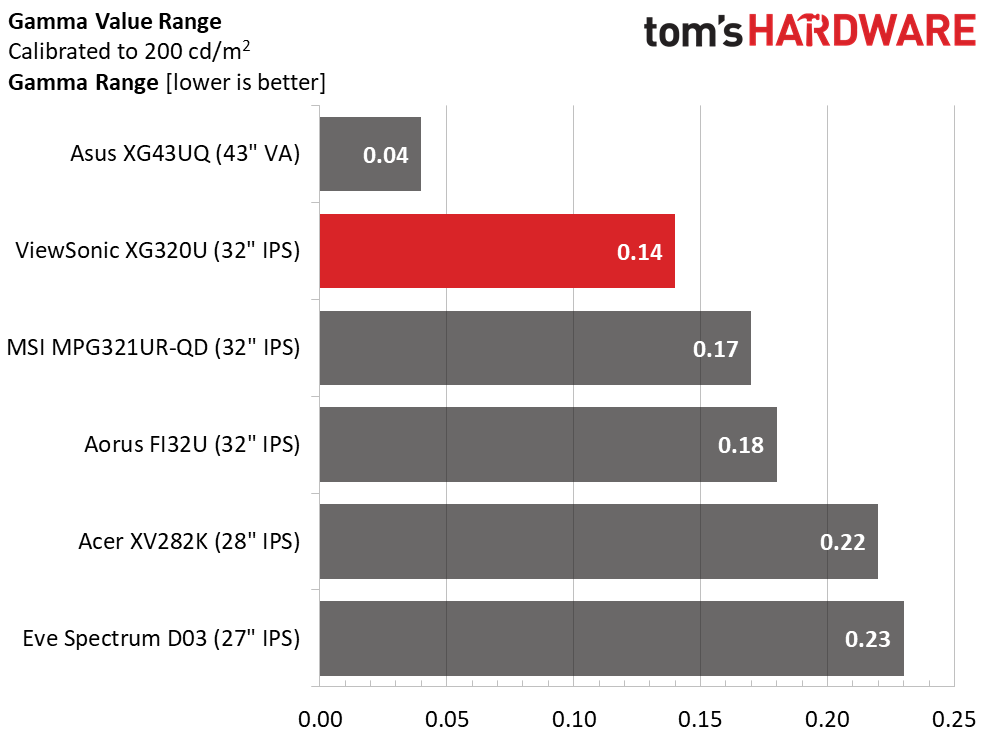
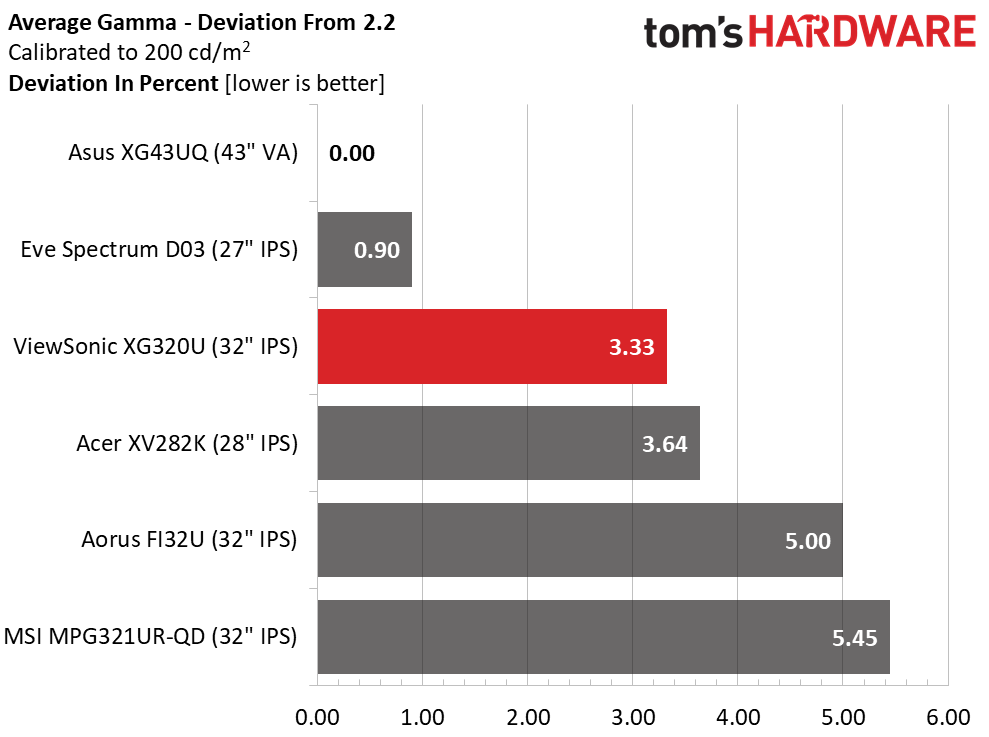
For the gamma comparison, I calculated the XG320U’s deviation from 2.4 rather than 2.2. A 0.14 range of values is very good, slightly better than all but the Asus. A 3.33% deviation is also very good. Only the Asus and Eve screens score better in this test.
Get Tom's Hardware's best news and in-depth reviews, straight to your inbox.
Color Gamut Accuracy
Our color gamut and volume testing use Portrait Displays’ Calman software. For details on our color gamut testing and volume calculations, click here.
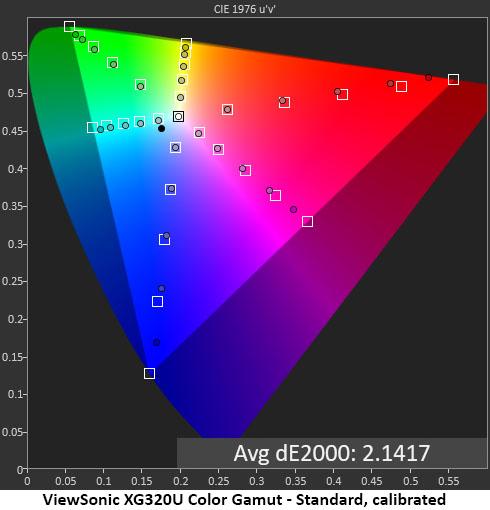
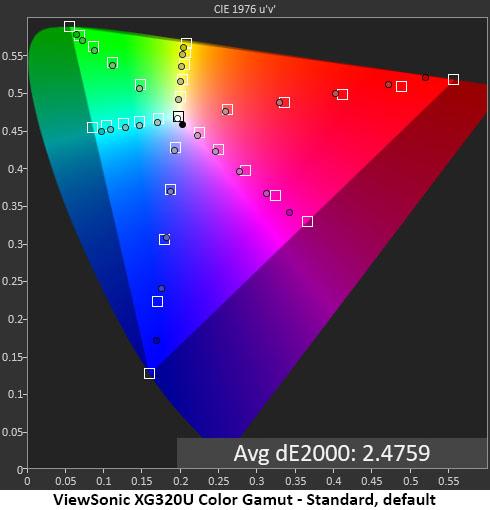
For the color tests, I graphed the XG320U’s results against Rec.2020 rather than DCI-P3 as it is closer to the monitor’s native gamut. You can see that most measurements are on or close to their targets until the panel runs out of color near the perimeter. To say that this display is saturated would be engaging in understatement. Color is rich and vibrant no matter what the content.
Calibration tightens up the tracking a bit and lowers the average error from invisible to more invisible. Seriously though, the visual difference is very subtle. If you’re looking for a colorful monitor, there are few other screens that can compare to the XG320U.
Comparisons
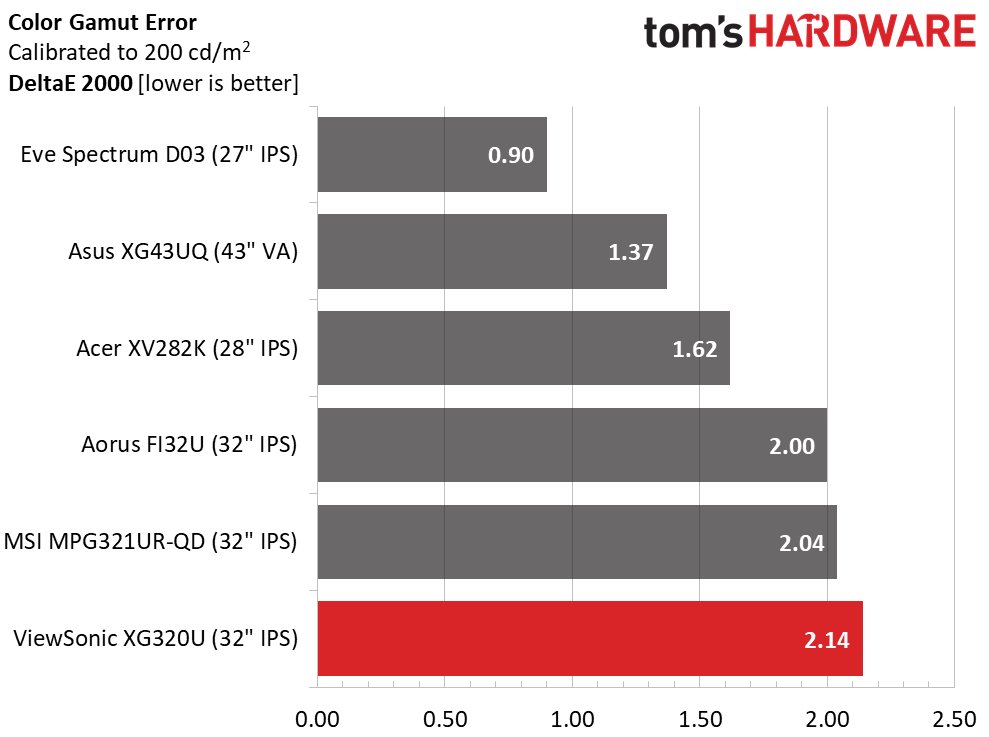
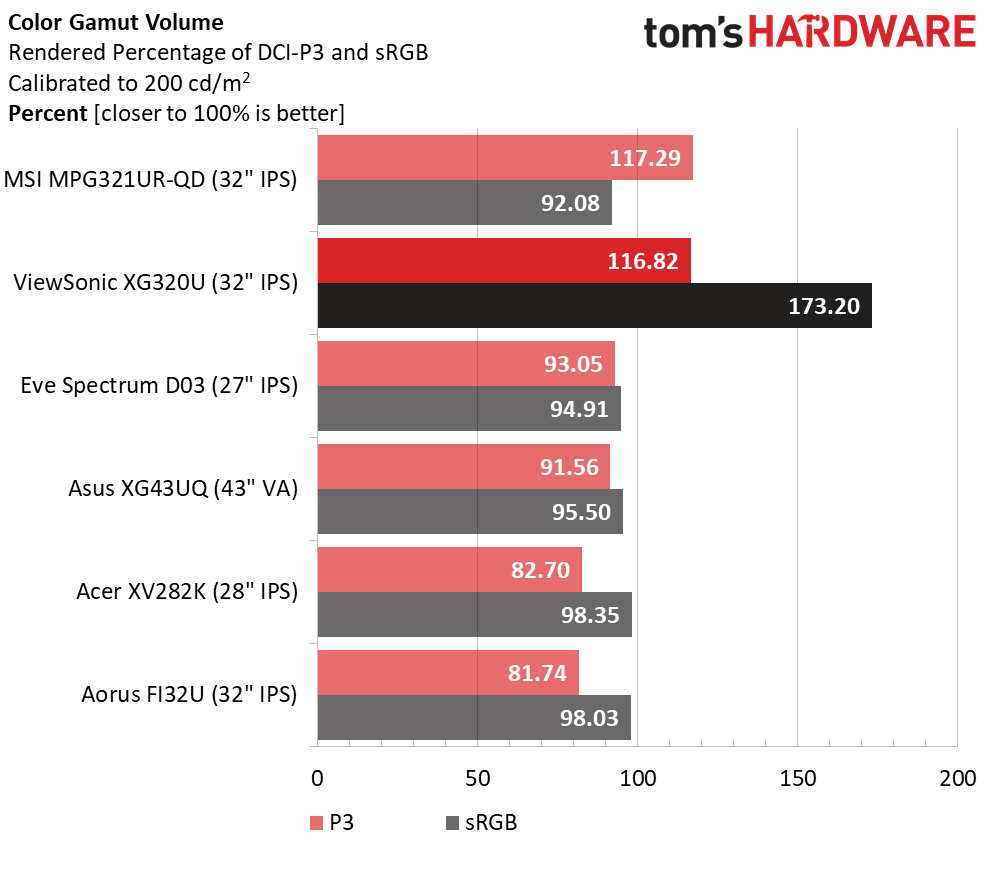
It’s a capable group of displays indeed when the last place screen scores 2.14dE in the color gamut accuracy test. That is excellent performance from all, and the XG320U is very accurate. Remember that the error value is calculated against Rec.2020, not DCI-P3.
The XG320U is the third most colorful monitor I’ve tested. Only the MSI shown here and Asus’ PG32UQX score higher and by less than one percent. This is a whole lot of color and it’s easy to see when comparing it side by side with another display. It is unfortunate that there is no sRGB mode because that volume is significantly higher than 100%. How this affects SDR images will depend on the content. Some games and videos are enhanced, but some look a bit cartoonish. If you’re using the XG320U for color-critical work, a software profile is a must.
Current page: Grayscale, Gamma and Color
Prev Page Brightness and Contrast Next Page HDR Performance
Christian Eberle is a Contributing Editor for Tom's Hardware US. He's a veteran reviewer of A/V equipment, specializing in monitors. Christian began his obsession with tech when he built his first PC in 1991, a 286 running DOS 3.0 at a blazing 12MHz. In 2006, he undertook training from the Imaging Science Foundation in video calibration and testing and thus started a passion for precise imaging that persists to this day. He is also a professional musician with a degree from the New England Conservatory as a classical bassoonist which he used to good effect as a performer with the West Point Army Band from 1987 to 2013. He enjoys watching movies and listening to high-end audio in his custom-built home theater and can be seen riding trails near his home on a race-ready ICE VTX recumbent trike. Christian enjoys the endless summer in Florida where he lives with his wife and Chihuahua and plays with orchestras around the state.
-
Nima K. Hello, thanks for the great review! Especially for your recommendation for calibration… I wondered all the time why the white was a bit reddish, pink (only very slightly). But turning red to 99 makes it perfect. But I have a little Problem and I’m not sure what to do. I have a MacBook connected to the monitor (60Hz) and a Xbox Series X (120Hz). So, for work and all other things apart from gaming, is the response time setting „Standard“ the best? And for gaming 120Hz is „Faster“ better? Should I copy all the picture settings to „Custom 2“ and then set the response time there to „Faster“ and switch the picture mode with the left button every time I change the input? And does it make any difference with the picture quality when I have RGB color space or YCbCr? Because on my Xbox it’s YCbCr and on Mac Full RGB.Reply
And what is „Console Speed“? Is there less input lag when this picture mode is selected or how does is compare to Custom 1? Because you can’t modify or see what it makes. The best would be if response time „faster“ isn’t bad compared to „standard“, or the other way around, so I could leave the picture mode and everything the same, because it‘s really annoying to change the picture mode every time I switch the input. I don’t get why every input hasn’t it’s own setting. -
blacknemesist Games are too bland as they come and using shaders and mods to fix them @4k is going to tank the FPS. My 3090 on my PG279Q can handle 4k at high fps using (DL)DSR but is normally not worth it unless the game has a crisp image and only needs removing DOF and LOD and some fixes to color balance and contrast. Also, the idea of running anything in 4k@60fps+ is very restrictive as some games are so poorly optimized that you will need to DLSS on a 32'' screen and it will be impossible not to notice the drop in quality.Reply
So, in this 4k case it is actually a battle of performance VS visuals for PC.(I won't even consider consoles because is too pricy and for TV you don't need the 150hz).