AMD Radeon Vega Frontier Edition 16GB Review
Why you can trust Tom's Hardware
3D Workstation Performance
No Cheating
Since we’re comparing graphics cards made by more than one manufacturer, their drivers make a significant difference in the results. Thus, we're shaking up the benchmark suite a bit by deliberately not using the SPECviewperf freeware suite. It just doesn’t reflect the current state of professional workstation and CAD applications. Its workloads are just too short and old. Also, some of its benchmarks don’t even start without the presence of professional graphics cards or their professional drivers.
Understandably (but also unfortunately for reviewers), AMD and Nvidia optimize their drivers to target popular benchmarks. This practice diminishes the value of results we generate since performance differences become unrepresentative of other workloads or card behavior in general (we're talking about you, Maya). It all makes for great marketing, though.
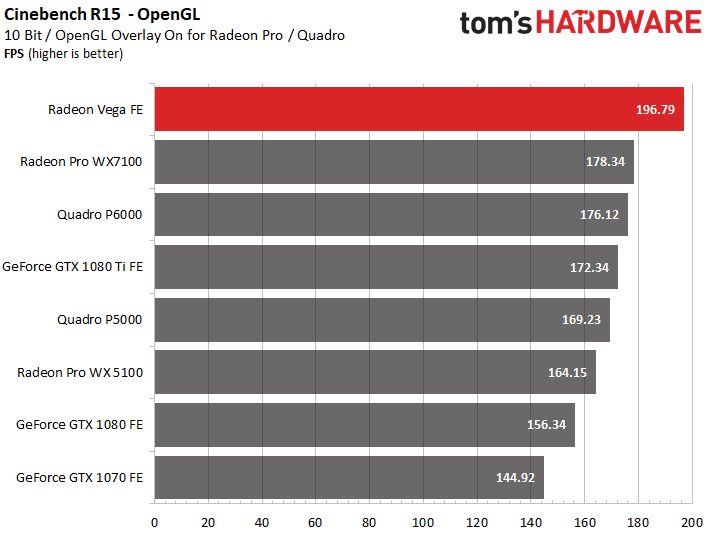
Another benchmark that's nearly worthless due to targeted driver optimizations is Cinebench in OpenGL. We tried to run it with current drivers and found that the results (as well as the changes that the drivers have seen over time to get to them) are more than questionable. We’re not going to use tests like this if we’re comparing drivers from different manufacturers.
SolidWorks 2015
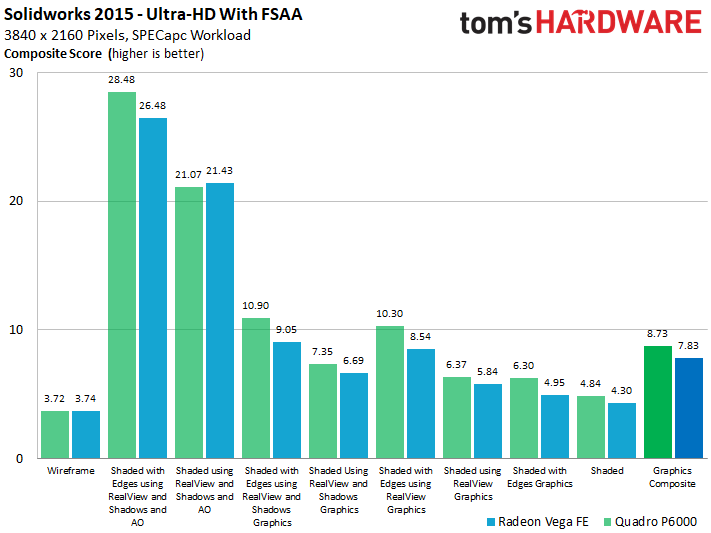
What we like to see is a fair comparison using the complete installation of a common software package like SolidWorks. Pitting AMD’s Radeon Vega FE against Nvidia’s Quadro P6000 reveals that the former provides approximately 90 percent of the performance for approximately 30 percent of the price. Nvidia’s workstation card might win in the end, but we don't think it dissuades anyone from considering AMD's card, either.
Ultimately, the Radeon Vega Frontier Edition provides approximately the same performance as Nvidia’s Quadro P5000, which is the workstation version of a GeForce GTX 1080. What's more, the P5000 sells for just under twice as much as AMD's Vega board.
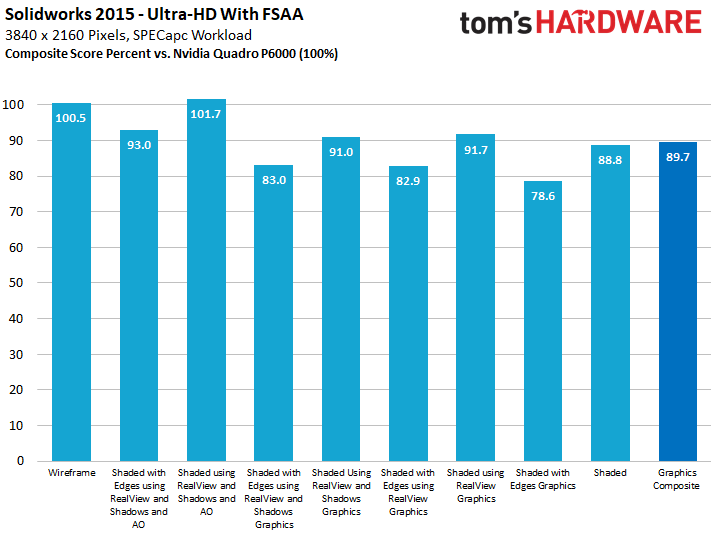
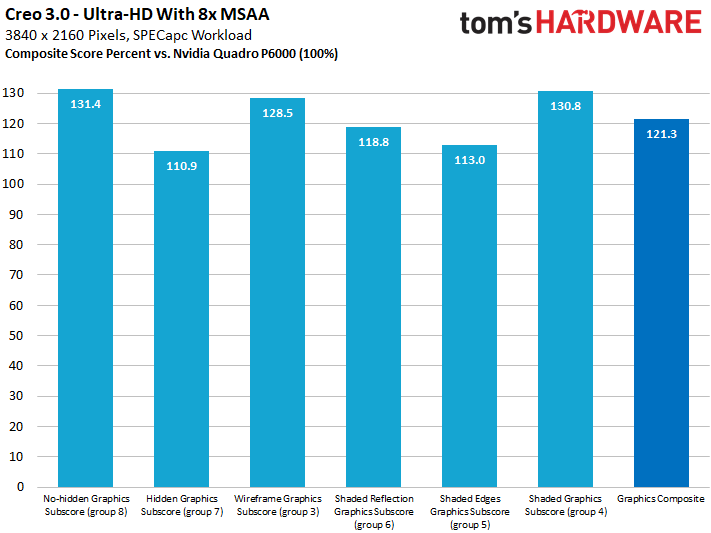
The individual benchmark results show that there aren’t any outliers among the composite sub-scores. These graphs reflect percentage points to make them easier to read, with Nvidia's Quadro P6000 always set as 100 percent.
Creo 3.0
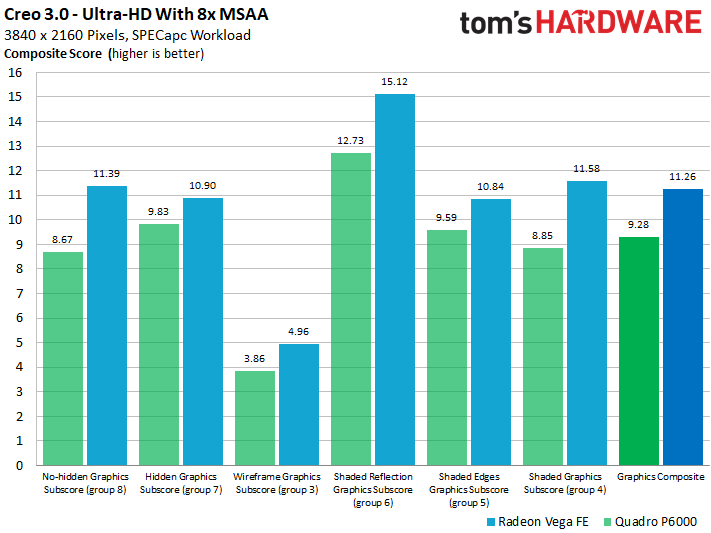
Creo 3.0 runs well on a Radeon Vega Frontier Edition. In fact, it beats the Quadro P6000 in every single sub-score race. This is what good optimization of an application looks like. That is to say these performance results represent real-world performance; they're not just a benchmark sequence that only lasts a few seconds.
Get Tom's Hardware's best news and in-depth reviews, straight to your inbox.
Again, converting our results to percentages proves enlightening. An average performance advantage of approximately 20 percent is nothing to sneeze at.
You can bet that Nvidia will optimize its drivers to be more competitive. And that's good news for users, since professional drivers are just as dependent on optimization as gaming drivers when it comes to extracting a given architecture's maximum potential.
3ds Max 2015
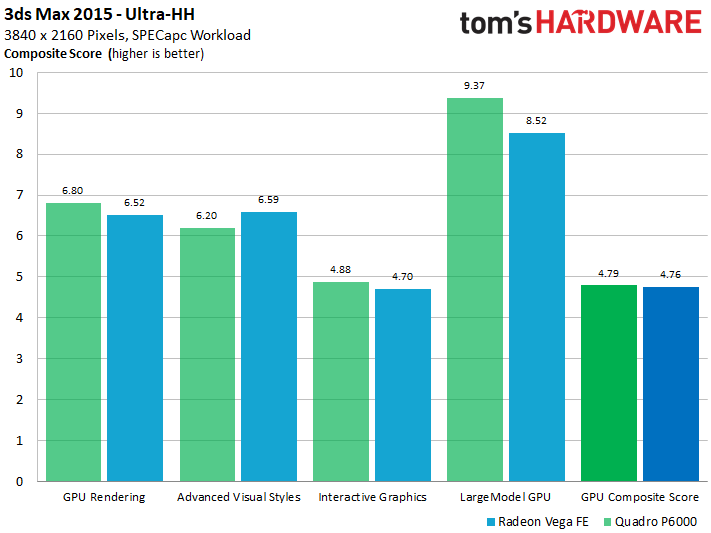
The two graphics cards perform almost identically, despite the wide variety of workloads.
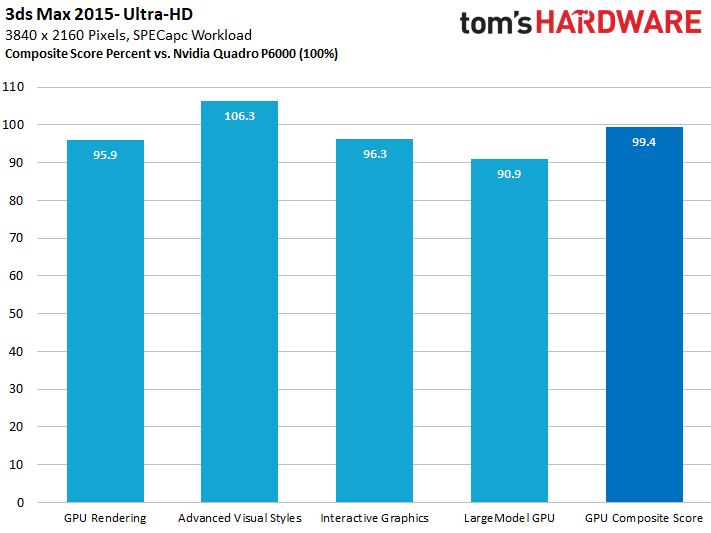
Looking at the percentages, AMD's Radeon Vega FE never lags behind by more than 10 percent, and it manages to pull ahead by six percent in an important area. This is what lets the card draw even, since an overall difference of 0.6 percent is almost within the measurement error range.
AutoCAD 2017 - 3D Performance
AutoCAD utilizes DirectX without any fuss: for the most part, it uses a simple wrapper that sits right on top of Microsoft’s libraries.
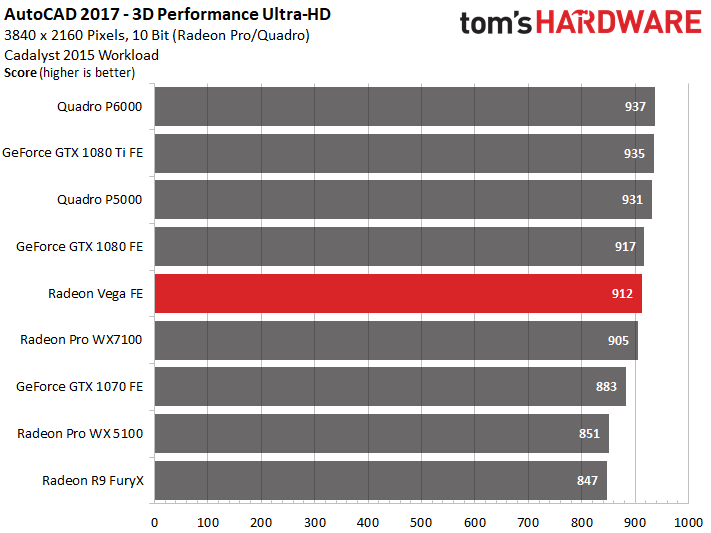
Our benchmark shows the Radeon Vega FE landing closer to Nvidia's GeForce GTX 1080 than the 1070.
Practically speaking, graphics card drivers can’t be optimized for this benchmark, so the manufacturers aren't able to manipulate its results. If that means this is what we can expect from AMD’s Radeon Vega FE in DirectX-based applications (including games), a lot of folks are going to be disappointed.
MORE: Best Graphics Cards
MORE: Desktop GPU Performance Hierarchy Table
MORE: All Graphics Content
Current page: 3D Workstation Performance
Prev Page 2D Workstation Performance Next Page DirectX 11 Gaming Performance
Igor Wallossek wrote a wide variety of hardware articles for Tom's Hardware, with a strong focus on technical analysis and in-depth reviews. His contributions have spanned a broad spectrum of PC components, including GPUs, CPUs, workstations, and PC builds. His insightful articles provide readers with detailed knowledge to make informed decisions in the ever-evolving tech landscape
-
Ne0Wolf7 Too bad its been so well optimized for Creo, I hate that one... Anyways, is it possible to include Autodesk Inventor in the suite? I want a card that can be used as a hybrid like this (of course I'll have to wait for it to come down in price) but its hard to decide I want something if my main software is not included in the benchmarks. Either way, I'm exited and this is a good reviewReply -
cknobman Not sure what to think here (in regards to hopes for the fx versions).Reply
I cannot expect to see a huge % boost in games just on a driver update. Maybe 10% tops?
What bothers me the most is the heat/power and throttling concerns.
I dont think those will change with a fx version of the card.
So it would appear that 80-90% of the time Vega 64 will be running closer to 1200mhz, which is a major bummer and why it wont surpass a 1080.
Almost wish there had been a review of the watercooled version as well to see if it was able to maintain higher avg mhz. -
cats_Paw Dont know much about workstation so my comment does not take that into consideration.Reply
It seems like it eats a lot of power for a very similar performance to a 1080 in gaming but at the same time its faster than Titan Xp in some workstations?
Doesn't that suggest driver/optimization issues? -
Yarvolino Ho comes that Vega and 1080Ti specs are pretty much the same, even greater numbers for Vega, and the result is that Vega is 40% slower and it drains +50% of power ?Reply
Considering Vega also costs much more, I label it as an april fool -
LORD_ORION Wow, what a horrible review.Reply
2 games, 1 resolution... and just where does this card fit in the vega lineup? You didn't even list the details of the other vega cards in a handy chart for comparison.
*starts looking for reviews on other sites* -
demonsoldier So there has been a few people tackling this and i found that lowering certain things about the card undervolting by 110mv has found to fix the clock speed issue keeping at a stable 1600 mhz with better cooling and it out performs the 1080 at that point. Can you guys do a second attempt at this with undervolts to see if that helps anything? AMD cards have been this way everytime they come out needing to have power draw issues fixed later on.Reply -
sparkyman215 Reply20013128 said:Wow, what a horrible review.
2 games, 1 resolution... and just where does this card fit in the vega lineup? You didn't even list the details of the other vega cards in a handy chart for comparison.
*starts looking for reviews on other sites*
wh-what? Toms stated like four times that this *is not a gaming card* and shouldn't be treated as one. They simply included the gaming benchmarks to be inclusive. Also, there's not really a point in showing benchmarks under 4k for such high end cards, because at that point (like 1080p) it's a CPU bottleneck - the GPU has nothing much to do. Considering listing other Vega cards, those are in a different class and not relevant, however it would be nice to have the details of the other cards, I guess. -
yeeeeman Even though AMD says with each ocassion that this graphics card is not indicative of RX Vega's performance I would say that they are trying to avoid early dissapointment. The matter of the fact is that whatever feature they have disabled right now on Vega FE, it won't bring too much performance on RX Vega. Lets face it, if they were using half of CUs on Vega FE, then I would expect huge gains from RX Vega, but as it stands, RX Vega wil be ~ GTX 1080, one year later, + 100W and hot like a stove.Reply
I really wonder how could they make a new GPU on a big better process (28nm vs 14nm) and still get more power consumption compared to Fury X. What is more surprising is that they have the same number of CUs, approx same performance with Fury X, a lot more transistors, a lot more frequency and still the improvement is minimal.
They are either hiding some huge block which doesn't do anything in graphics scenarios which consumes a lot of power just idling or they are rubbish at power optimization or maybe the HBM2 consumes a lot of power, don't know.
Everything on this card is strange, starting with performance, specs, power consumption, everything... -
Pompompaihn Seems like a very nice card if you're a home office person and need your system to do double duty. Good enough for high end gaming and comparable to expensive NVIDIA pro cards.Reply
