PCIe 4.0 SSD Exclusive: Testing Phison's PS5016-E16 NVMe Controller
1TB Performance Results
Comparison Products
Considering this controller will soon power some of the fastest SSDs on the market, we’ve opted to put it up against some of the fastest SSDs we can get our hands on today. This includes the Samsung 970 EVO Plus with its Phoenix controller and 9x-layer V5 V-NAND, WD’s Black SN750 with its in-house NVMe controller and Toshiba BiCS3 64L TLC, and Adata’s XPG SX8200 Pro sporting a Silicon Motion SM2262EN controller and Micron 64L TLC flash.
Of course, we couldn’t put our sample against these rivals without including a product with Phison's E12 controller, so we’ve thrown in a MyDigitalSSD BPX Pro, which features Toshiba BiCS3 flash. Finally, we threw in results from an Intel Optane SSD 905P to see if the PCIe 4.0 interface can level the playing field with Optane memory.
Game Scene Loading - Final Fantasy XIV
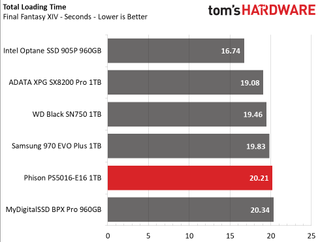
The Final Fantasy XIV StormBlood benchmark is a free real-world game benchmark that easily and accurately compares game load times without the inaccuracy of using a stopwatch.

Phison E12-based SSDs have never been the fastest in our game loading benchmark. After reviewing multiple E12-based drives, the results are usually the same: E12-powered SSDs lag behind the pack ever so slightly.
While Phison’s new E16 controller breaks through the PCIe 3.0 x4 speed barriers, because it is so closely related to the E12, we don’t see much improvement in game loading performance. Overall, the controller only improves performance by a fraction of a second (at best) over E12 SSDs, and that is most likely due to improved random performance thanks to the company's improved NAND IP or Toshiba’s BiCS4 TLC, rather than the sequential performance uplift.
Transfer Rates – DiskBench
We use the DiskBench storage benchmarking tool to test file transfer performance with our own custom 50GB block of data. Our data set includes 31,227 files of various types, like pictures, PDFs, and videos. We copy the files to a new folder and then follow up with a read test of a newly-written 6GB file.


Thanks to its incredible sequential performance, Phison’s E16 absolutely crushes the competition during our file copying and reading tests. With a copy transfer speed of 1.1 GB/s, the E16 sample scores first place and provides twice the performance of the E12-powered BPX Pro. And, to top things off, it outperforms the group significantly during the 6GB file read test at ~3.1 GB/s.
Stay On the Cutting Edge: Get the Tom's Hardware Newsletter
Join the experts who read Tom's Hardware for the inside track on enthusiast PC tech news — and have for over 25 years. We'll send breaking news and in-depth reviews of CPUs, GPUs, AI, maker hardware and more straight to your inbox.
System Clone – Macrium Reflect
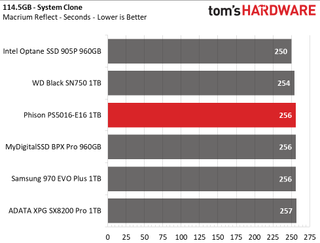
A system clone isn’t something many people do often. But it can become a time-consuming task with slow storage devices like HDDs or entry-level SSDs -- especially if you have a lot of data. Therefore, we developed a test to measure how long this task takes. To ensure repeatable results, we secure erase each SSD to ensure the SLC cache is empty before we restore an average-sized 114GB operating system and files from an Intel Optane SSD 905P.

As a high-end NVMe SSD preview article, our choice of high-end SSD comparables shows very little variance in clone time. The Intel Optane 905P was the fastest, cloning in just four minutes and ten seconds, but the rest of the pack were just seconds slower. Even with Phison's incredible 4.3 GB/s write speed, clone time wound up being the same as the MyDigitalSSD BPX Pro.
System Boot Time
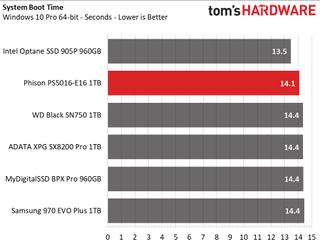
System boot was once a long and daunting task, but with the introduction of flash media, boot times now fly by. We rebooted our system multiple times to find the average boot time. We tested with Windows 10’s fast boot feature disabled and a one-second POST delay in the UEFI.

Similar to our findings with system cloning, boot times are very similar for most of the competitors. The Phison E16 booted 0.3 seconds faster than the rest of its flash-based competitors. Only the Intel Optane SSD 905P separates itself from the pack, leading by roughly a second.
Trace Testing – PCMark 8 Storage Test 2.0
PCMark 8 is a trace-based benchmark that uses Microsoft Office, Adobe Creative Suite, World of Warcraft, and Battlefield 3 to measure the performance of storage devices in real-world scenarios.


Intel’s Optane SSD 905P scores first place and takes the win by a significant margin. The extra low latency and high IOPS capability of the Optane media pay off big here. Phison’s E16 also performed rather well during this benchmark, but its incredible sequential performance isn’t advantageous under these rather light workloads. It ranks third overall, scoring close to the MyDigitalSSD BPX Pro and Samsung 970 EVO Plus.
Trace Testing – SPECworkstation 3
Like PCMark 8, SPECworkstation 3 is a trace-based benchmark, but it is designed to push the system harder by measuring workstation performance in professional applications. The full suite consists of more than 30 workloads, but we've opted to only run the storage benchmark which uses only 15 of them and categorizes the results into five market segments for scoring: Media & Entertainment, Product Development, Life Sciences, Energy, and General Operations.


Ranking in third place, the E16 does very good in SPECworkstation 3. The Samsung 970 EVO Plus beats it by a small margin, but it significantly outperforms the E12-powered MyDigitalSSD BPX Pro. The new NAND IP and the extra sequential performance really helps the drive during the Energy application.
ATTO
ATTO is a simple and free application that SSD vendors commonly use to assign sequential performance specifications to their products. It also gives us insight into how the device handles different file sizes.


Phison’s E16 has similar small file transfer performance as the E12, except it is slightly faster on the ramp-up. It hit 3GB/s read and write before the E12-powered SSDs did in ATTO. Beyond that, it essentially flies away with performance that is unobtainable by its competitors. With peak speeds of 4.8 GB/s read and 4.3 GB/s write, it’s not quite the quoted 5/4.4 GB/s read/write speeds we're looking for, though.
CrystalDiskMark
CrystalDiskMark (CDM) is a simple and easy to use file size benchmarking tool.


CrystalDiskMark extracts the E16’s rated speeds. Well, almost. At a queue depth (QD) of 32, we hit 5 GB/s read and 4.3 GB/s write, which is just 100 MB/s shy of the rated write spec. Still, this outscores all of the competing drives. It also outscores them at a QD of 1, placing it on the top of our sequential read/write charts. That's important for real-world snappiness on the desktop.
When testing 4K random performance, Phison’s E16 peaked at 470,000/580,000 IOPS at a rather high QD of 64. While the drive is rated for up to 750,000/700,000 read/write IOPS and has been demoed at upwards of 700,000 IOPS, those results were at an unrealistically high QD of 1024. Most consumer demands lie in shallow queue depths that span from QD1 to QD4, with the majority at just QD1.
At QD1, the E16 dishes out 14,800/46,000 read/write IOPS, a nice little boost over the BPX Pro. But this is still not as good as ADATA’s 17,700 IOPS of read performance, or the Intel Optane SSD 905P’s 50,000 IOPS. Both outperform the E16 up to QD8 in reads, but the Optane leads in both read and write performance.
Sustained Sequential Write Performance
Official write specifications are only part of the performance picture. Most SSD makers implement an SLC cache buffer, which is a fast area of SLC-programmed flash that absorbs incoming data. Sustained write speeds can suffer tremendously once the workload spills outside of the SLC cache and into the "native" TLC or QLC flash. We hammer the SSDs with sequential writes for 15 minutes to measure both the size of the SLC buffer and performance after the buffer is saturated.


The E16 supports both TLC and QLC flash, and it’s rather obvious that Phison’s E16 features an SLC cache to help mitigate slow NAND direct-to-die write speed.
As you can see on our graphs, the E16 is faster than any other drive up until about the ~4-minute mark. Phison seems to have adopted an approach similar to Silicon Motion (ex. ADATA’s XPG SX8200 Pro), and, contrary to what WD believes, a large dynamic cache is best. This does have its trade-offs, though. While this approach achieves much higher peak speeds, it also results in much lower performance valleys.
In testing, our sample absorbed up to a massive 368GB of data at over 4.2 GB/s for one minute and 25 seconds before performance degraded to native direct-to-TLC write speeds of about 600MB/s. We were told the cache is up to 333GB in capacity, so our results were a bit better. But the low dip in the performance chart may be something Phison will tune as it continues to develop this beta firmware.
Overall, this means future SSDs will most likely have faster burst write performance for the best performance in consumer and prosumer applications. But it will come at the cost of decreased write performance when extraordinarily large transfers saturate the cache.
Iometer Latency Testing
Iometer is an advanced I/O measurement tool that is used to benchmark storage performance.


You might expect a big improvement in latency from the faster PCIe 4.0 interface, but that isn't the case. Though the improved interface will yield some benefit, we're still bound by the latency of the flash, NVMe protocol, driver stacks, and file system.
In terms of latency, the E16 scores third place and is basically just like any other NAND-based SSD. It's fast, but not as fast as Intel’s Optane SSD 905P. Optane still reigns supreme here. With a response time of just 0.016ms, it is 4-5x faster than any NAND-based SSD.
Power Consumption
We use the Quarch HD Programmable Power Module to gain a deeper understanding of power characteristics. Idle power consumption is a very important aspect to consider, especially if you're looking for a new drive for your laptop. Some SSDs can consume watts of power at idle while better-suited ones sip just milliwatts. Average workload power consumption and max consumption are two other aspects of power consumption, but performance-per-watt is more important. A drive might consume more power during any given workload, but accomplishing a task faster allows the drive to drop into an idle state faster, which ultimately saves power.


Unfortunately, we were not able to test the E16's power consumption with the PLDA adapter. However, we did measure power consumption with the drive plugged into the PCIe 3.0 interface. And luckily, our 50GB file copy result was identical with both PCIe 3.0 as 4.0. On average, the E16 sample consumed 3.81W. This is a significant jump in average power consumption compared to the E12, but our performance also jumped significantly. As a result, the E16 blasted off to the top of the chart and took first place in efficiency.
At idle, the E16 consumed 12mW more power than our reference E12 when we enabled the UEFI ASPM feature. When disabled, the E16 SSD consumed almost double what the E12 did. There was some news that it would draw over 12-14W+, but that seemed rather absurd. We recorded a max of 6W, so it shouldn’t be too much more with maximum utilization over the PCIe 4.0 bus. We will update our measurements when we get our PCIe 4.0 test bench.
We used forced air cooling for the E16 sample and the rather large PLDA adapter. We used a 120mm fan about 5-6 inches away. The device never exceeded 55C during a maximum-intensity sequential write workload. Based on power draw, cooling requirements should be similar to almost any other high-end M.2 SSD.
MORE: Best SSDs
MORE: How We Test HDDs And SSDs
MORE: All SSD Content
Current page: 1TB Performance Results
Prev Page Breaking The PCIe Speed Barrier Next Page Conclusion
Sean is a Contributing Editor at Tom’s Hardware US, covering storage hardware.
-
AlistairAB Those results were not very good, not enough to justify PCIe 4.0. I'm very happy with my SX8200 Pro SSDs as you can see barely any real OR synthetic differences. Looking forward to the E19 SSD next year then :)Reply -
djayjp I don't understand the purpose of this test. Seems there are two variables (the new interface and the drive itself)?Reply -
seanwebster Reply
The purpose? We got an early sample of an upcoming SSD controller that is going to be at the heart of SSDs that are coming out later this year. It's a preview on the upcoming tech. The purpose is to show how future SSDs will compare to current gen as it stands in development. It just happens that even with the faster interface low queue depth random performance is still about the same, so we don't see much improvement in applications that rely on that metric. High QD random and all sequential applications will see decent gains more than anything thanks to the new interface. For more gains, the underlying media needs to be changed for faster, as we see with Intel's Optane, or applications need to be coded to better take advantage of all of NVMe's goodness.djayjp said:I don't understand the purpose of this test. Seems there are two variables (the new interface and the drive itself)? -
srbabs On the 4th and 5th slides of power consumption, the units are labeled as watts, my guess it is supposed to be miliwatt. Could some one check it out?Reply -
USAFRet Reply
Is it worth "upgrading" from what you have now?AlistairAB said:Those results were not very good, not enough to justify PCIe 4.0. I'm very happy with my SX8200 Pro SSDs as you can see barely any real OR synthetic differences. Looking forward to the E19 SSD next year then :)
No.
But it will just be the (slightly faster) protocol for your next system. -
seanwebster Replysrbabs said:On the 4th and 5th slides of power consumption, the units are labeled as watts, my guess it is supposed to be miliwatt. Could some one check it out?
Yeah, those are supposed to read milliwatts. I recently changed it from Watts to Milliwatts for better visual comprehension. I thought I had fixed that testual label tho...looking back I did, just in a different file! I'll get that fixed. Thanks for noticing! -
daglesj Will still grind to a halt when copying system folders full of thousands of micro files. This is where we need to improve performance not just raw bandwidth.Reply -
BulkZerker ReplyAlistairAB said:Those results were not very good, not enough to justify PCIe 4.0. I'm very happy with my SX8200 Pro SSDs as you can see barely any real OR synthetic differences. Looking forward to the E19 SSD next year then :)
djayjp said:I don't understand the purpose of this test. Seems there are two variables (the new interface and the drive itself)?
Well I'm beginning to wonder what version of Windows was being used during testing. That information is not disclosed in the review as of me posting. -
seanwebster Reply
The latest: Win 10 Pro 64-bit - RS6BulkZerker said:Well I'm beginning to wonder what version of Windows was being used during testing. That information is not disclosed in the review as of me posting. -
epobirs I couldn't help wondering if the device that created the PCIe 4.0 interface for the test was introducing its own issues. That aside, it looks like there will need to be advances elsewhere in consumer PC design before the performance potential can be realized. Boot time haven't shifted much in quite a while, despite huge gains in SSD capability. It doesn't seem like getting the OS into RAM is the issue at this point but rather how long it takes the OS to sort itself out. Might there be opportunities for improvement in the hardware that stores and loads the firmware, for example?Reply
Most Popular


