Why you can trust Tom's Hardware
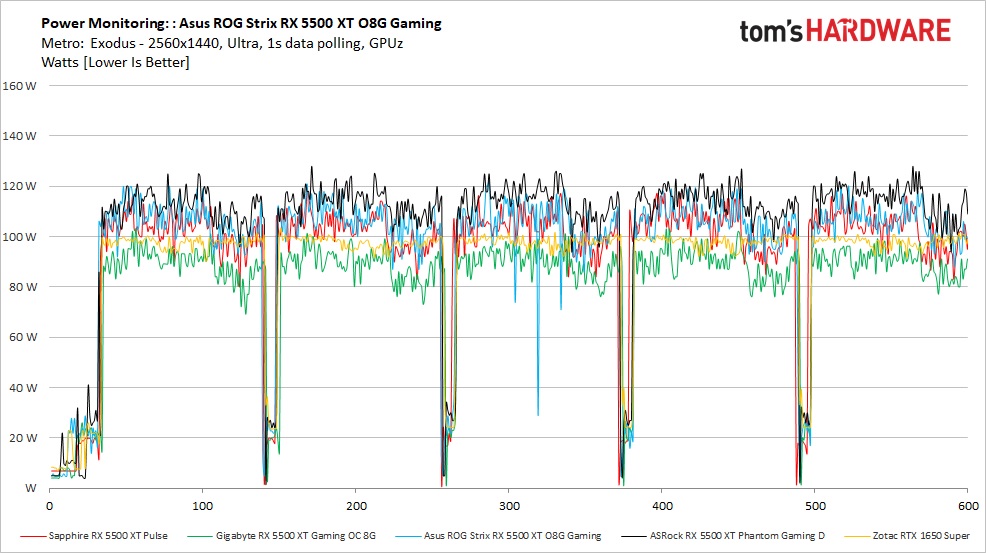
We use GPU-Z logging to measure each card's power consumption with the Metro Exodus benchmark running at 2560 x 1440 using the default ultra settings. The card is warmed up prior to testing and logging is started after settling to an idle temperature (after about 10 minutes). The benchmark is looped a total of five times, which yields around 10 minutes of testing. In the charts, you will see a few blips in power use that are a result of the benchmark ending one loop and starting the next.
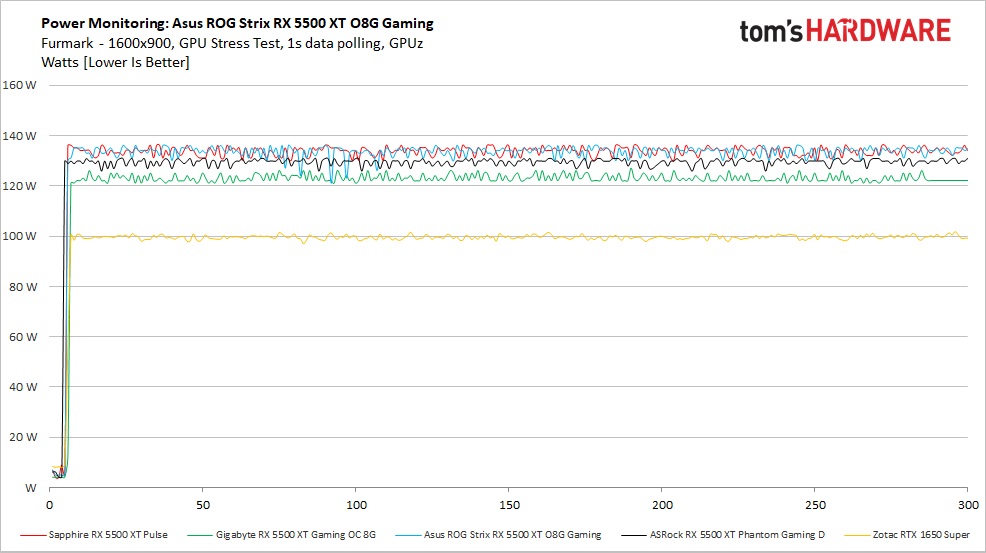
We also use FurMark to capture worst-case power readings. Although both Nvidia and AMD consider the application a "power virus," or a program that deliberately taxes the components beyond normal limits, the data we can gather from it offers useful information about a card's capabilities outside of typical gaming loads. For example, certain GPU compute workloads including cryptocurrency mining have power use that can track close to FurMark, sometimes even exceeding it.
Power Draw
Starting with the gaming tests, the ASRock RX 5500 XT Phantom Gaming D averaged 114W, the most of all RX 5500 XT cards tested so far. The Asus was just behind it at 104W, the Sapphire Pulse at 102W, followed by the Gigabyte sipping power at 89W. As an end-user, you will be hard-pressed to see these differences on your power bill. We also need to be cognizant that our current recording method, GPU-Z only records the chip power and not Total Board Power (TBP) for AMD GPUs. This means actual power use is going to be a bit higher on these cards.
The Zotac GTX 1650 Super averaged 97W—a few watts lower than most of the RX 5500 XT’s we’ve tested. The faster Zotac GTX 1660 Amp (not pictured in the chart) used even less power at 89W. This shows that Nvidia’s 12nm Turing architecture is still slightly more efficient than the 7nm Navi, considering the difference in lithography.
Power consumption using Furmark shows much more consistent power use across the test. In this case, The ASRock averaged 129W with the Asus and Sapphire cards both using 133W. The Gigabyte again comes in the lowest reaching 122W. The GTX 1650 Super barely budged from the game tests averaging 99W, which is less power than all of the RX 5500 XT cards we’ve tested.
Temperatures, Fan Speeds and Clock Rates
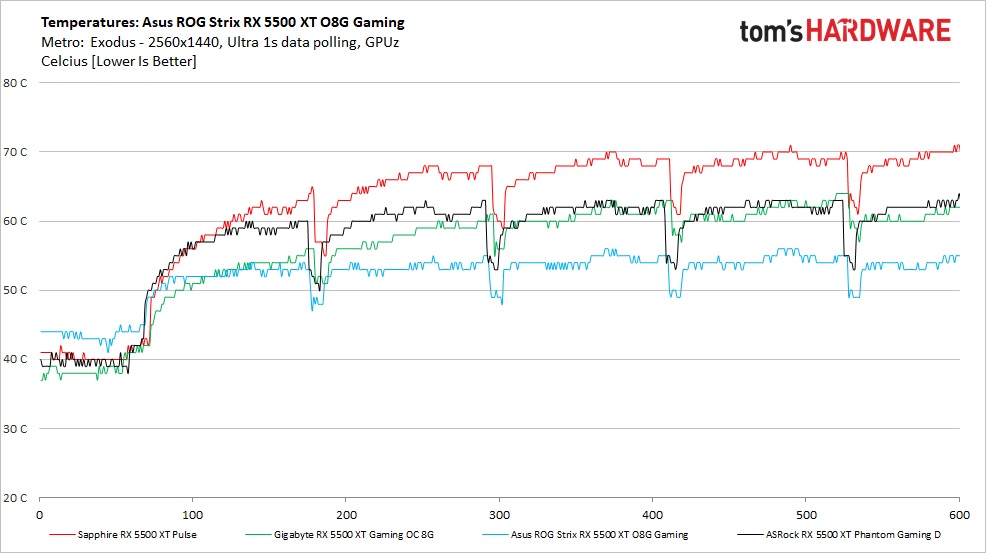
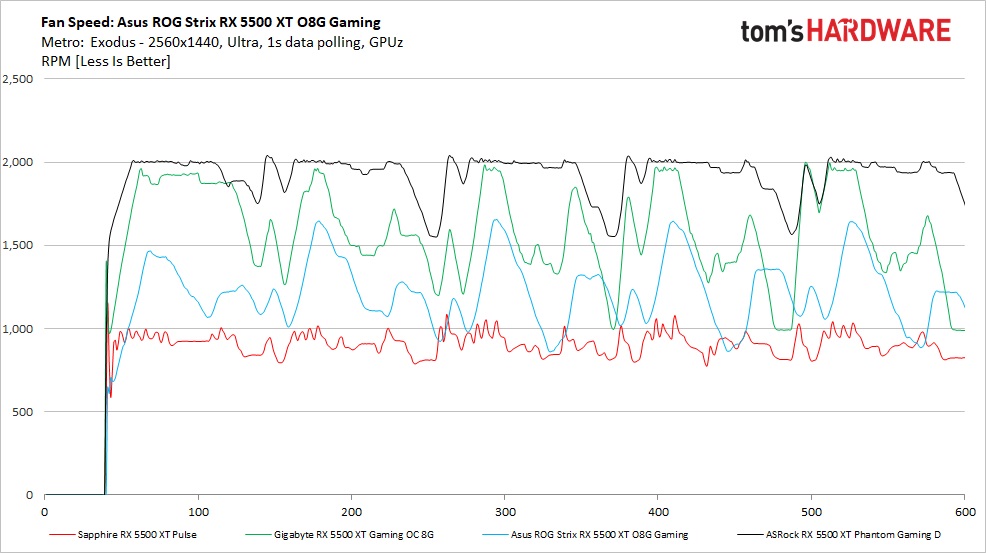
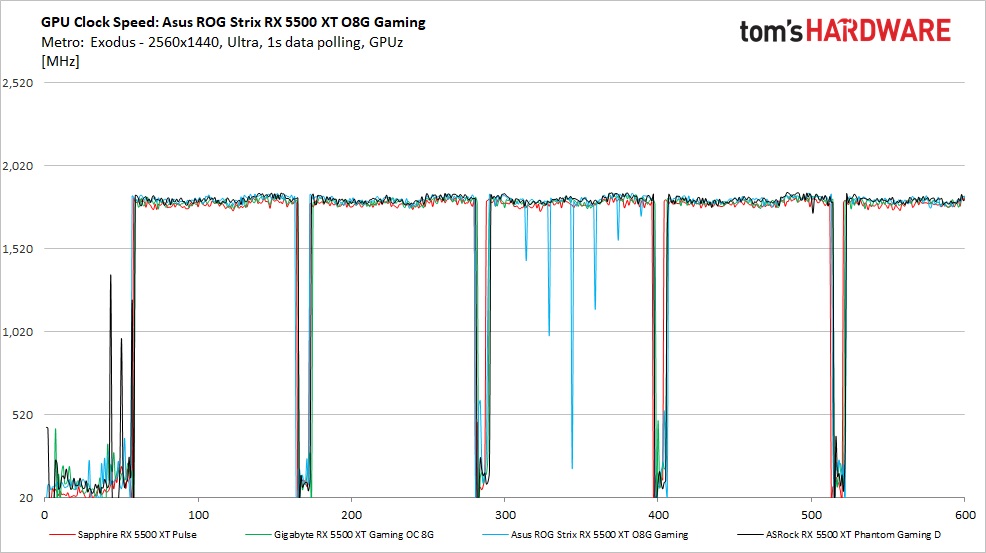
To see how each video card behaves with temperatures and fan speeds, like the power testing, we use GPU-Z logging in one-second intervals to capture data. These items are captured by looping the Metro Exodus benchmark five times, running at 2560x1440 and ultra settings.
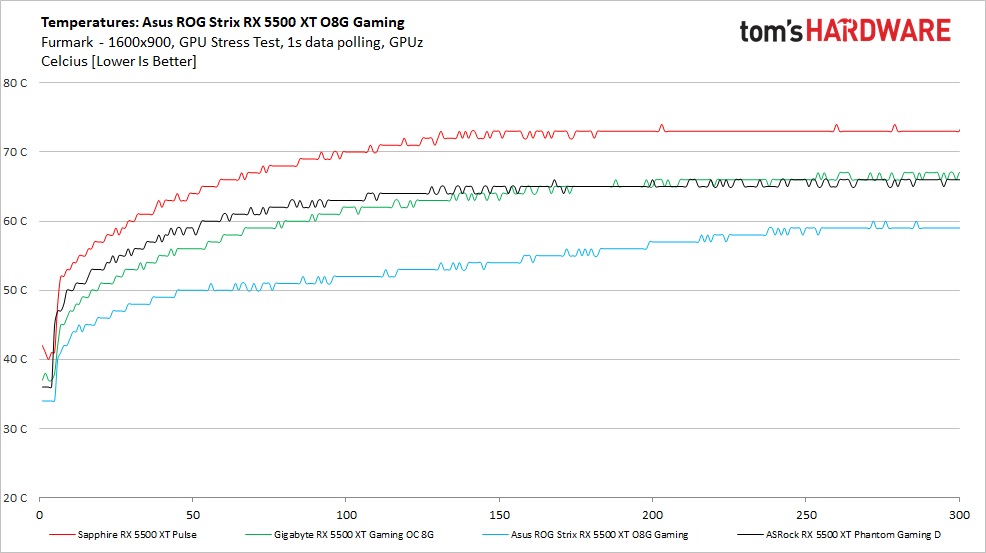
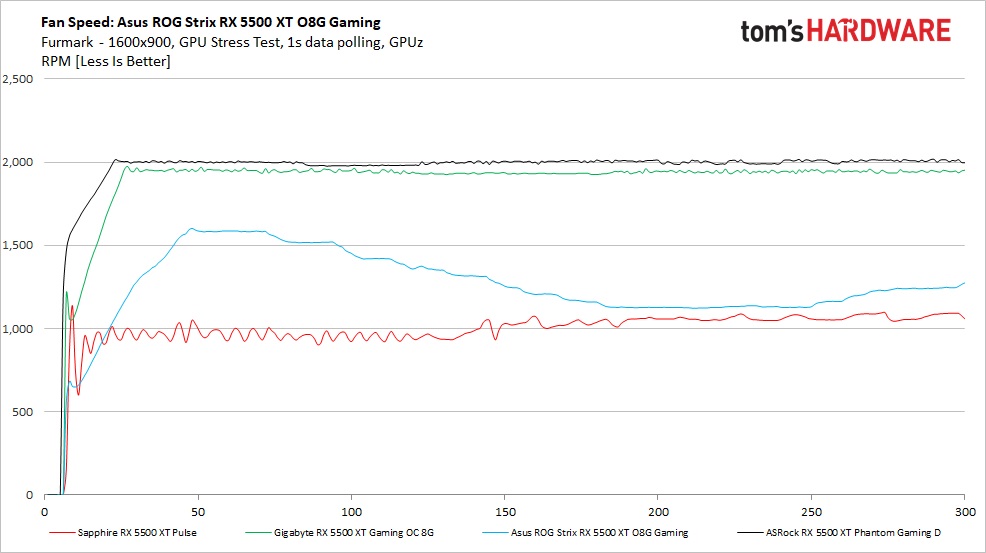
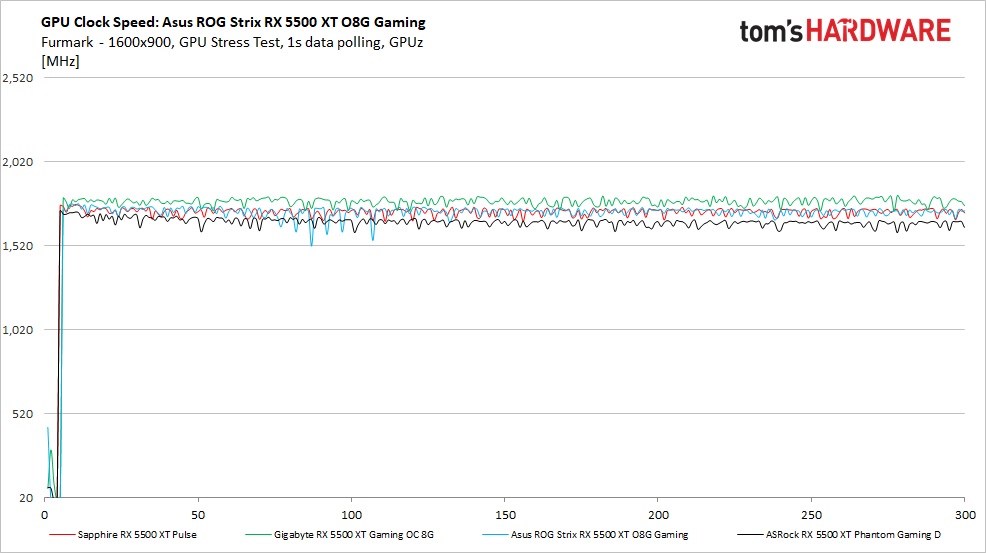
Additionally, we also use FurMark to capture the data below, which offers a more consistent load and uses slightly more power, regardless of the fact that the clock speeds and voltages are limited. These data sets give insight into worst-case situations along with a non-gaming workload.
Get Tom's Hardware's best news and in-depth reviews, straight to your inbox.
Gaming
Temperatures for the ASRock Phantom Gaming D averaged almost 62 degrees Celsius during gaming testing. This result places it in the middle with the Gigabyte Gaming OC. The Sapphire Pulse ran the warmest at 69 degrees Celsius, at least partly because its fan speeds are lower, while the much larger Asus ROG Strix RX 5500 XT O8G Gaming ran the coolest at 54 degrees Celsius. Though the Phantom Gaming D didn’t have the best cooling solution, it worked quietly and kept the video card running well within specification.
Fan speeds during the Metro: Exodus test show all cards except for the Sapphire Pulse have significantly varying fan speeds. The ASRock varied throughout the test from around 1600 RPM to a peak of 2,000 RPM. The higher fan speeds were more noticeable over the slower spinning Asus and Gigabyte cards, but none were particularly loud or off-putting. During more typical gaming loads (where there isn’t a scene change every 100 seconds) users should not see this fan behavior.
Clock speeds on the ASRock Phantom Gaming D averaged 1,818 MHz during the last phase of the gaming test. This result is over 20 MHz faster than the Sapphire Pulse (1,794 MHz), 10 MHz faster than the Gigabyte and 2 MHz faster than the Aus. This result makes sense considering the 8GB cards' clock speeds are similar out of the box. Another noteworthy fact is how much the 4GB of memory on the Sapphire card affects results with core clock speeds being similar to all the other tested cards.
Furmark
Temperatures in Furmark ran a couple of degrees warmer than game testing across all tested cards. The ASRock Phantom Gaming D and Gigabyte Gaming OC both peaked at 67 degrees Celsius with the Asus again coming in the coolest running at 60 degrees Celsius. The slower Sapphire card peaked at 74 degrees Celsius with a similar size cooling solution as the Phantom Gaming D.
Fan speeds during Furmark testing stabilized across all cards with the ASRock again peaking around 2,000 RPM. Unlike the Asus O8G Gaming, the ASRock Phantom Gaming D maintained these speeds throughout the test. While the ASRock video card doesn’t have the best cooling solution, it kept the card well within specification and did so relatively quietly.
Clock rates during the Furmark testing averaged 1,661 MHz, which is the lowest value by far of all three RX 5500 XT 8GB cards tested. Compared to the game test, the result for the Phantom Gaming D is over 150 MHz less than game testing.
MORE: Best Graphics Cards
MORE: Desktop GPU Performance Hierarchy Table
MORE: All Graphics Content
Current page: Power Consumption, Fan Speeds, Clock Rates and Temperature
Prev Page Performance Results: 1920 x 1080 (Medium) Next Page Software: ASRock Tweak
Joe Shields is a staff writer at Tom’s Hardware. He reviews motherboards and PC components.
-
NightHawkRMX What's with the pulse 5500xt being so far behind the other models? It runs at the same clocks according to your test but performs worse.Reply -
EndEffeKt_24 Reply
Its the only 4GB model and the test uses ultra settings.NightHawkRMX said:What's with the pulse 5500xt being so far behind the other models? It runs at the same clocks according to your test but performs worse. -
NightHawkRMX Reply
Somehow overlooked that. ThanksEndEffeKt_24 said:Its the only 4GB model and the test uses ultra settings. -
King_V The table on the first page of the review, with the specs for the 4 cards has the wrong information for the Asus ROG Strix 5600 XT for memory capacity, bus, and bandwidth.Reply -
JarredWaltonGPU Reply
Sorry, I've corrected this. It was the name: it's supposed to be the Asus ROG Strix RX 5500 XT O8G Gaming (not the Asus ROG Strix RX 5600 XT O8G Gaming, which isn't even a real product given there aren't 8GB 5600 XT cards). The specs were correct, the name was not.King_V said:The table on the first page of the review, with the specs for the 4 cards has the wrong information for the Asus ROG Strix 5600 XT for memory capacity, bus, and bandwidth. -
King_V LOL, I didn't even look fully at the name, I just zoomed in on 5600XT and, when I got to the memory specs, my brain did the record-scratching noise and said "wait, what??"Reply -
JarredWaltonGPU Reply
I actually googled the name for the Asus specs page and got the 5600 XT O6G page. I started editing, and thought, "How did we get these specs SO WRONG!?" Then I realized it was actually the product name that was an error. I was about to redo the whole table, thinking I was somehow looking at the 5600 XT review (which I edited a few weeks back). LOLKing_V said:LOL, I didn't even look fully at the name, I just zoomed in on 5600XT and, when I got to the memory specs, my brain did the record-scratching noise and said "wait, what??" -
King_V Sort of reminds me of when the RTX cards first came out. It got really funny trying to remember whether to type RTX, RX, or GTX...Reply -
JarredWaltonGPU Reply
It's still bad! Muscle memory for typing is a harsh mistress. I've had some very odd 'typos' crop up over the years, including just stupid stuff like writing "their" instead of "there" or "they're". Like, I know the difference, but sometimes in my brain I think "they're" and my fingers receive "their" and I look like an idiot. I have typed GTX 2080 more times than I can count, though now it's starting to go the other way -- I've typed RTX 1660 quite a few times now.King_V said:Sort of reminds me of when the RTX cards first came out. It got really funny trying to remember whether to type RTX, RX, or GTX... -
King_V ReplyJarredWaltonGPU said:It's still bad! Muscle memory for typing is a harsh mistress. I've had some very odd 'typos' crop up over the years, including just stupid stuff like writing "their" instead of "there" or "they're". Like, I know the difference, but sometimes in my brain I think "they're" and my fingers receive "their" and I look like an idiot. I have typed GTX 2080 more times than I can count, though now it's starting to go the other way -- I've typed RTX 1660 quite a few times now.
That happens to me a lot as well - oh, on a cellphone, I can blame it on autocorrect. But I know EXACTLY what you mean! My brain says ONE version of their/they're/there, and my hands just on their own type one of the others out. And I'm someone who generally cringes when I see other people mix those up, so it's particularly strange and embarrassing for me!
