Why you can trust Tom's Hardware
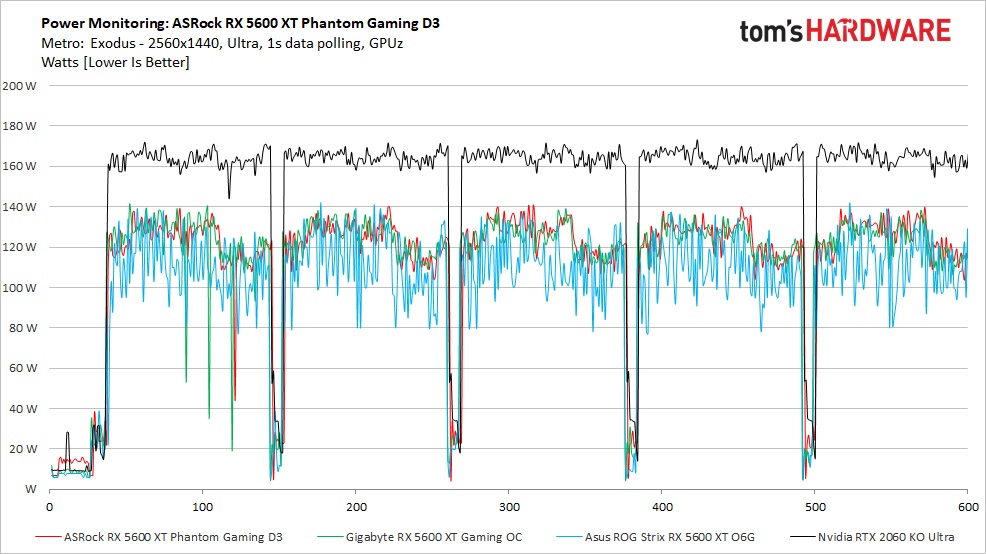
We use GPU-Z logging to measure each card's power consumption with the Metro Exodus benchmark running at 2560 x 1440 using the default Ultra settings. The card is warmed up prior to testing and logging is started after settling to an idle temperature (after about 10 minutes). The benchmark is looped a total of five times, which yields around 10 minutes of testing. In the charts, you will see a few blips in power use that are a result of the benchmark ending one loop and starting the next.
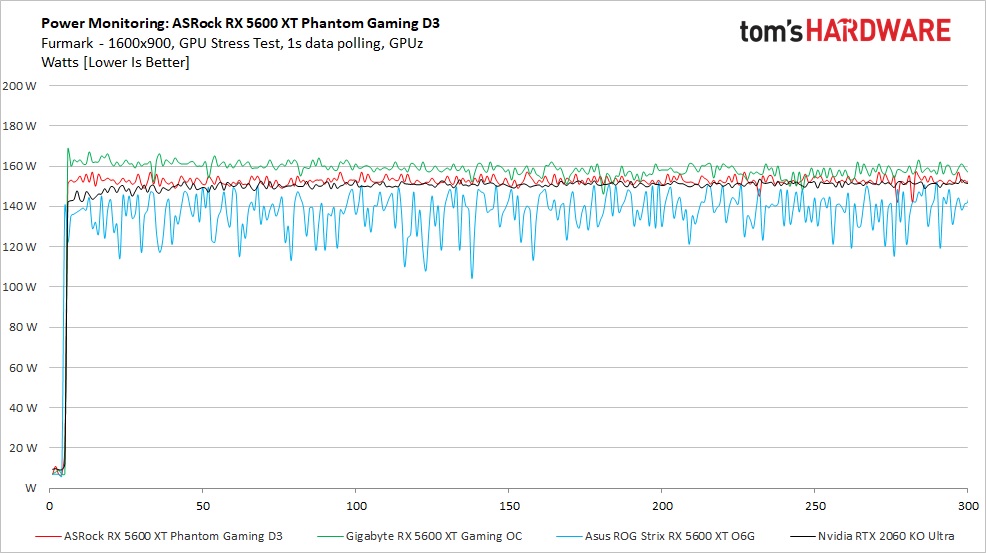
We also use FurMark to capture worst-case power readings. Although both Nvidia and AMD consider the application a "power virus," or a program that deliberately taxes the components beyond normal limits, the data we can gather from it offers useful information about a card's capabilities outside of typical gaming loads. For example, certain GPU compute workloads including cryptocurrency mining have power use that can track close to FurMark, sometimes even exceeding it.
Power Draw
Starting with the gaming power charts, the ASRock RX 5600 XT Phantom Gaming D3 averaged 125W. This result puts the review card 3W above the Gigabyte Gaming OC (122W), and 13W above the similarly clocked Asus (111W). When comparing it to the EVGA RTX 2060 KO Ultra at 164W, the ASRock appears to use a lot less power. However, this value is from the GPU only. When considering total board power (TBP), the results will be closer.
Moving on to Furmark, The ASRock card averaged 152W which places it between the Gigabyte Gaming OC (158W) and the Asus ROG Strix (137W). The EVGA KO Ultra used less power than in gaming due to how Turing behaves in this application and averaged 150W. Both the RTX 2060 and RX 5600 XT are similar in power when considering the TBP for AMD.
Temperatures, Fan Speeds and Clock Rates
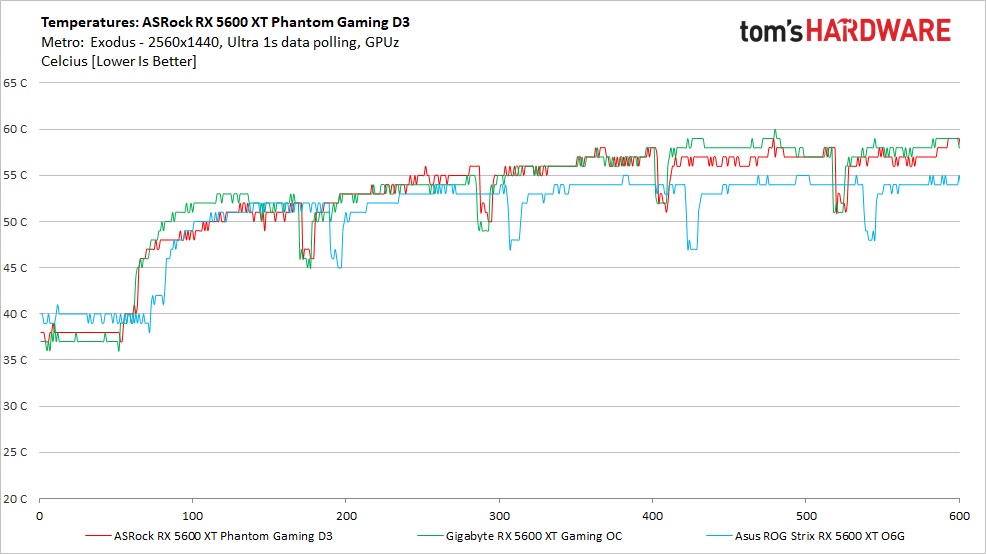
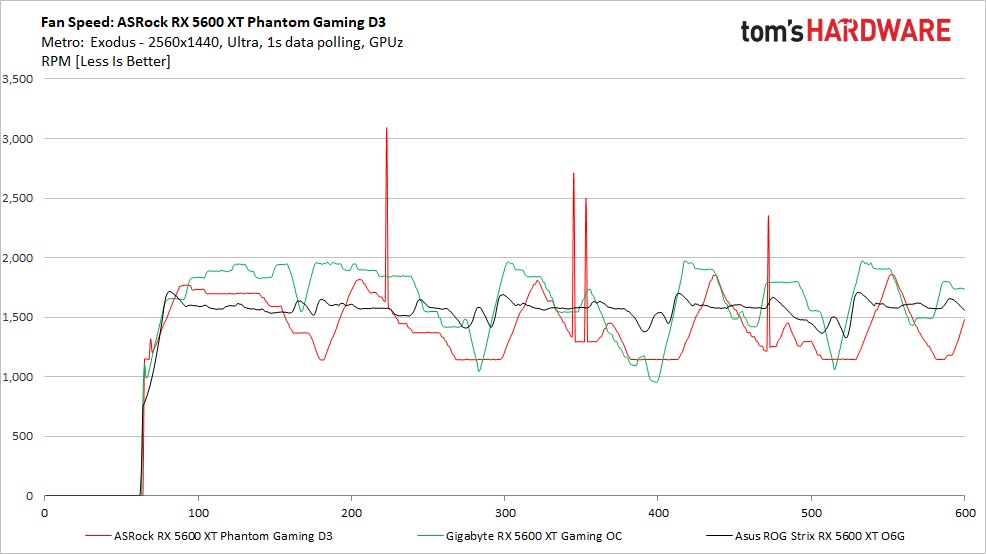
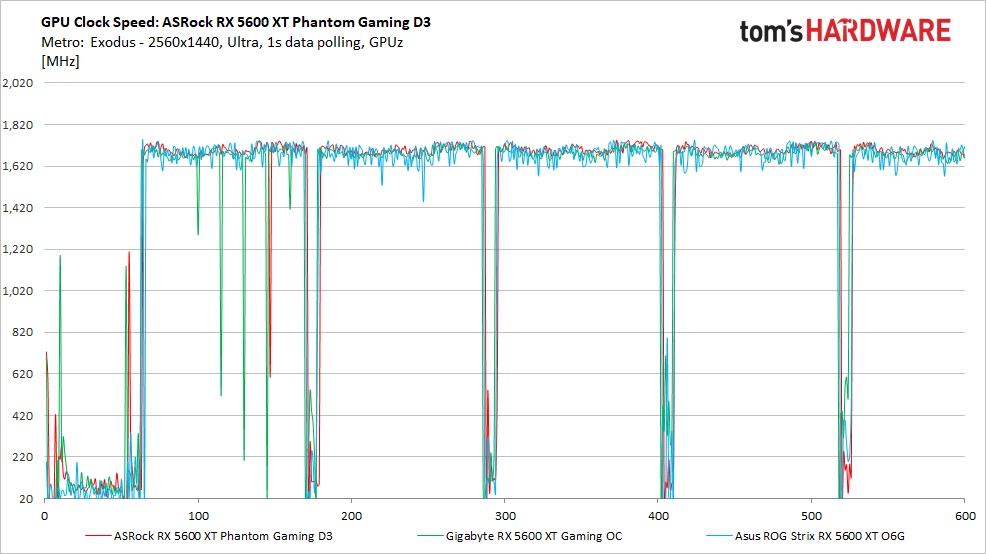
To see how each video card behaves, like the power testing, we use GPU-Z logging in one-second intervals to capture data. These items are captured by looping the Metro Exodus benchmark five times, running at 2560 x 1440 and ultra settings.
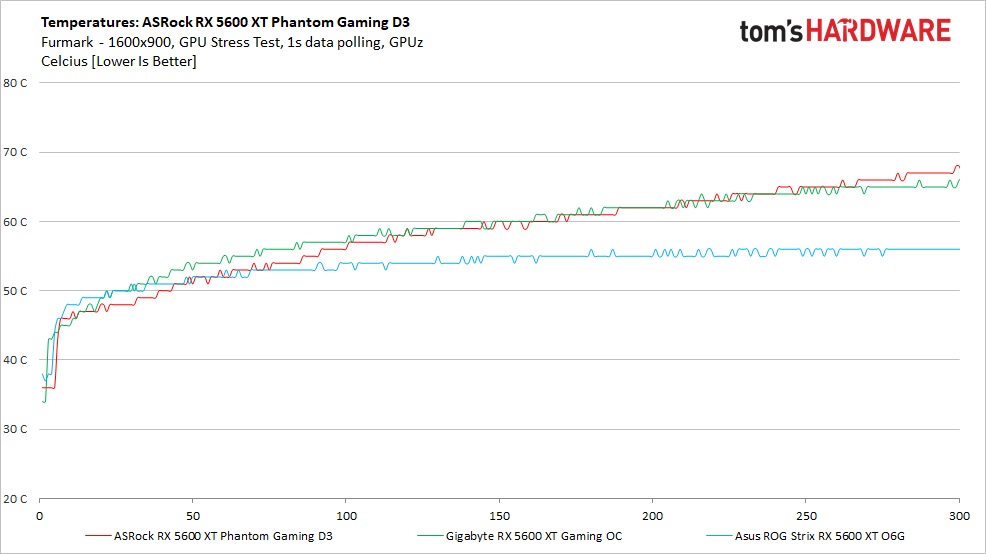
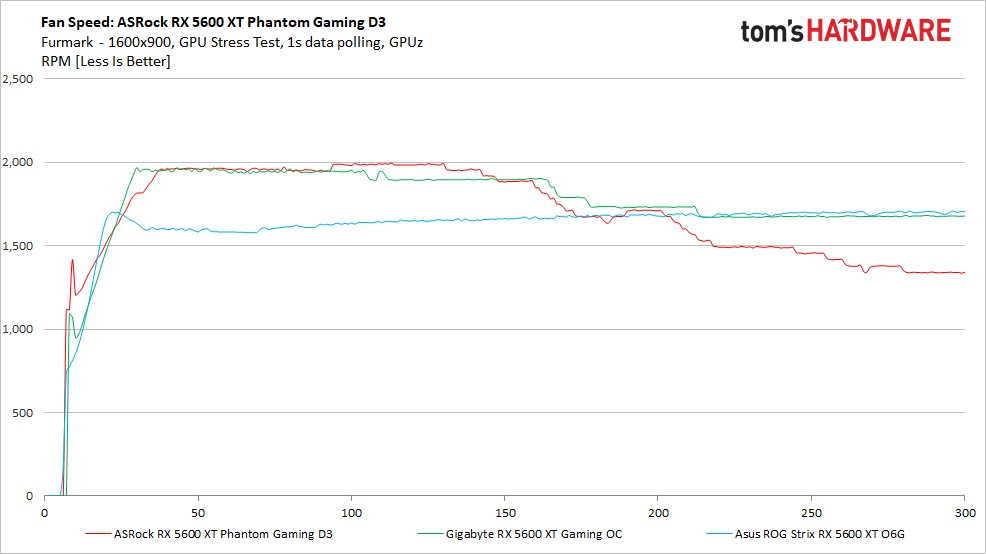
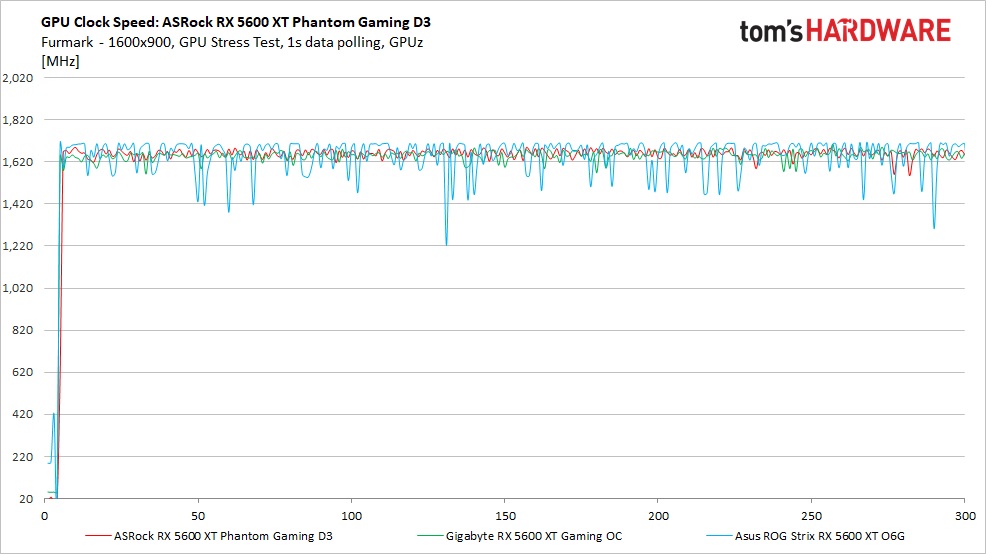
Additionally, we also use FurMark to capture the data below, which offers a more consistent load and uses slightly more power, regardless of the fact that the clock speeds and voltages are limited. These data sets give insight into worst-case situations along with a non-gaming workload.
Temperatures in our game testing reached 59 degrees Celsius on our Phantom Gaming D3 and the Gigabyte Gaming OC. The Asus card ran cooler peaking at 55 degrees Celsius, however, that card displayed some wonky behavior with power fluctuating wildly during testing. Temperatures for this test are well within operating specifications.
Get Tom's Hardware's best news and in-depth reviews, straight to your inbox.
Fan speed on the ASRock card ramped up and down rather quickly in this test, similar to the Gigabyte, and averaged around 1,400 RPM. Though we see these fluctuations on the chart, they were not audible during testing. The three 75mm fans weren’t loud and didn’t project any harsh tones, blending in well with the other fans on our test PC.
Clock speeds for the Phantom Gaming D3 averaged 1,702 MHz during our gaming test, which is around 15 MHz more than the Gigabyte card. The Asus recorded 1,682 MHz average, the slowest of the bunch. As usual, the clock listed is well below the boost clock (1,750 MHz) but above the gaming clock (1,670 MHz).
The core clock speeds on these cards are so close, the performance difference comes from memory speeds. Where the Gigabyte uses 14 Gbps memory and is the faster card, both the Asus and ASRock runs 12 Gbps clock speeds leaving them both around 5% slower. The good news for the ASRock card is that it uses 14 GBps memory chips, so there's a good chance you can overclock and reach it.
FurMark
Temperatures when using Furmark were higher than when running the game test. The ASRock Phantom Gaming D3 peaked at 69 degrees Celsius, the warmest of the bunch by 1 degree Celsius. Temperatures were still slowly rising during this test, but starting to flatten out toward the end. The triple-fan cooling solution on the ASRock handled thermals well.
Fan speed results were interesting, as the ASRock card shot up to nearly 2,000 RPM at the beginning of the test, the started slowing down around the midway point. This fan behavior explains the temperatures rising throughout the test. If you are running long compute/mining loads, you may want to adjust the fan curve manually to keep temperatures and noise levels down. Even at 2,000 RPM, the noise wasn’t off-putting.
I always enjoy looking at how each video card responds to running Furmark as they work to stay under BIOS imposed power limits. In this case, the ASRock card averaged 1,659 MHz, almost 40 MHz less than the gaming tests. This isn’t much and is typical behavior in Navi based GPUs. Nvidia Turing based cards throttle quite a bit more than the AMD Navi based competition. But again, these generally aren’t realistic workloads for a gaming card.
MORE: Best Graphics Cards
MORE: Desktop GPU Performance Hierarchy Table
MORE: All Graphics Content
Current page: Power Consumption, Fan Speeds, Clock Rates and Temperature
Prev Page Performance Results: 2560 x 1440 (Medium) Next Page Software: ASRock Tweak
Joe Shields is a staff writer at Tom’s Hardware. He reviews motherboards and PC components.
