Part 3: Building A Balanced Gaming PC
What does it mean to build a truly-balanced PC? How great would it be to piece together a machine bottlenecked by neither CPU or GPU? We set forth to measure the perfect balance in seven different games and four resolutions in this third of many parts.
Pricing, Methodology, And A Sample Chart
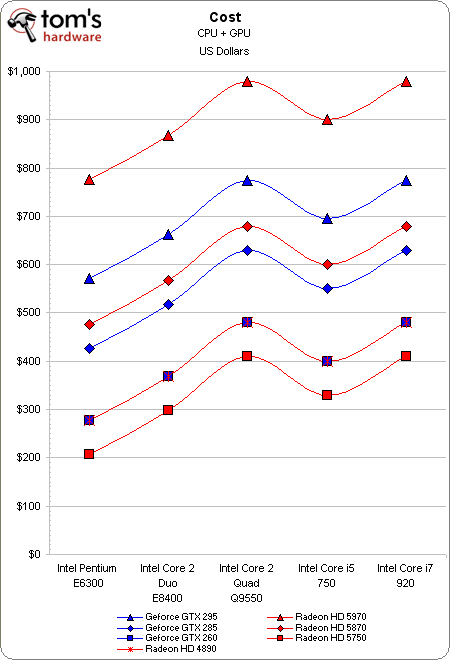
In order to establish a cost for each combination of hardware, we used Newegg to price out each pair of processors and graphics cards. Although this could be taken a step further by factoring in the cost of the motherboard, memory, and power supply, for the purpose of this series, we will leave those other variables out, as our supplementary choices were specific to pulling off x16/x16 multi-GPU CrossFire/SLI testing.
This “Cost” chart has been updated to reflect a number of fairly significant pricing changes, and again most of these are unfortunately not in favor of the consumer. The few remaining GeForce GTX 260 and Radeon HD 4890 graphics cards currently both start at $200, so you’ll notice those two cards overlap.
Plotting six GPUs paired up to four CPUs at four different resolutions in our typical horizontal bar charts was a less-than-ideal exercise. While having the advantage of displaying the exact FPS in data labels, the bigger picture was all but lost in an overwhelming number of rather humongous charts. Instead, we switch things up for this series and will plot all data in line charts. This was an idea presented to us by the guys over at Nvidia as we discussed this project with them.
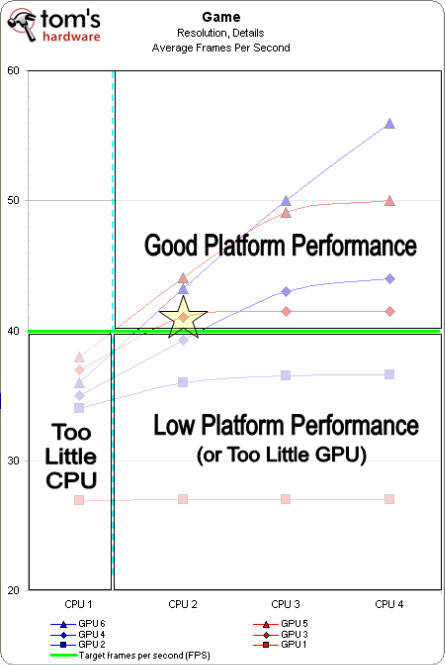
We’ll use a separate line chart for each resolution and cover one game per page. The y-axis represents average frames per second (FPS), and to keep our data as spaced out as possible, we won't use zero as our starting point. In the x-axis, you’ll see the CPUs tested, ordered from least expensive to most expensive. Our six GPUs are listed down in the legend, with each brand represented by a blue or red series. Each specific model is then distinguished by the shape of the data point, with triangles representing the most expensive, diamonds in the middle, and squares signifying the least expensive cards. We’ll continue to use the same sample chart, but actual data charts for Part 3 will plot five processors paired with seven graphics cards.
Let’s break this down even further with some sample data. First, we set a target line (in green) at our desired FPS for the game. Then, we plot all of the data. Each data point landing above the target line represents an acceptable level of platform performance for the CPU/GPU combination in the game in question and resolution tested. For data points below the target line, the platform performance is too low.
In this example, all six GPUs start below the target line, as CPU 1 is not powerful enough to deliver the desired performance at the tested settings. We insert a dashed light blue vertical line at the first point a data series crosses over the target line, which provides us a quadrant where we know “too little CPU performance” is causing the platform bottleneck. Data points in the remaining lower quadrant represent low platform performance from either too little graphics muscle, or a combination of too little GPU/CPU.
Now let’s focus on the upper quadrant of data points, which do reach the target or desired level of playability. The cheapest acceptable solution in this case is CPU 2 and GPU 3. If we follow GPU 3’s series even further, we see little benefit from stepping up to a higher-performance CPU. As a result, we can surmise that, in this example, our cheapest solution is also well-balanced. Pairing more GPU with CPU 2 adds a little performance, but shifts the platform out of balance towards a CPU bottleneck, as both of the high-end GPUs pick up a substantial performance boost when paired with more CPU power. By studying the charts, you’ll soon see that CPU limitations are represented by steep upward slopes, while GPU-limited situations are illustrated by flat horizontal lines, such as those seen on GPU 1 and 2 in the example.
Get Tom's Hardware's best news and in-depth reviews, straight to your inbox.
Inevitably, someone will bring this up. So let’s just say clearly right now that there are some variables and limitations to a story like this. For starters, not all gamers have the same frame rate demands for the various types of games that they play. In competitive online shooters, high frame rates are desired as to not give the competition an edge in reaction time. In single-player games, gamers typically want to maximize visual quality, while maintaining acceptable performance. Of course, each person’s idea of what is acceptable will vary. We’ll try to explain how and why we chose the target for our minimum recommendations in each game, and of course plot all data so that readers can see what best suits their individual preference.
Also, as with all game benchmarking, testing methods or the maps/levels tested will provide varied results from one to the next. At Tom’s Hardware, we typically use repeatable tests as long as they still relate to the demands of gameplay. But then again, even the style or tactics practiced by individual gamers will account for varied performance during actual game play. For example, do you practice stealth tactics, snipe from afar, or blaze down a path with a vehicle-mounted machine gun ripping up all of vegetation in sight? Each style will, at times, place different demands on the system components, resulting in different levels of performance. While a “worst-case” scenario is the safest general situation to paint, it still may or may not represent the performance your gaming style will generate. With that said, let’s get to it.
Current page: Pricing, Methodology, And A Sample Chart
Prev Page Memory, Hard Drive, Power Supply, Coolers Next Page Overclocking, Test System Configuration, And Benchmarks-
liquidsnake718 I love how on the first page picture of all the games on this article show the games that truly take a toll on GPU's and CPU's. You are however missing Metro 2033 and Dirt 2 in DX11 which obliterates some GPUs in DX11!Reply -
IzzyCraft A metro 2033 graph wouldn't be interesting it would start at 0 and end at 5 for most set ups :DReply -
The choice of Corsair Dominator for the RAM is surprising, given that there are equally fast and stable choices at a much lower price point. OCZ, G Skill, Crucial, etc. I still love their power supplies though.Reply
-
duk3 ColMirageGlad to see the last part of the series. Very useful!Reply
They mentioned a part 4 in the article, with overclocking AMD processors. -
kaintfm The choice of Corsair Dominator for the RAM is surprising, given that there are equally fast and stable choices at a much lower price point. OCZ, G Skill, Crucial, etc. I still love their power supplies though.Reply -
agnickolov And where is the Core i3 530? This is the real gaming gem of a CPU, but I hardly see it in any reviews @ Tom's...Reply -
manitoublack Bought 2 GTX295's on release and run them on my i7-920, in SLi at 640MHz. Still over a year on and there still almost top dog.Reply
Great review Toms, and makes it easier to sleep at night knowing that 14months on little can touch what I've got regardless of the $1600AUD buyin. -
FUtomNOreg Very enlightening though, given my current rig's specs, thoroughly depressing. Curse you for breaking my delusion that my PC was adequate! I feel an overwhelming urge to upgrade coming on.....Reply

