Part 1: Building A Balanced Gaming PC
Pricing, Methodology, And A Sample Chart
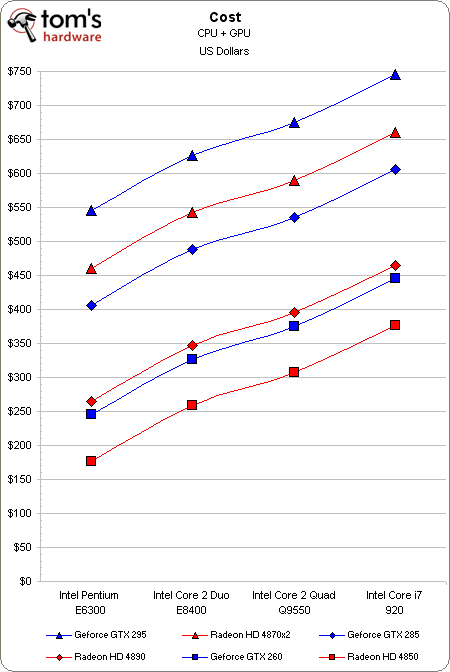
In order to establish a cost for each combination of hardware, we used Newegg to price out each pair of processors and graphics cards. Although this could be taken a step further by factoring in the cost of the motherboard, memory, and power supply, for the purpose of this series, we will leave those other variables out, as our supplementary choices were specific to pulling off x16/x16 multi-GPU CrossFire/SLI testing.
Note that with the introduction of the Radeon HD 5800-series graphics cards, ATI's Radeon HD 4870 X2 briefly dropped to $330 before availability dwindled and the last model was deactivated. Therefore, we searched other sites to find the best current price of $380 for a new Radeon HD 4870 X2. As you can see in the chart below, we are looking at CPU/GPU combinations ranging from $177 to $745 dollars at the time of writing.
Plotting six GPUs paired up to four CPUs at four different resolutions in our typical horizontal bar charts was a less-than-ideal exercise. While having the advantage of displaying the exact FPS in data labels, the bigger picture was all but lost in an overwhelming number of rather humongous charts. Instead, we switch things up for this series and will plot all data in line charts. This was an idea presented to us by the guys over at Nvidia as we discussed this project with them.
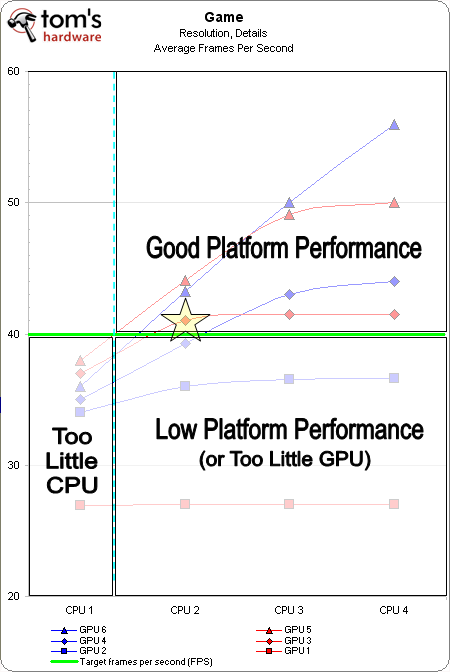
We’ll use a separate line chart for each resolution and cover one game per page. The y-axis represents average frames per second (FPS), and to keep our data as spaced out as possible, we won't use zero as our starting point. In the x-axis, you’ll see the CPUs tested, ordered from least expensive to most expensive. Our six GPUs are listed down in the legend, with each brand represented by a blue or red series. Each specific model is then distinguished by the shape of the data point, with triangles representing the most expensive, diamonds in the middle, and squares signifying the least expensive cards.
Let’s break this down even further with some sample data. First, we set a target line (in green) at our desired FPS for the game. Then, we plot all of the data. Each data point landing above the target line represents an acceptable level of platform performance for the CPU/GPU combination in the game in question and resolution tested. For data points below the target line, the platform performance is too low.
In this example, all six GPUs start below the target line, as CPU 1 is not powerful enough to deliver the desired performance at the tested settings. We insert a dashed light blue vertical line at the first point a data series crosses over the target line, which provides us a quadrant where we know “too little CPU performance” is causing the platform bottleneck. Data points in the remaining lower quadrant represent low platform performance from either too little graphics muscle, or a combination of too little GPU/CPU.
Now let’s focus on the upper quadrant of data points, which do reach the target or desired level of playability. The cheapest acceptable solution in this case is CPU 2 and GPU 3. If we follow GPU 3’s series even further, we see little benefit from stepping up to a higher-performance CPU. As a result, we can surmise that, in this example, our cheapest solution is also well-balanced. Pairing more GPU with CPU 2 adds a little performance, but shifts the platform out of balance towards a CPU bottleneck, as both of the high-end GPUs pick up a substantial performance boost when paired with more CPU power. By studying the charts, you’ll soon see that CPU limitations are represented by steep upward slopes, while GPU-limited situations are illustrated by flat horizontal lines, such as those seen on GPU 1 and 2 in the example.
Get Tom's Hardware's best news and in-depth reviews, straight to your inbox.
Inevitably, someone will bring this up. So let’s just say clearly right now that there are some variables and limitations to a story like this. For starters, not all gamers have the same frame rate demands for the various types of games that they play. In competitive online shooters, high frame rates are desired as to not give the competition an edge in reaction time. In single-player games, gamers typically want to maximize visual quality while maintaining acceptable performance. Of course, each person’s idea of what is acceptable will vary. We’ll try to explain how and why we chose the target for our minimum recommendations in each game, and of course plot all data so that readers can see what best suits their individual preference.
Also, as with all game benchmarking, testing methods or the maps/levels tested will provide varied results from one to the next. At Tom’s Hardware, we typically use repeatable tests as long as they still relate to the demands of game play. But then again, even the style or tactics practiced by individual gamers will account for varied performance during actual game play. For example, do you practice stealth tactics, snipe from afar, or blaze down a path with a vehicle-mounted machine gun ripping up all of vegetation in sight? Each style will, at times, place different demands on the system components, resulting in different levels of performance. While a “worst-case” scenario is the safest general situation to paint, it still may or may not represent the performance your gaming style will generate. With that said, let’s get to it.
Current page: Pricing, Methodology, And A Sample Chart
Prev Page Memory, Hard Drive, Power Supply, Coolers Next Page Test System Configuration And Benchmarks-
yoy0yo Wow, this is an amazingly in depth review! I kinda feel that its sponsered by Asus or Corsair, but I guess you kept with the same brand for the sake of controls etc.Reply
Thankyou! -
inmytaxi Very helpful stuff.Reply
I'd like to see some discussion on the availability of sub $400 (at times as low as $280) 28" monitors. At this price range, does it make more sense to spend more on the LCD even if less is spent initially on graphics? I would think the benefit of 28" vs. 22" is so great that the extra money could be taken from, say, a 9550 + 4890 combo and getting a 8400/6300 + 4850 instead, with the right motherboard a second 4850 later will pass a 4890 anyway. -
frozenlead I like the balance charts. It's a good way to characterize the data. This article is well constructed and well thought-out.Reply
That being said - is there a way we can compile this data and compute an "optimized" system for the given hardware available? Finding the true, calculated sweet spot for performance/$ would be so nice to have on hand every quarter or twice a year. I'll have to think about this one for a while. There may be some concessions to make, and it might not even work out. But it would be so cool. -
Neggers I feel like the person that did this review got it finished alittle bit late. I can only assume he did all the testing some months back and has only just finished writing up his results. But its sad to not see the new P55/i5 Systems, AMD Athlon II Quad Cores, or the Radeon 5000 series.Reply
Good review, but hopefully it can be updated soon with some of the newer equipment thats out, to turn it into a fantastic guide for people. -
brockh Great job, this is the information people need to be seeing; the way people provide benchmarks these days hardly tells the story to most of the readers. It's definitely important to point out the disparities in ones CPU choice, rather than just assuming everyone uses the i7 all the sites choose. ;)Reply
Looking forward to part 2. -
Onyx2291 This will take up some of my time. Even though I know how, it's nice to get a refresher every now and then.Reply -
mohsh86 you are really kidding me by not considering the ATI 5000 series, although am a fan of nvidia , but this is not fair !Reply

