Dell UltraSharp 24 Ultra HD Monitor: The $1300 UP2414Q
Dell now offers three Ultra HD monitors for your consideration. We tested the 32-inch UP3214Q last month. Today, we’re looking at the 24-inch UP2414Q. Despite its smaller size, this is still a $1000+ display. Can Dell make the trade-off worthwhile?
Results: Brightness And Contrast
Uncalibrated
Before calibrating any panel, we measure zero- and 100-percent signals at both ends of the brightness control range. This shows us how contrast is affected at the extremes of a monitor's luminance capability. We do not increase the contrast control past the clipping point. While doing this would increase a monitor’s light output, the brightest signal levels would not be visible, resulting in crushed highlight detail. Our numbers show the maximum light level possible with no clipping of the signal.
Our comparison group includes the last six monitors reviewed at Tom’s Hardware, including Asus' PQ321Q and Dell’s UP3214Q Ultra HD screens. Before we move on, all of the luminance measurements are taken with Uniformity Compensation turned off, except where noted otherwise. When it’s turned on, the monitor’s dynamic range is reduced by about 16 percent, mainly due to a higher black level. We used the fixed Adobe RGB picture mode for these tests.
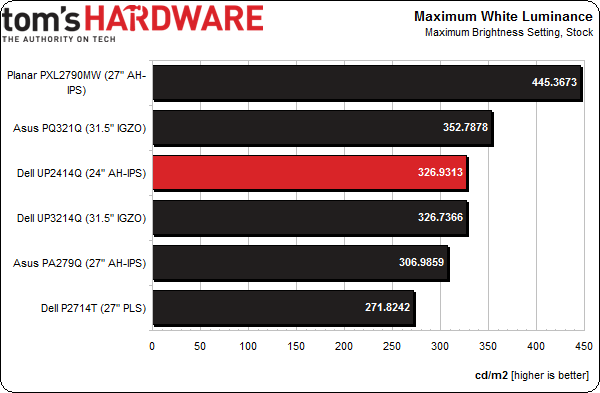
Despite their significantly different panel technologies, the UP2414Q and UP3214Q post nearly-identical max brightness numbers. This looks to us like a decision on Dell’s part to keep its products consistent across the same model line. A result of 326 cd/m2 is more than enough light output for any conceivable room environment or computing task.
Let’s see where that high backlight setting puts the black level.
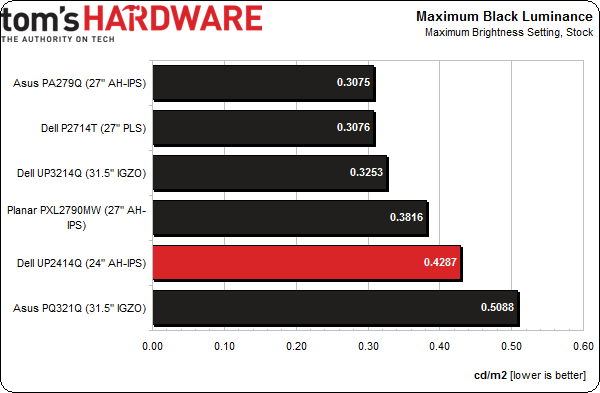
Unfortunately, .4287 cd/m2 is fairly high. You’ll see as we go on that the UP2414Q’s contrast performance isn’t quite up to the levels posted by its larger brother.
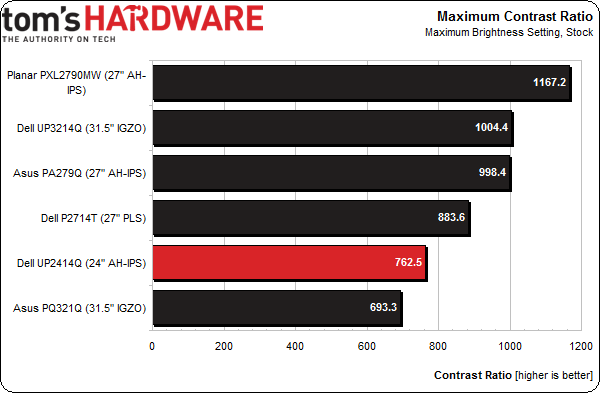
We measure 762.5 to 1, which is an average contrast ratio result. There are plenty of screens on both sides of that level. While the image has reasonable depth and pop, the larger Asus and Dell monitors deliver a bit more dynamic range.
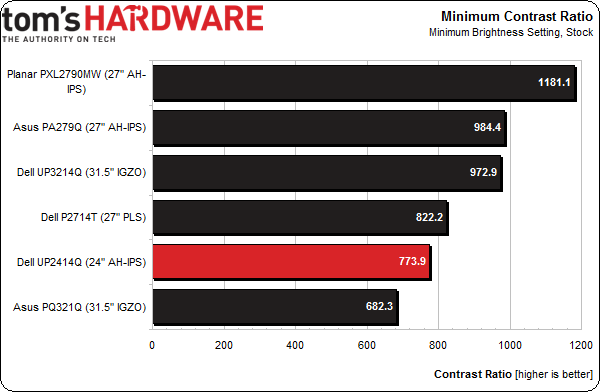
Somewhere around 50 cd/m2 is a practical minimum standard for screen brightness. Any lower and you risk eyestrain and fatigue. Some monitors, such as Dell's UP2414Q, measure under that level. We recorded a minimum white level of 38.9765 cd/m2 with the backlight turned all the way down. That's a bit too dim for practical use. Raising the brightness to six gets you 50 cd/m2.
Get Tom's Hardware's best news and in-depth reviews, straight to your inbox.
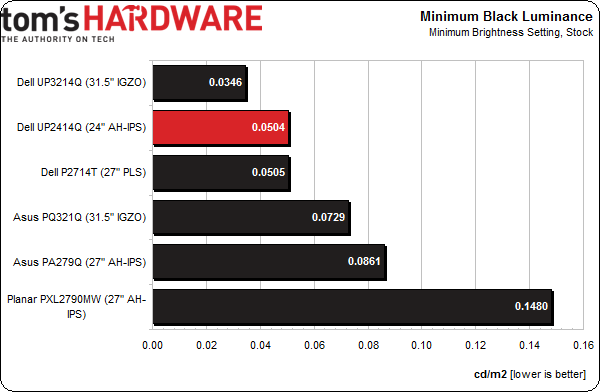
The minimum black level, however, is pretty good.
When the black level is this low, you can’t tell that the monitor is even turned on; only our i1Pro knows the truth. If you turn up the backlight to six, the black level is a still-low .0652 cd/m2. Like the UP3214Q, the UP2414Q demonstrates very consistent contrast performance.
And here are the contrast values:
No matter where you set its backlight, the UP2414Q’s contrast falls between 760 and 780 to 1. That’s the kind of consistency we like to see in any monitor. Of course, more contrast is preferable. Dell's screen doesn’t score as high as many other less expensive displays. But maintaining the same dynamic range at all brightness levels is a sign of a well-engineered product. No matter what the viewing environment, you’ll always see the same picture.
After Calibration
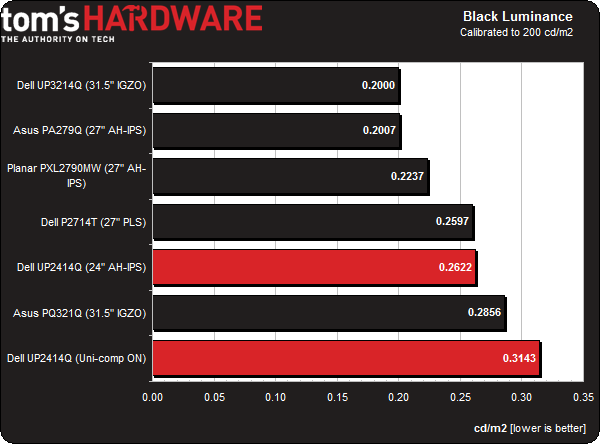
Since we consider 200 cd/m2 to be an ideal point for peak output, we calibrate all of our test monitors to that value. In a room with some ambient light (like an office), this brightness level provides a sharp, punchy image with maximum detail and minimum eye fatigue. It's also the sweet spot for gamma and grayscale tracking, which we look at on the next page. In a dark room, many professionals prefer a 120 cd/m2 calibration. Realistically, there's little to no difference in the calibrated black level and contrast measurements, though.
Here is where the different backlight and pixel structure used in Dell's UP2414Q starts to exhibit a disadvantage. We’ve already established that this screen has lower native contrast than its big brother. Even after calibration, it doesn’t improve. And if you use the Uniformity Compensation feature, there is a hit to the black level.
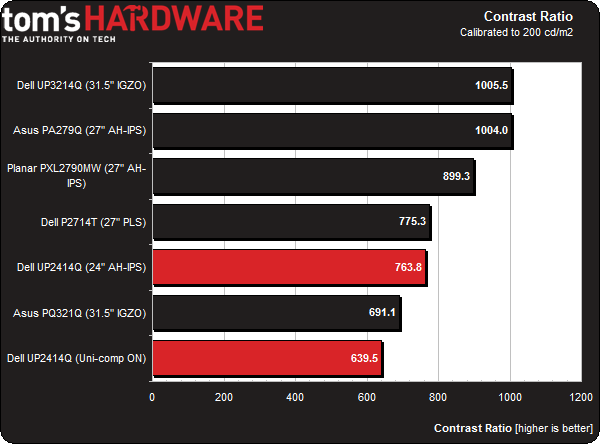
Here are the final calibrated contrast numbers:
The calibrated contrast ratio is about the same as the uncalibrated one at 763.8 to 1. That puts it near the bottom in our comparison group, but right around the middle of all the displays we’ve tested in the last year. I'm additionally including a measurement showing the result of turning on Uniformity Compensation. It does improve screen uniformity by a measurable amount, though at a cost to contrast performance.
ANSI Contrast Ratio
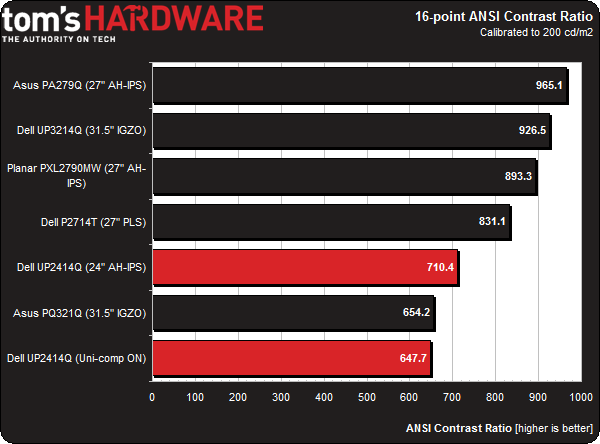
Another important measure of contrast is ANSI. To perform this test, a checkerboard pattern of sixteen zero- and 100-percent squares is measured, giving us a more real-world result than on/off measurements because it tests a display’s ability to simultaneously maintain both low black and full white levels, factoring in screen uniformity as well. The average of the eight full-white measurements is divided by the average of the eight full-black measurements to arrive at the ANSI result.
The outcome lands close to the on/off number, at 710.4 to 1. This time, the reduction in contrast is only eight percent (compared to the 16-percent drop from the previous tests). Demonstrable consistency shows that high-quality components are used in the UP2414Q’s construction, particularly the grid polarizer. Consequently, there is minimal light leakage between the darkest and brightest areas of the image.
Current page: Results: Brightness And Contrast
Prev Page Measurement And Calibration Methodology: How We Test Next Page Results: Grayscale Tracking And Gamma Response
Christian Eberle is a Contributing Editor for Tom's Hardware US. He's a veteran reviewer of A/V equipment, specializing in monitors. Christian began his obsession with tech when he built his first PC in 1991, a 286 running DOS 3.0 at a blazing 12MHz. In 2006, he undertook training from the Imaging Science Foundation in video calibration and testing and thus started a passion for precise imaging that persists to this day. He is also a professional musician with a degree from the New England Conservatory as a classical bassoonist which he used to good effect as a performer with the West Point Army Band from 1987 to 2013. He enjoys watching movies and listening to high-end audio in his custom-built home theater and can be seen riding trails near his home on a race-ready ICE VTX recumbent trike. Christian enjoys the endless summer in Florida where he lives with his wife and Chihuahua and plays with orchestras around the state.
-
dweezled This is a joke right? Dell making yet another mockery of the monitor market.Reply
Why oh why when you can get the latest 10-bit AH-IPS technology in the 2560 x 1600 30" Crossover Black Tune 30x for $700?
-
s3anister Reply13121759 said:This is a joke right? Dell making yet another mockery of the monitor market.
Why oh why when you can get the latest 10-bit AH-IPS technology in the 2560 x 1600 30" Crossover Black Tune 30x for $700?
You obviously miss the point of this monitor. The whole point of a 24" 4K monitor is the pixel density. The fact that it's 8-bit and not 10-bit probably isn't going to bother a whole ton of people and if 4K and 10-bit is what you need than you'd be looking at the Dell Ultrasharp UP3214Q anyway. http://www.tomshardware.com/reviews/ultrasharp-32-up3214q-review,3744-7.html -
Treynolds416 I love the super indepth articles you guys do, but it would be nice if you also did more reviews about less expensive things, like cases. I mean, it's interesting to read about a $1k monitor but it would be more helpful to more people if you did a case roundup or a higher volume of reviews about them. You don't have to stop making monitor reviews or anything because it's certainly not hurting anyone, but it seems like there are more articles about expensive monitors that most people can't buy/don't have a use for in lieu of articles about more fundamental pieces of computer hardware.Reply
Just my two cents -
gadgety $1300 for a simple panel is a joke, specially when "From our experience so far, these 4K monitors work well, but still have some maturing to do." Thank you for the straightforward, no nonsense review. I'll wait.Reply -
dstarr3 Ahh, 24" 4k monitors are a reality now. Antialiasing in games is soon to be a thing of the past. Which is relieving, because that makes the task on graphics cards a lot more manageable.Reply -
xenol (quote thing isn't working for me)Reply
"Ahh, 24" 4k monitors are a reality now. Antialiasing in games is soon to be a thing of the past. Which is relieving, because that makes the task on graphics cards a lot more manageable. "
It actually makes it worse if not does nothing. 4K is the equivalent, almost, of 1080p using SSAAx4. MSAA is a lot cheaper and most games are resorting to FXAA or MLAA because it's incredibly cheap, works with any rendering method (Deferred rendering doesn't play nice with MSAA), and the quality is almost as good. -
dstarr3 Reply4K is the equivalent, almost, of 1080p using SSAAx4.
And modern graphics cards can handle that kind of workload. So, since they're basically equivalent, it isn't a lot more to ask of cards to do 4k without any AA. -
soldier44 LOL 24" yeh right for that price, make it 30 inches at 4K for that price and i'll bite.Reply
