HP Envy 34c Monitor Review
HP’s new 34-inch curved Envy 34c sports a high-contrast SVA panel and DTS-tuned speakers; features that set it apart from the competition. Today we check out its performance in our benchmark suite.
Why you can trust Tom's Hardware
Grayscale Tracking And Gamma Response
Our grayscale and gamma tests are described in detail here.
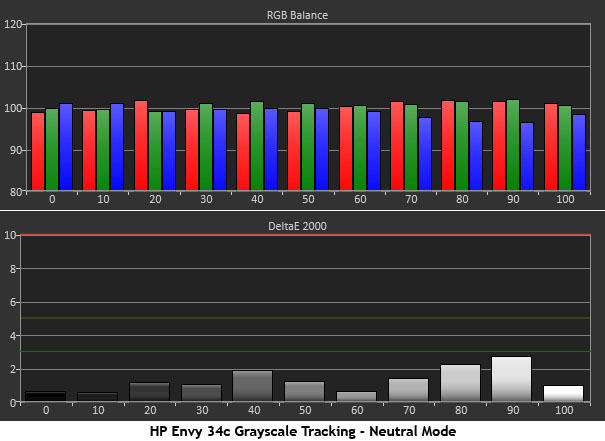
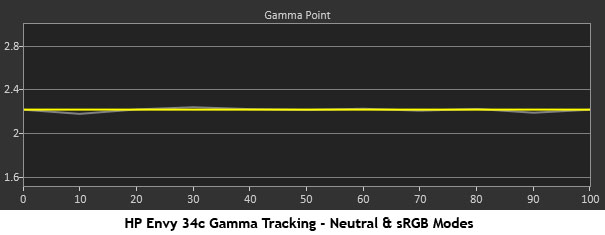
Neutral is the Envy 34c’s default color mode and it displays the best pre-calibration grayscale tracking. The errors are a little random but none are visible to the naked eye. Whites look properly neutral but as you’ll see on the next page, the red primary is a tad over-saturated in this mode.
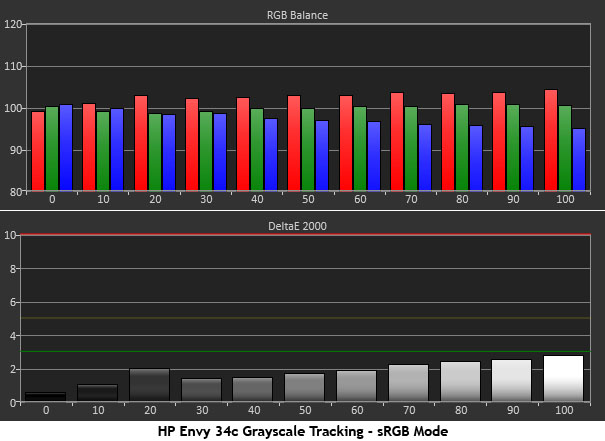
sRGB mode provides the best color gamut but it pushes the white point a little towards red. You can just see a little extra warmth in the brightest steps but it isn’t too bad and the average error is still only 1.85dE.
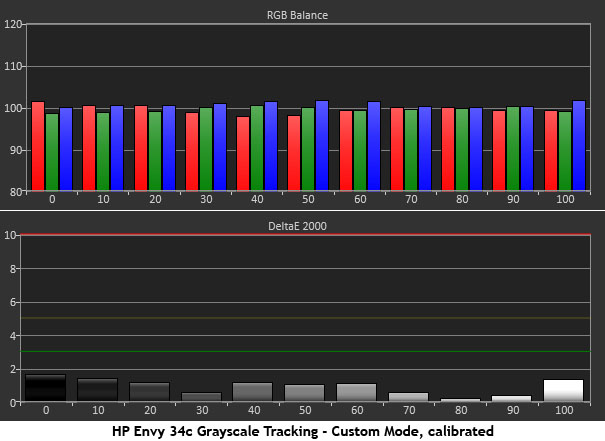
If you select the Custom RGB mode, be sure and calibrate it because without adjustment it has an average error of 4.75dE with an obvious blue-green tint. Working the RGB sliders brings the white point in line to a very low error of 1.01dE
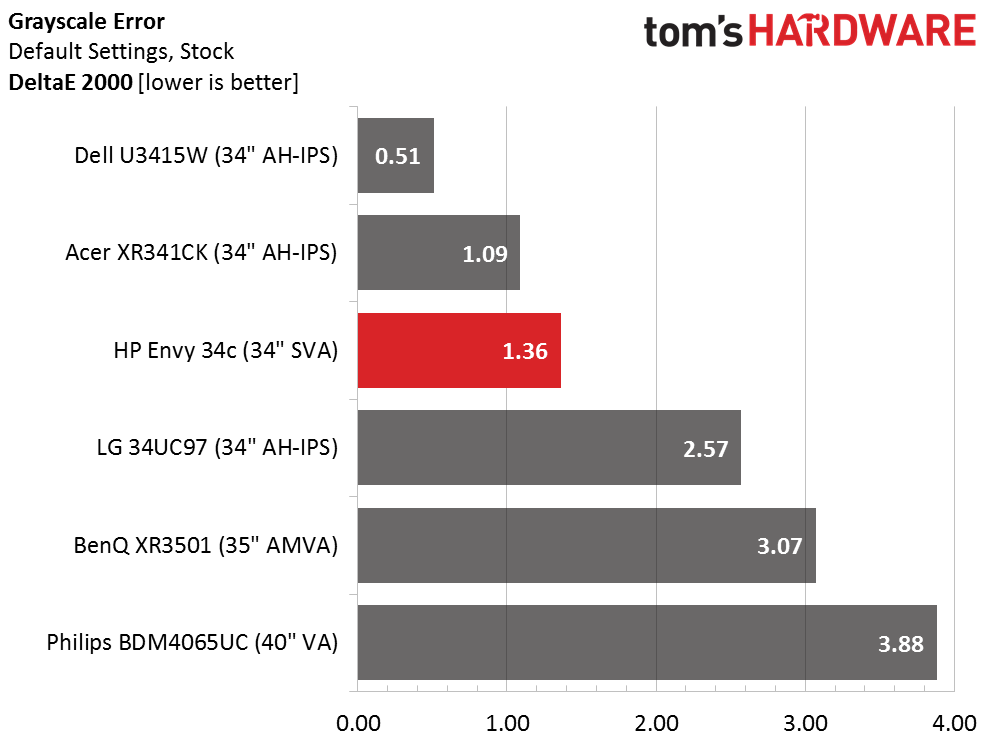
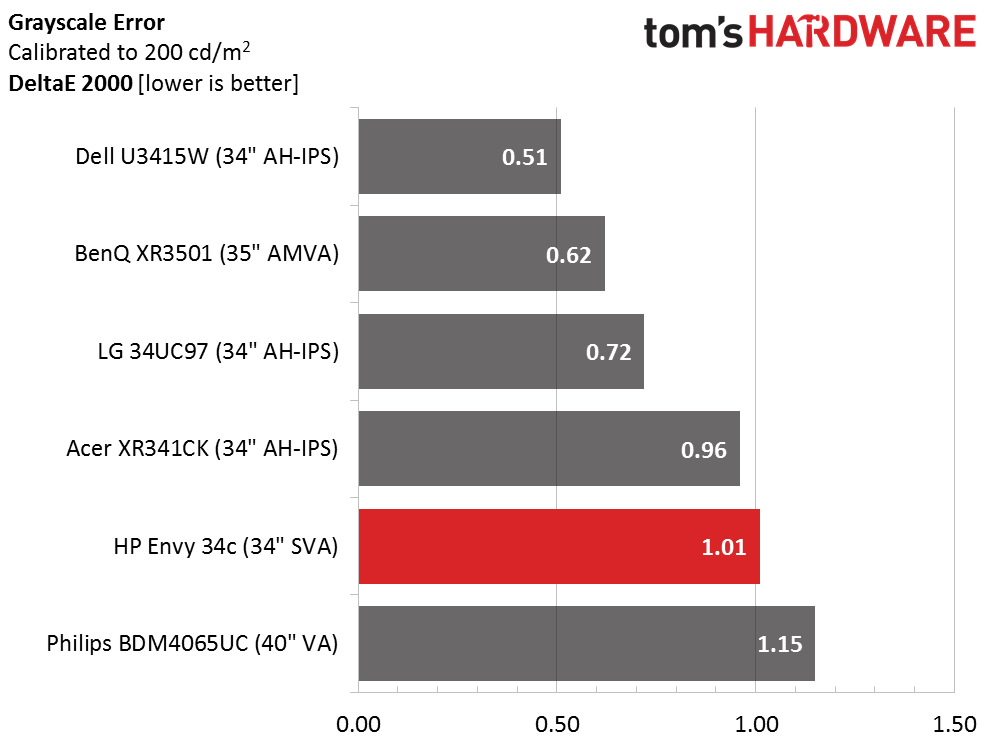
The Envy 34c acquits itself well in our group with a superb 1.36dE out-of-box result. Aside from a little red push there’s no reason you can’t just set Brightness to taste and enjoy the monitor unadjusted in Neutral mode.
The Custom RGB mode brings a small improvement but four other screens measure a little better. The Dell U3415W is aimed at professionals for a good reason. But there’s no reason you couldn’t use the HP for photo and graphics work.
Gamma Response
Gamma is absolutely perfect in the Neutral and sRGB modes. There are no presets so we’re glad to see HP got it right.
Get Tom's Hardware's best news and in-depth reviews, straight to your inbox.
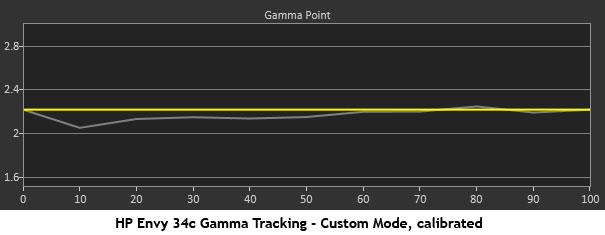
After calibration in the Custom RGB mode, gamma tracking isn’t quite as good but your eye will barely notice. Tracking is a tad below the line in the darker shades which will actually improve shadow detail slightly. We’re talking about microscopic errors here. Why did this happen? We think it’s because the RGB sliders can only be lowered. If they started at center-range it would be possible to leave gamma unaffected.
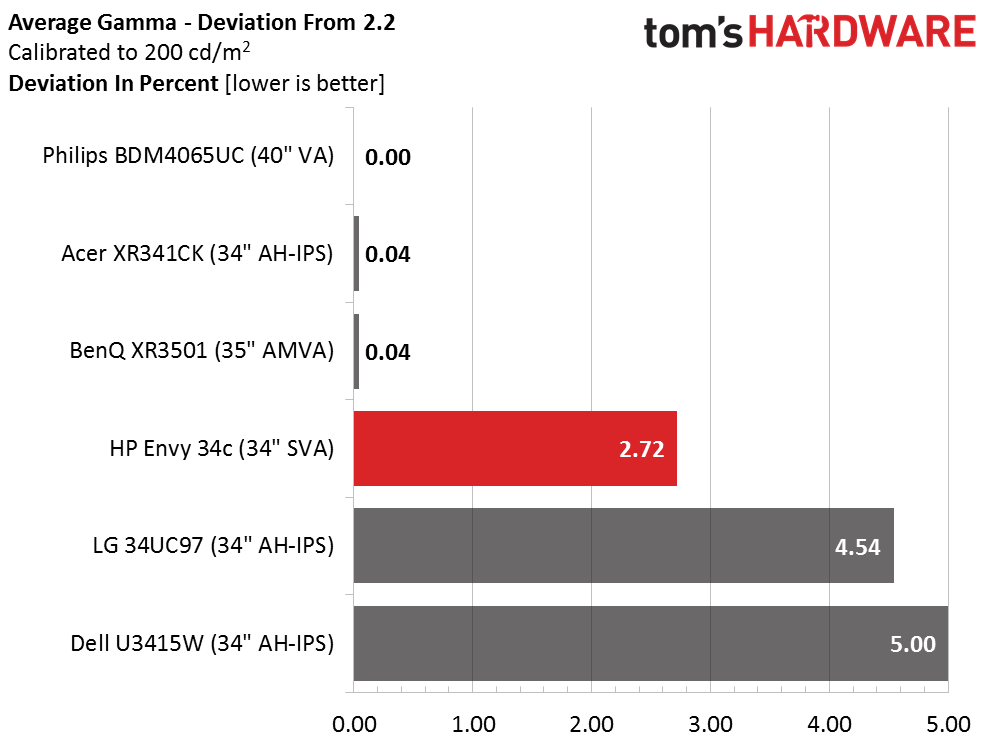
Here is our comparison group again.
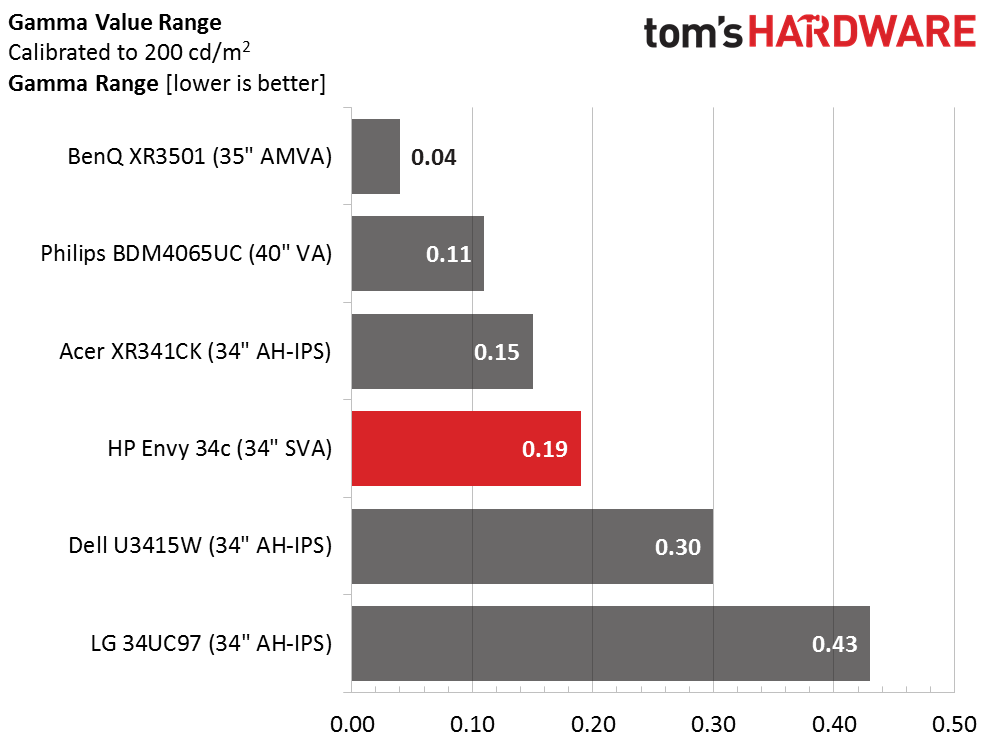
A range of .19 indicates tight gamma tracking as shown by the previous charts. Even though performance takes a slight hit during calibration, it’s still an excellent result.
We calculate gamma deviation by simply expressing the difference from 2.2 as a percentage.
The average value is 2.14 which raises the deviation percentage just a bit. These results should not be correlated to which screen technology is in use. VA and IPS are evenly distributed here.
Current page: Grayscale Tracking And Gamma Response
Prev Page Brightness And Contrast Next Page Color Gamut And Performance
Christian Eberle is a Contributing Editor for Tom's Hardware US. He's a veteran reviewer of A/V equipment, specializing in monitors. Christian began his obsession with tech when he built his first PC in 1991, a 286 running DOS 3.0 at a blazing 12MHz. In 2006, he undertook training from the Imaging Science Foundation in video calibration and testing and thus started a passion for precise imaging that persists to this day. He is also a professional musician with a degree from the New England Conservatory as a classical bassoonist which he used to good effect as a performer with the West Point Army Band from 1987 to 2013. He enjoys watching movies and listening to high-end audio in his custom-built home theater and can be seen riding trails near his home on a race-ready ICE VTX recumbent trike. Christian enjoys the endless summer in Florida where he lives with his wife and Chihuahua and plays with orchestras around the state.
-
HideOut I'd like a 2K version of one of these things. Speakers not needed. I have a DTS 5.1 in the office already. But my GPU isn't going to drive a 4k well. Even 2K will be hard but its cheaper to upgrade to a 2K capable card.Reply -
Shankovich Guys for this price, if you're not going to go above 60 Hz, as I see this is a more a workstation thing, 10-bit colour at least ;-;Reply -
picture_perfect ReplyI'd like a 2K version of one of these things. my GPU isn't going to drive a 4k well.
Yea. It's less than 4K but it's still too much. Lower frame rates are innately blurry on LCD, which makes spending money on quick pixel response times pointless. Also throw those low input lag numbers out the window when frame rendering takes this long. And of course enjoy some low frame rate jitters (with or without G-sync). I would spend another grand on dual gtx980s to get this monitor working like expected...well no, actually I wouldn't. -
MetzMan007 Free Sync, Almost makes me want to switch from Nvidia to ATI. Very Good looking screen, Almost Sexy in its own way.Reply -
Merry_Blind I'd really like to see a VA panel designed for gaming, with lowest input lag and response time possible. To me it's the technology that looks the best between it, TN, and IPS, but it seems to be the worst in terms of speed... which isn't good for gaming.Reply
