JMicron Returns: The JMF667H Controller On Four Reference SSDs
It's rare that we get the chance to test SSDs before they hit production. But after waltzing with Silicon Motion's SM2246EN platform last year, JMicron offered us a handful of reference drives with different types of flash, all driven by the new JMF667H.
Results: PCMark 8 Storage Consistency Testing
Futuremark's PCMark 8 expanded storage tests are awesome. With so much data and a comprehensive testing regimen, we can really drill down on drive performance.
First, the raw block device (there is no partition) is preconditioned twice by filling the entire accessible LBA space with 128 KB sequential writes. Once that is completed, the first Degradation Phase randomly writes blocks between 4 KB and 1 MB in size to random LBA spaces on the drive. Since the writes aren't 4 KB-aligned much of the time, the SSD's performance drops quickly. After all, non-4 KB-aligned accesses create overhead and generally increase write amplification significantly.
The first Degradation Phase begins with 10 minutes of those punishing random offset writes, after which each PCMark 8 activity trace is played against the SSD being tested. The successive degradation rounds are similar, except an additional five minutes are tacked onto each iteration. After eight repetitions, that write period expands to 45 minutes.
Next comes the Steady Phase. Each of five Steady Phases writes 45 minutes worth of random offset data prior to trace playback, pushing the drive even harder and making it more difficult to perform housekeeping duties. With fewer blocks available for writing, latency increases substantially.
Lastly, PCMark 8 moves into a Recovery Phase, which consists of five idle minutes before trace playback. Repeat that five times, and the test concludes.
For more information on the test and how it works, check out Plextor M6e 256 GB PCI Express SSD Review: M.2 For Your Desktop.
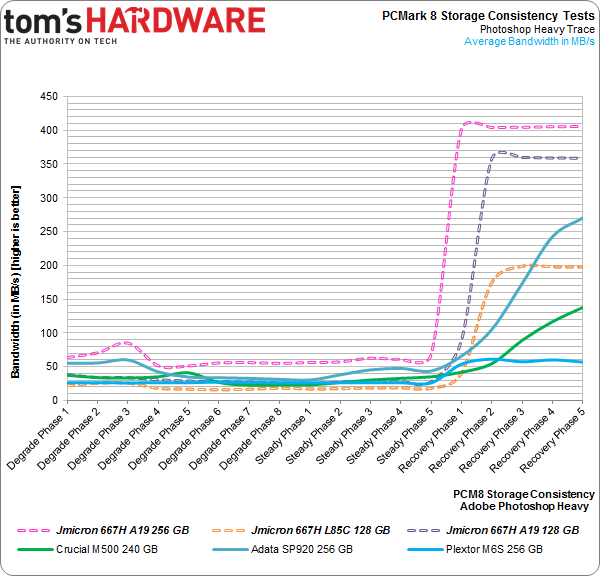
Storage Consistency With PCMark 8's Adobe Photoshop (Heavy) Trace
Because there are 18 individual rounds packed with 10 traces each, we need to focus. We'll choose one trace, Adobe Photoshop (Heavy), and keep tabs on it through the entire extended run.
Get Tom's Hardware's best news and in-depth reviews, straight to your inbox.
Bandwidth
Since you're this far into my story, I'll confess something to you: I love storage testing. But, I love good storage tests even more. It's a shame that the storage consistency test isn't available for normal PCMark 8. Only super-special people get it, limiting access to advanced users, including members of the media. If you really want to check it out, it'll cost you as much as a well-equipped Ultrabook.
This is what I'm talking about. Pitted against three Marvell-based drives at 256 GB, both 128 GB JMF667H-powered SSDs and the 256 GB A19-equipped model rise above the crowd. Give JMicron's controller a little room to breathe (or five minutes of idle time) and it takes the competition out.
Not shown is the 256 GB variant with L85A flash, since it's hard to show more than six drives on the chart. If you're keeping score, though, it lands right up against the 128 GB drive with L85C NAND.
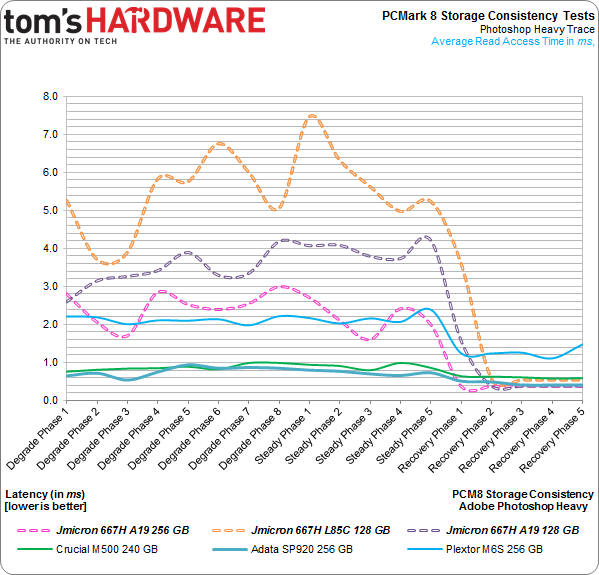
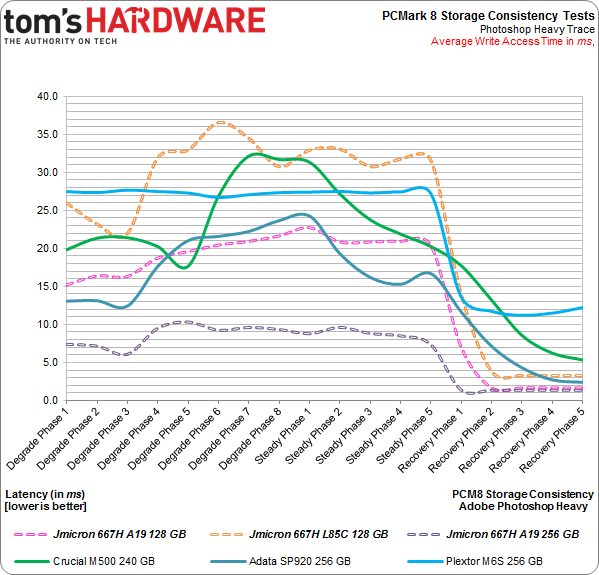
Latency
In this test, we're taking that same Adobe Photoshop (Heavy) trace and using average read and write latency to illustrate responsiveness. We'll sprinkle in competing drives for comparison, too.
Through the first 13 rounds, the script gets flipped. Aside from the excellent 256 GB drive with A19 flash, the two 128 GB SSDs experience significant read latency. Then, as the recovery rounds hit, they head straight to the floor.
As before, the observed write latency is superb once JMicron's JMF667H has a chance to catch its breath. During the punishing first 13 stages, the two A19-equipped models manage to maintain their composure.
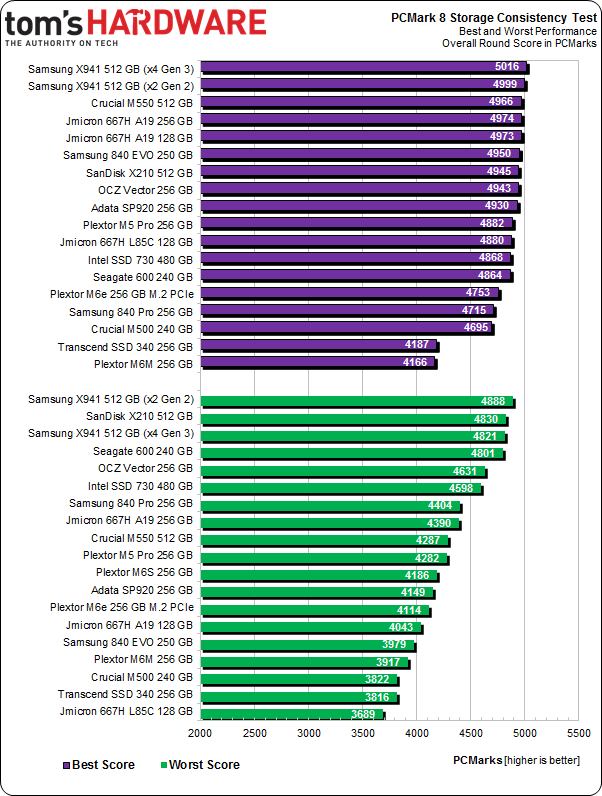
Best and Worst Score Reference
Current page: Results: PCMark 8 Storage Consistency Testing
Prev Page Results: Tom's Hardware Storage Bench v1.0, Continued Next Page Results: TRIM Testing With DriveMaster 2012-
Snipergod87 Page 6: "For every 1 GB the host asked to be written, Mushkin's drive is forced to write 1.05 GB."Reply
Mushkin drive?, To much copy paste. -
koolkei guys. please take a look at thisReply
http://www.tweaktown.com/reviews/6052/kingfast-c-drive-f8-series-240gb-ssd-review-cheapest-tested-240gb-drive-so-far/index.html
that's an actual SSD using this controller, and the price is........ a little more than surprising... -
pjmelect I remember their USB to IDE SATA chip. It caused data corruption every 4 GB or so when transferring data via the IDE interface. I have always been wary of their products since then.Reply -
tripleX "But we're not going to use theoretical corner cases (the sequential and random 4 KB benchmarks we just ran) to crown one configuration a winner and another a loser."Reply
A corner case is not sequential and random benchmarks. It is an engineering term that means, according to Wiki:
A corner case (or pathological case) is a problem or situation that occurs only outside of normal operating parameters—specifically one that manifests itself when multiple environmental variables or conditions are simultaneously at extreme levels, even though each parameter is within the specified range for that parameter.
-
g00ey JMicron has always made pretty shitty products so I won´'t buy any of these anytime soon...Reply -
2Be_or_Not2Be I, too, find it hard to want to purchase a drive from a manufacturer with such a lackluster history.Reply
One part of this article that also doesn't make sense: "Why four channels and not eight? Efficiency is one key motivator. Fewer channels facilitate a smaller ASIC, which can, in turn, be more power-friendly." Compare the size of the PCB to one like the Samsung 850 Pro. They aren't saving much in real estate (they are actually bigger than the Samsung boards), so it makes it hard to believe they're saving much in power here.


