NEC EA294WMi 29" Monitor Review: 21:9 At Twice The Price
Last month, we reviewed AOC’s Q2963PM ultra-wide monitor at 2560x1080. Based on the same LG panel, NEC brings us its EA294WMi. Selling for almost twice as much, does this screen offer two times the performance and features? Our tests give you the answer.
Measurement And Calibration Methodology: How We Test
To measure and calibrate monitors, we use an i1Pro spectrophotometer and version 5.1.2 of SpectraCal’s CalMAN software.
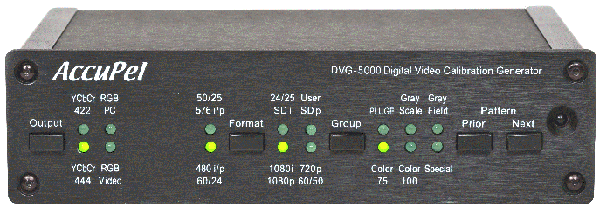
For patterns, we employ an AccuPel DVG-5000 video signal generator. This approach removes video cards and drivers from the signal chain, allowing the display to receive true reference patterns. Connections are made via HDMI.
The AccuPel DVG-5000 is capable of generating all types of video signals at any resolution and refresh rate up to 1920x1080 at 60 Hz. It can also display motion patterns to evaluate a monitor's video processing capabilities, with 3D patterns available in every format. This allows us to measure color and grayscale performance, crosstalk, and ghosting in 3D content via the 3D glasses.
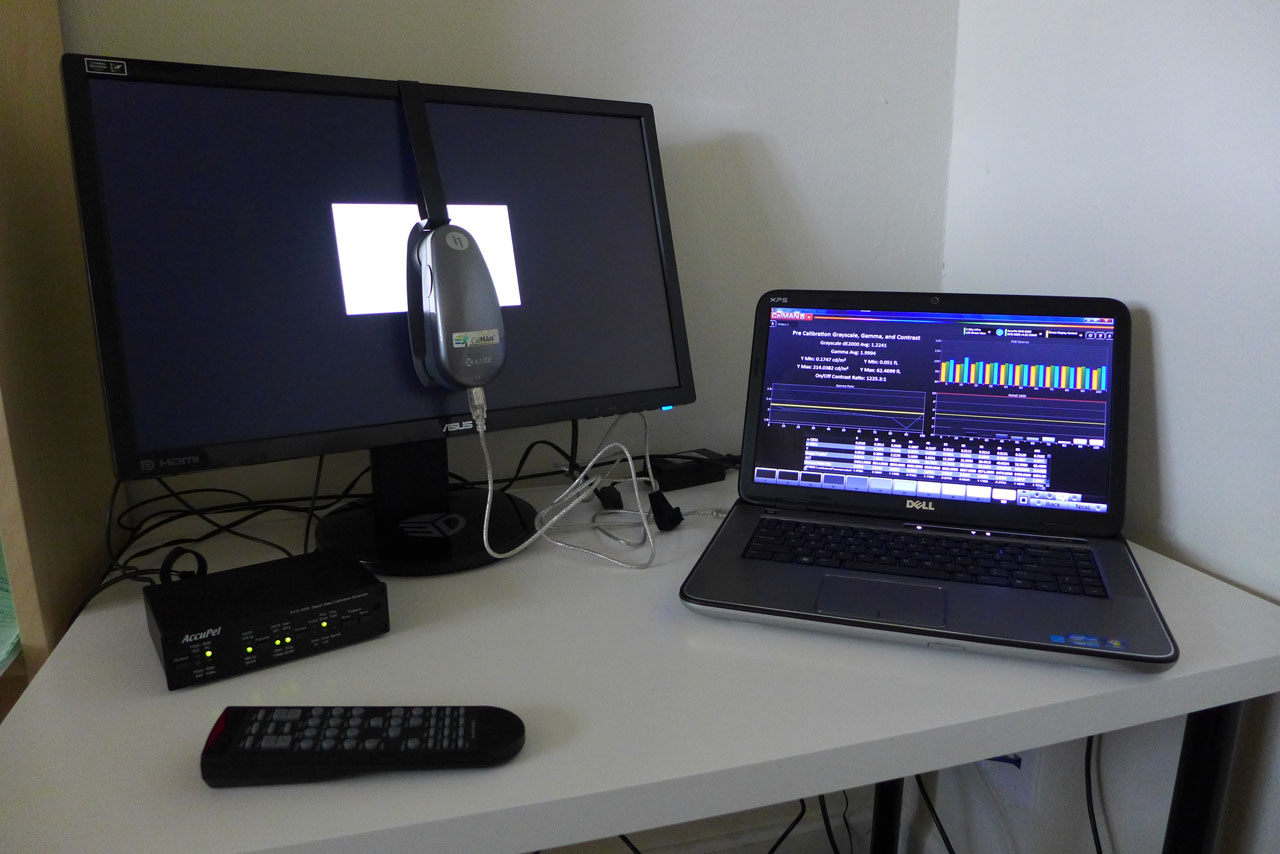
The i1Pro is placed at the center of the screen (unless we’re measuring uniformity) and sealed against it to block out any ambient light. The Accupel pattern generator (bottom left) is controlled via USB by CalMAN, which is running on the Dell XPS laptop on the right.
Our version of CalMAN Ultimate allows me to design all of the screens and workflows to best suit the purpose at hand. To that end, we’ve created a display review workflow from scratch. This way, we can be sure and collect all the necessary data with a concise and efficient set of measurements.
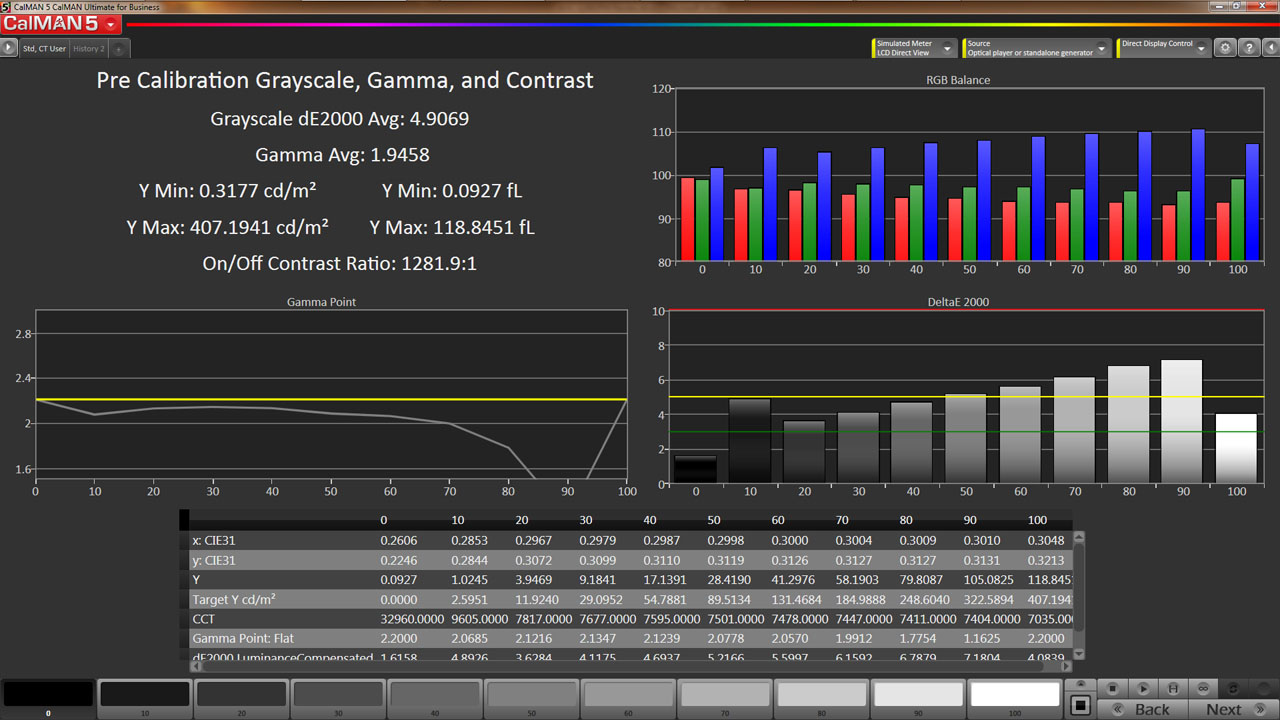
The charts show us the RGB levels, gamma response, and Delta E error for every brightness point from zero to 100 percent. The table shows us the raw data for each measurement. And the area in the upper-left tells us luminance, average gamma, Delta E, and contrast ratio. The individual charts can be copied to the Windows clipboard to easily create graphics for our reviews.
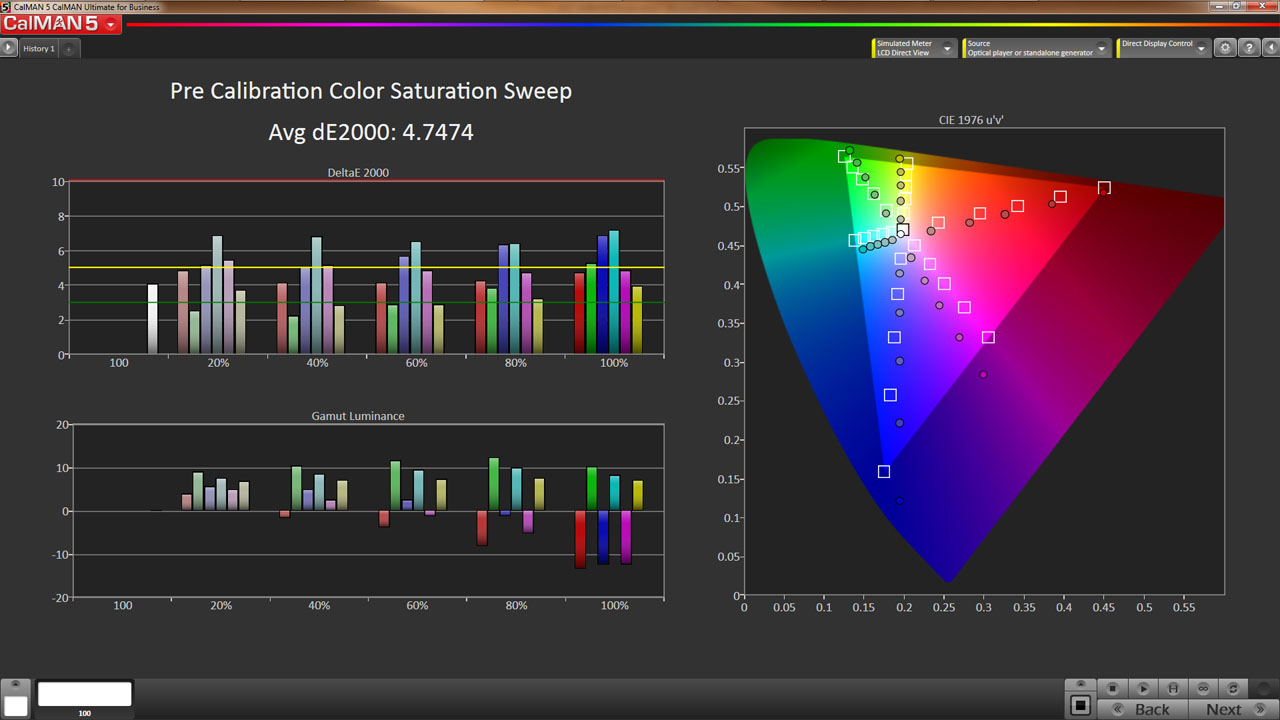
Every primary and secondary color is measured at 20, 40, 60, 80, and 100 percent saturation. The color saturation level is simply the distance from the white point on the CIE chart. You can see the targets moving out from white in a straight line. The further a point is from center, the greater the saturation until you hit 100 percent at the edge of the gamut triangle. This shows us the display’s response at a cross-section of color points. Many monitors score well when only the 100 percent saturations are measured. Hitting the targets at the lower saturations is more difficult, and factors into our average Delta E value (which explains why our Delta E values are sometimes higher than those reported by other publications).
Get Tom's Hardware's best news and in-depth reviews, straight to your inbox.
Current page: Measurement And Calibration Methodology: How We Test
Prev Page OSD Setup And Calibrating NEC's EA294WMi Next Page Results: Brightness And Contrast
Christian Eberle is a Contributing Editor for Tom's Hardware US. He's a veteran reviewer of A/V equipment, specializing in monitors. Christian began his obsession with tech when he built his first PC in 1991, a 286 running DOS 3.0 at a blazing 12MHz. In 2006, he undertook training from the Imaging Science Foundation in video calibration and testing and thus started a passion for precise imaging that persists to this day. He is also a professional musician with a degree from the New England Conservatory as a classical bassoonist which he used to good effect as a performer with the West Point Army Band from 1987 to 2013. He enjoys watching movies and listening to high-end audio in his custom-built home theater and can be seen riding trails near his home on a race-ready ICE VTX recumbent trike. Christian enjoys the endless summer in Florida where he lives with his wife and Chihuahua and plays with orchestras around the state.
-
runswindows95 Considering this screen is $805 for this monitor on Newegg, I rather get a nice 2560X1440, like the Dell U2713, for the money, or dual 1920X1200 screens. 2560X1080 really isn't an ideal resolution for any practical application.Reply -
TBC1 Reply11821147 said:Triple Post! Triple Post! Triple Post! But yeah too much money
Darn thing lagged on me!
-
Vorador2 Well this is a professional monitor so the high price is not that surprising. Still if i were on the hunt for a monitor this wouldn't be my choice.Reply -
burkhartmj You could get 2 Dell Ultrasharp U2412M's plus a dual monitor mount for the price of this, it just doesn't make sense at this price point.Reply
There's also the issue of ultra wide screen. This seems to have a niche market that doesn't exist, a professional grade monitor that's only particularly good at watching movies. People who just watch TV and movies all day aren't going to be willing to spend more than 250 on a monitor , and those who want/need professional features will want as much screen real estate as possible, opting for large 16:9 or 16:10 monitors.
This is exacerbated by the fact that this aspect ratio is literally ONLY helpful for movies, not even TV. having big black bars on each side during a TV show or older movie that doesn't have the cinematic aspect ratio is way more distracting than the thin bars at the top and bottom created by cinematic movies on normal 16:9/10 monitors. -
jasonpwns I dislike this new trend. I'd rather have a 27 inch with 2560x1440. Why are we constantly trying to lower our screen resolutions. This 1080p trend needs to stop.Reply -
InvalidError Reply
I would prefer 2560x1600 on a 24" screen myself.11822582 said:This 1080p trend needs to stop.
The problem is the bulk of offer and demand gravitates around 1920x1080 since that is what most common forms of entertainment are optimized for. With 1080p screens starting as low as $90, anything higher than that for 3-5X the price becomes a tough sale so these higher-resolution monitors get pitched and priced as "professional" displays instead of trying to compete for people's desktops.
I paid $270 for my 24" 1200p display four years ago. Equivalent models today are usually listed around $400. To me, this seems to indicate that mainstream interest in higher resolution desktop displays has regressed, hence the switch to pitching those nearly exclusively at professionals and enthusiasts. -
mortsmi7 Seems to me that if your a fan of the 4:3 ratio, and want a seamless dual monitor experience, this might be the way to go. For once, a person might have reasonable room to put two windows side by side. And it sure as hell takes up less desk space than two separate monitors.Reply
