Intel SSD 710 Tested: MLC NAND Flash Hits The Enterprise
Take note, enterprise customers: the successor to Intel's vaunted X25-E is here, and it doesn't center on SLC flash. Instead, the company is turning toward High Endurance Technology MLC. We dig deep to find out what this means for speed and reliability.
HET MLC: What Does Endurance Really Look Like?
Intel won't tell us exactly how many P/E cycles its 25 nm HET MLC can withstand. However, we don't have to rely solely on the company's word with regards to the 710's high endurance spec, because we can backwards-calculate the number using S.M.A.R.T. values found on Intel's latest SSDs.
| Intel S.M.A.R.T.Workload Counters | Purpose |
|---|---|
| E2 | Percentage of Media Wear-out Indicator (MWI) used |
| E3 | Percentage of workload that is read operations |
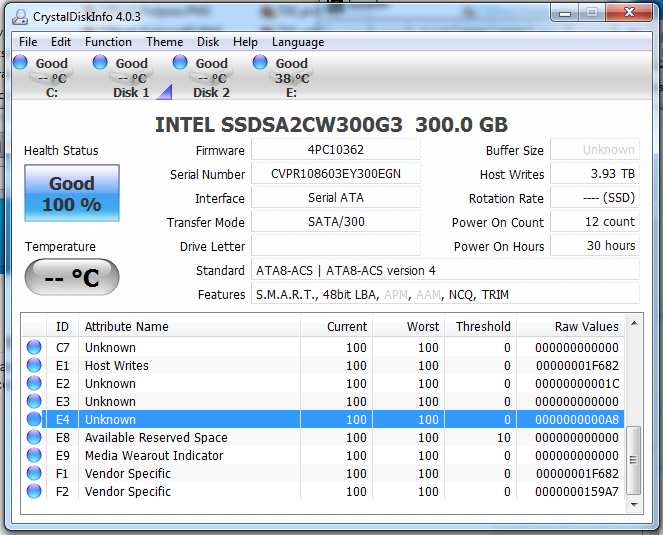
| E4 | Time counter in minutes |
The media wear-out indicator is a S.M.A.R.T. value (E9) on all SSDs that tells you how many P/E cycles are used, on a scale from 100 to 1. This is like the odometer on a car. However, using this value would require months of testing, because its on a scale from 100 to 1.
In comparison, Intel's workload counters are kind of like trip counters on a car, because they measure endurance over a fixed time period. Better yet, they provide more granular information on wear-out out, which makes it easy to measure endurance in a under a day. However, none of these workload counters are generated until the drive has been used 60 minutes or more. In practice, one hour isn't long enough for us to take a precise measurement, which is why we our endurance values are based on a 6 hour workload.
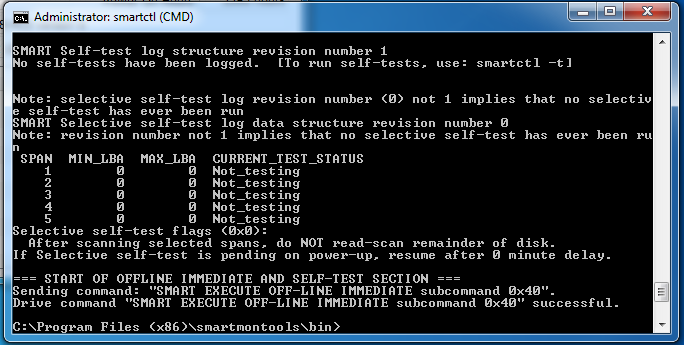
The counter starts the minute you plug in the drive, so you'll need to reset it if you want to attempt this test on your own. This is possible by sending a 0x40 instruction via smartctl.
If you're using a disk information program like CrystalDiskInfo, all S.M.A.R.T. values are in hexadecimal, which means you'll need to convert to decimal before proceeding. The E2 field is particularly unique because it's only valid out to three decimal places, and it's stored in an IEC binary format. So, after converting the E2's raw value to decimal, you have to divide by 1024 to get percentage.
Before we get to the results of our tests, we need to cover a little bit of math. If we toss out the JEDEC formula for a second, what do we know about write endurance? Rules that apply to all SSDs:
- Host Writes ÷ NAND Writes = P/E Cycles Consumed ÷ Total P/E Cycles
- P/E Cycles Used ÷ P/E Cycles Total = Media Wear Indicator (scale of 100 to 1)
- 100% sequential write means Host Writes = NAND Writes (write amplification = 1)
If we take these three formulas, it's possible to calculate the write endurance of the SSD 710 using the SSD 320 as a reference point.
Get Tom's Hardware's best news and in-depth reviews, straight to your inbox.
| 128 KB 100% Sequential Write6 Hours | Intel SSD 710200 GB | Intel SSD 320 300 GB |
|---|---|---|
| Total Data Written | 3.88 TB | 3.9 TB |
| Percent MWI used (E2) | 0.053 | 0.238 |
| Endurance In Years | 1.292 | 0.287 |
| Percent MWI per TB | 1.35 x 10⁻² | 6.10 x 10⁻² |
| P/E Cycles Per TB | 3.07 | 13.7 |
| P/E Cycles | 22 337 | 5000 |
| Recalculated Endurance Rating(P/E Cycles ÷ P/E Cycles Per TB) | 7268 Terabytes Written | 364 Terabytes Written |
Starting with a 100% sequential write (write amplification equals one), we see the SSD 710's write endurance is roughly 4x to 5x higher than the SSD 320. We'll keep things simple and average out to 4.5x.
Previously, we've heard Intel mention that the NAND in its SSD 320 is rated for 5000 cycles. So, that puts the SSD 710 somewhere between 20 000 to 25 000 P/E cycles, which is in-line with what the company's competitors say eMLC should be able to do.
Now that we know what MWI looks like with a 100% sequential write, we can check write amplification in a random write workload with a high queue depth.
| 4 KB 100% Random WriteQD= 32, 6 Hours | Intel SSD 710200 GB | Intel SSD 320 300 GB |
|---|---|---|
| Total Data Written | 0.23 TB | 0.11 TB |
| Percent MWI used (E2) | 0.016 | 0.084 |
| Endurance In Years | 4.28 | 0.83 |
| Percent MWI per TB | 1.35 x 10^-2 | 6.10 x 10^-2 |
| P/E Cycles Per TB | 15.65 | 37.73 |
| Recalculated Endurance Rating(P/E Cycles ÷ P/E Cycles Per TB) | 1437 Terabytes Written | 132 Terabytes Written |
| Write Amplification | 5.09 | 2.75 |
Interestingly, write amplification is higher on the SSD 710. However, in the same period, the 710 can write twice as much data as Intel's 320. That'd purportedly be counter to the reason for more over-provisioning, but it'll all fall into place shortly.
Perhaps more important, both drives have endurance values better than what Intel cites, which just goes to show that the JEDEC spec tends to underestimate real-world endurance. With the same random workload, all of the SSD 320's P/E cycles would be consumed in less than a year, whereas the SSD 710 could continue working for another three years or more.
Current page: HET MLC: What Does Endurance Really Look Like?
Prev Page HET MLC: Supercharged MLC Or SLC Lite? Next Page Test Setup And Firmware Notes-
whysobluepandabear TLDR; Although expensive, the drives offer greater amounts of data transfer, reliability and expected life - however, they cost a f'ing arm and a leg (even for a corporation).Reply
Expect these to be the standard when they've dropped to 1/3rd their current price. -
RazorBurn To some companies or institutions.. The data this devices hold far outweighs the prices of this storage devices..Reply -
nekromobo I think the writer missed the whole point on this article.Reply
What happens when you RAID5 or RAID1 the SSD's??
I don't think any enterprise would trust a single SSD without RAID. -
halcyon __-_-_-__with the reliability those have they will never ever find their way into any serverMy Vertex 3 has been very reliable and I'm quite satisfied with the performance. However, I've heard reports that some, just like with anything else, haven't been so lucky.Reply -
toms my babys daddy I thought ssd drives were unreliable because they can die at any moment and lose your data, and now I see that they're used for servers as well? are they doing daily backups of their data or have I been lied to? ;(Reply -
halcyon toms my babys daddyI thought ssd drives were unreliable because they can die at any moment and lose your data, and now I see that they're used for servers as well? are they doing daily backups of their data or have I been lied to? ;(SSDs are generally accepted to be more reliable than HDDs...at least that's what I've been lead to believe.Reply -
Onus halcyonSSDs are generally accepted to be more reliable than HDDs...at least that's what I've been lead to believe.Yes, but when they die, that's it; you're done. You can at least send a mechanical HDD to Ontrack (or a competing data recovery service) with a GOOD chance of getting most or all of your data back; when a SSD bricks, what can be done?Reply
-
CaedenV nekromoboI think the writer missed the whole point on this article.What happens when you RAID5 or RAID1 the SSD's??I don't think any enterprise would trust a single SSD without RAID.The assumption is that ALL servers will have raid. The point of this article is how often will you have to replace the drives in your raid? All of that down time, and manpower has a price. If the old Intel SSDs were about as reliable as a traditional HDD, then that means that these new ones will last ~30x what a traidional drive does, while providing that glorious 0ms seek time, and high IO output.Reply
Less replacement, less down time, less $/GB, and a similar performance is a big win in my book.
toms my babys daddyI thought ssd drives were unreliable because they can die at any moment and lose your data, and now I see that they're used for servers as well? are they doing daily backups of their data or have I been lied to? ;(SSDs (at least on the enterprise level) are roughly equivalent to their mechanical brothers in failure rate. True, when the drive is done then the data is gone, but real data centers all use RAID, and backups for redundancy. Some go so far as to have all data being mirrored at 2 locations in real time, which is an extreme measure, but worth it when your data is so important.
Besides, when a data center has to do a physical recovery of a HDD then they have already failed. The down time it takes to physically recover is unacceptable in many data centers. Though at least it is still an option.


