Part 1: Building A Balanced Gaming PC
Benchmark Results: S.T.A.L.K.E.R.: Clear Sky
S.T.A.L.K.E.R.: Clear Sky
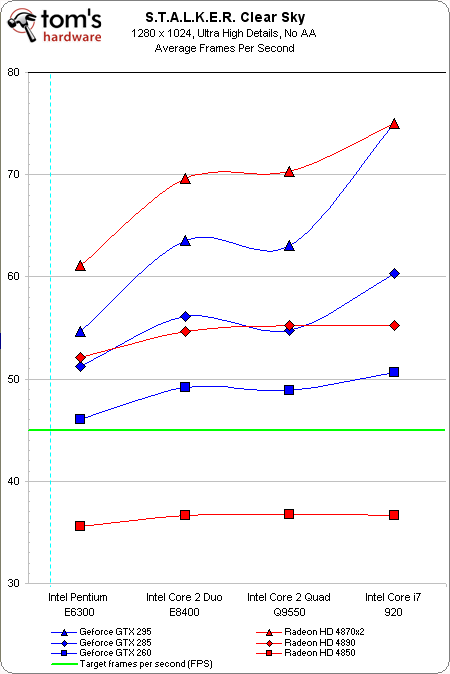
S.T.A.L.K.E.R.: Clear Sky represents the second game that is so graphically intensive, we are unable to maximize the quality details and enable AA at the same time. The game is not known for being well-threaded, so both of our dual-core CPUs are capable of delivering playable performance. In essence, what’s going to determine playability in S.T.A.L.K.E.R. is having enough GPU muscle for the resolution at which you hope to game at.
We typically use an average of the four scores given by the stand-alone benchmark to measure S.T.A.L.K.E.R. performance. But for this story, we spent some time playing the game on various hardware, and then came close to utilizing a FRAPS benchmark run instead. Unlike Crysis, you do not really need to get far into S.T.A.L.K.E.R. before the game shows your hardware just what it’s going to be up against. All that it takes is exiting a building for the first time while the morning sun rays shine into camp.
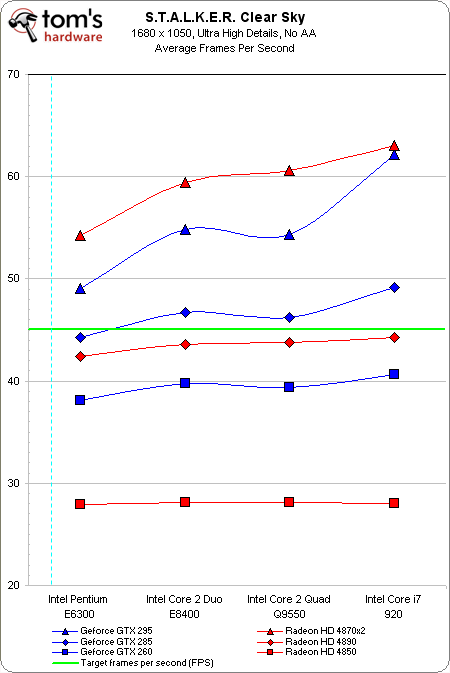
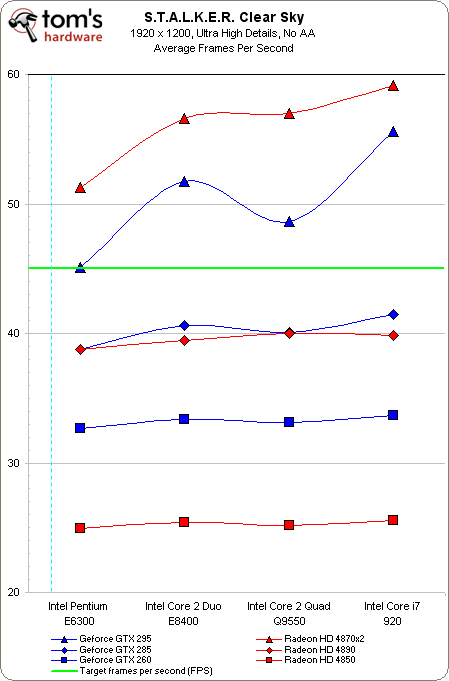
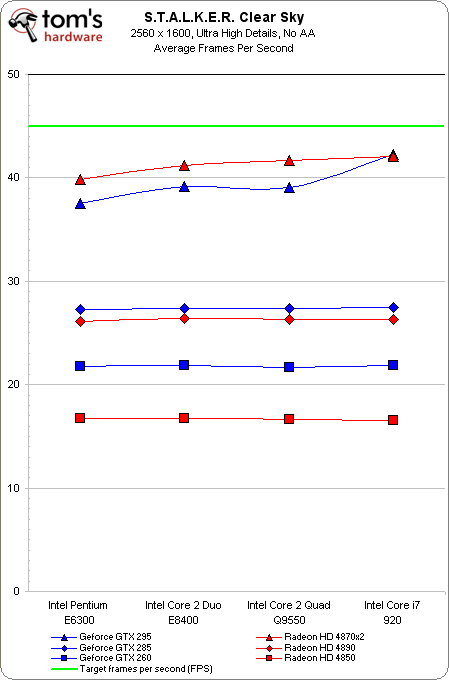
In the end, we still found the benchmark tool useful for this series, but we needed to set the minimum target at 45 FPS on average. In every scenario benchmarked, if the overall average was 45 FPS, the “Sun Shafts” test averaged about 30 FPS. Playing the game at these settings still results in areas where the frame rates drop to the mid 20s, but overall still seemed to represent what we could consider playable performance. For gamers with higher playability demands, we will also try to mention platforms capable of maintaining even higher/smoother frame rates in the Sun Shafts test.
The dual-GPU cards lead the way, pulling 50+ FPS in the Sun Shafts test. But as long as we step above the Radeon HD 4850 on the graphics side, all of the platforms are capable of handling Ultra details at 1280x1024. Despite trading blows with the Radeon HD 4890, the GeForce GTX 285 provided 36.5-37 FPS in the Sun Shafts test; in each case, approximately 3 FPS higher than the Radeon HD 4980.
At 1680x1050, the GeForce GTX 260 and Radeon HD 4890 both fall below the target line, leaving only the GeForce GTX 285 left standing with the two dual-GPU cards. CPU muscle has little effect on the Sun Shafts frame rates, and the GeForce GTX 285 reaches 30 FPS with each CPU, although it takes a pairing with the E8400 to reach our average target. While the Radeon HD 4870 X2 leads in overall score, it manages 42-43 FPS in the most demanding test, while the GeForce GTX 295 comes out on top with 45-47 FPS.
Only the big boys remain playable at 1920x1200. Scoring roughly 37 FPS, Nvidia's GeForce GTX 295 leads by a couple of frames per second in the demanding Sun Shafts test, while the Radeon HD 4870 X2 again takes the other three tests, resulting in the highest overall average score.
Get Tom's Hardware's best news and in-depth reviews, straight to your inbox.
While not as bad as the beating taken in Crysis, none of the cards handles S.T.A.L.K.E.R. at this resolution. The Radeon HD 4870 X2 is reduced to 24 FPS in the Sun Shafts test, while the GeForce GTX 295 manages 26 FPS.
Current page: Benchmark Results: S.T.A.L.K.E.R.: Clear Sky
Prev Page Benchmark Results: Far Cry 2 Next Page Benchmark Results: Grand Theft Auto IV-
yoy0yo Wow, this is an amazingly in depth review! I kinda feel that its sponsered by Asus or Corsair, but I guess you kept with the same brand for the sake of controls etc.Reply
Thankyou! -
inmytaxi Very helpful stuff.Reply
I'd like to see some discussion on the availability of sub $400 (at times as low as $280) 28" monitors. At this price range, does it make more sense to spend more on the LCD even if less is spent initially on graphics? I would think the benefit of 28" vs. 22" is so great that the extra money could be taken from, say, a 9550 + 4890 combo and getting a 8400/6300 + 4850 instead, with the right motherboard a second 4850 later will pass a 4890 anyway. -
frozenlead I like the balance charts. It's a good way to characterize the data. This article is well constructed and well thought-out.Reply
That being said - is there a way we can compile this data and compute an "optimized" system for the given hardware available? Finding the true, calculated sweet spot for performance/$ would be so nice to have on hand every quarter or twice a year. I'll have to think about this one for a while. There may be some concessions to make, and it might not even work out. But it would be so cool. -
Neggers I feel like the person that did this review got it finished alittle bit late. I can only assume he did all the testing some months back and has only just finished writing up his results. But its sad to not see the new P55/i5 Systems, AMD Athlon II Quad Cores, or the Radeon 5000 series.Reply
Good review, but hopefully it can be updated soon with some of the newer equipment thats out, to turn it into a fantastic guide for people. -
brockh Great job, this is the information people need to be seeing; the way people provide benchmarks these days hardly tells the story to most of the readers. It's definitely important to point out the disparities in ones CPU choice, rather than just assuming everyone uses the i7 all the sites choose. ;)Reply
Looking forward to part 2. -
Onyx2291 This will take up some of my time. Even though I know how, it's nice to get a refresher every now and then.Reply -
mohsh86 you are really kidding me by not considering the ATI 5000 series, although am a fan of nvidia , but this is not fair !Reply


