Why you can trust Tom's Hardware
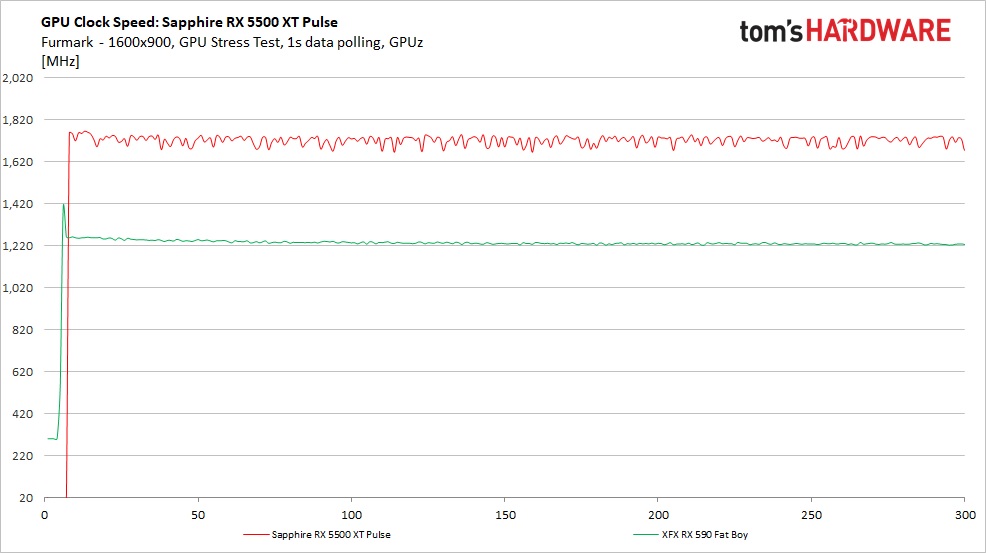
Clock speeds in Furmark varied, but not nearly as much as some previous cards. In this case, with the Sapphire RX 5500 XT Pulse, Furmark clocks averaged around 1,721 MHz, around 70 MHz less than the gaming clocks. This value still managed to be above the Gaming Rate, likely due to the power limit being set around 135W, where with others the limit isn’t substantially higher.
We used CPUz logging to measure the card’s power consumption with the Metro: Exodus benchmark running at 2560 x 1440 using the default Ultra settings. The tested cards are warmed up prior to benchmarking and started after settling to an idle temperature (after about 10 minutes). The benchmark is looped a total of five times, which yields around 10 minutes of testing. In the charts you will see a few blips in power use, which is a result of the benchmark starting the next loop.
We also use Furmark to capture worst-case power readings. Although both Nvidia and AMD consider the application to be a “power virus,” or program that deliberately taxes the components beyond normal limits, the data we can gather from it offers useful information about a card’s capabilities outside of typical gaming loads.
Power Draw
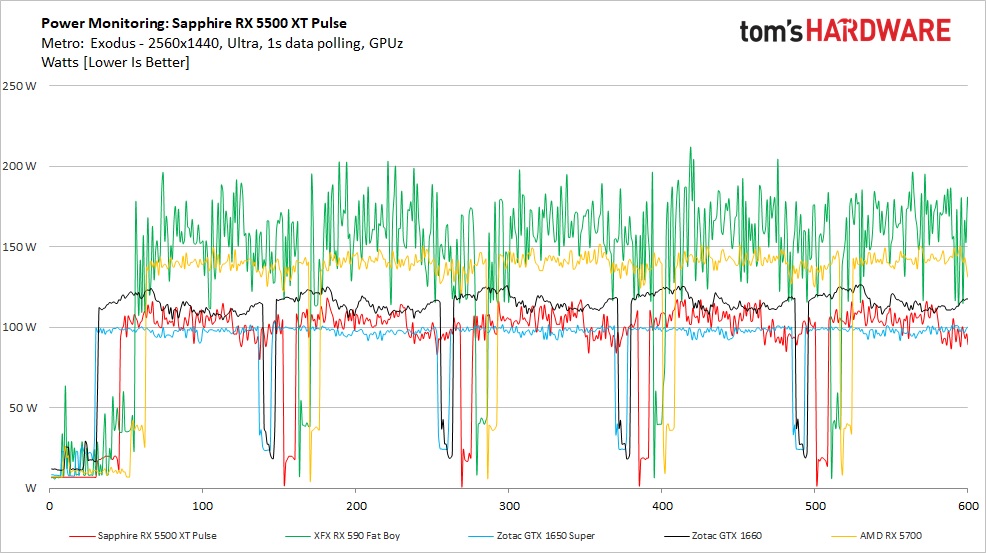
Power draw when gaming on the 4G Sapphire RX 5500 XT Pulse peaked at 115W and averaged around 102W throughout testing. This compares well to the GTX 1650 Super, which averaged just a bit less, around 98W. AMD’s next card up in the stack, the Radeon RX 5700 was up around 140W average. The outgoing XFX RX 590 Fat Boy averaged 140W.
We can see the 7nm process and architectural changes with RDNA have paid off when compared to Polaris-based offerings and even the Nvidia cards (though they use a larger 12nm finFET process). Put simply, power differences between comparable cards will not be an issue in heat or on your power bill. AMD has done a lot better on this front.
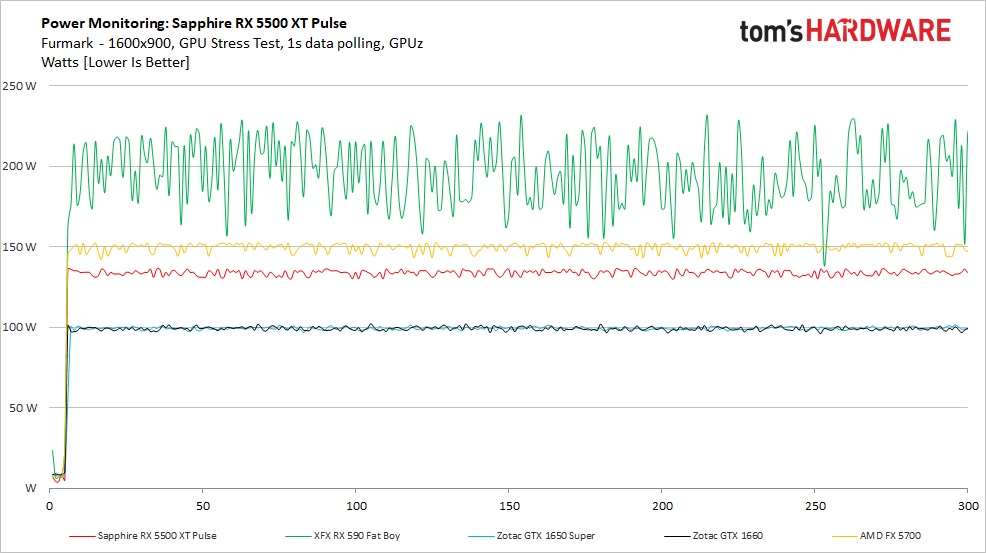
In Furmark, we saw power shoot up to an average of 133W, 33%-plus more than the gaming draw. 135W seems to be where the power limit is set on this card when running default settings. The XFX RX 590 Fat boy averages 149W. Nothing out of the ordinary here.
Temperatures, Fan Speeds and Clock Rates
In order to see how each video card behaves, like the power testing, we use GPUz logging in one-second intervals to capture data. Game testing is done looping the Metro: Exodus benchmark five times at Ultra settings running at 2560x1440 resolution.
Get Tom's Hardware's best news and in-depth reviews, straight to your inbox.
We also used Furmark to capture some of the data below, which offers a more consistent load and uses slightly more power, regardless of the fact that the clock speeds and voltages are limited. These data sets give insight into worst-case situations, along with a load other than gaming.
Gaming
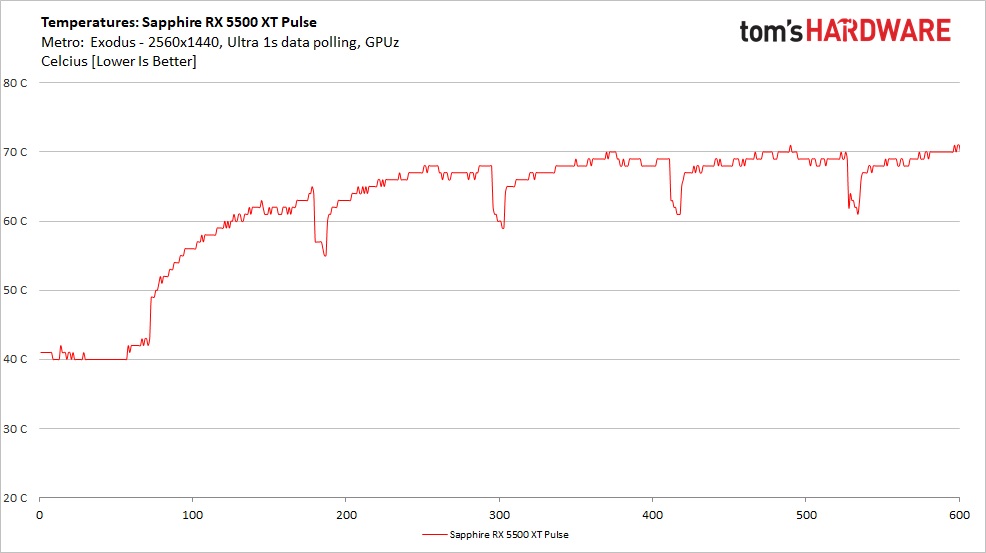
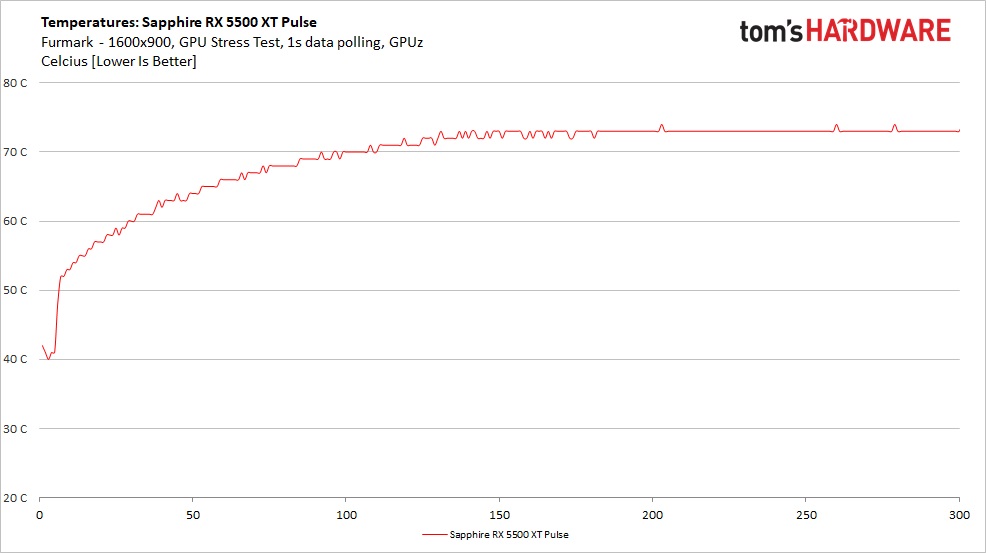
The Sapphire RX 5500 XT Pulse and its Dual-X cooling solution managed to keep the card at 71C or less during Metro: Exodus testing. At the time of this writing, we do not have a direct comparison, but we know the cooler does an adequate job of keeping temps under control and did so without a lot of noise. Time will tell if other models will be more effective.
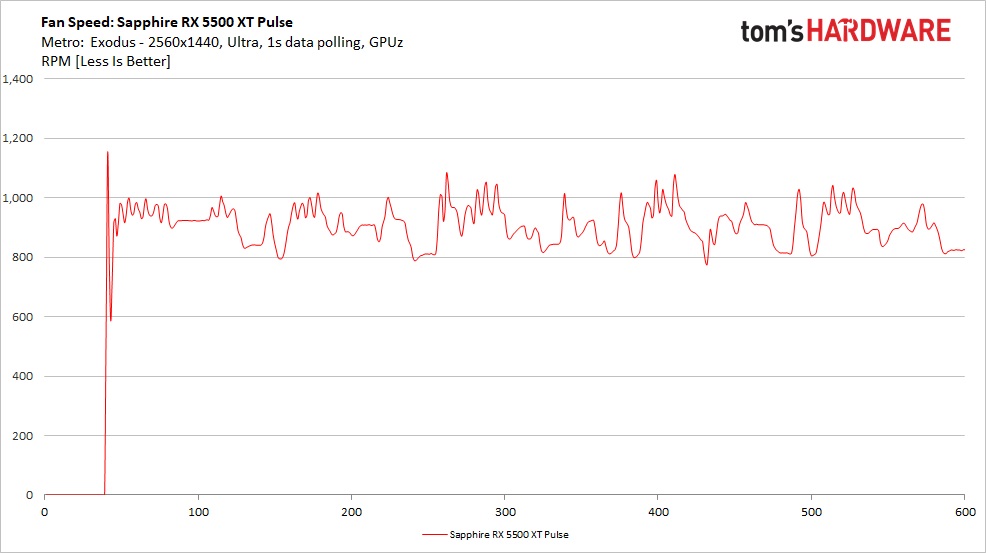
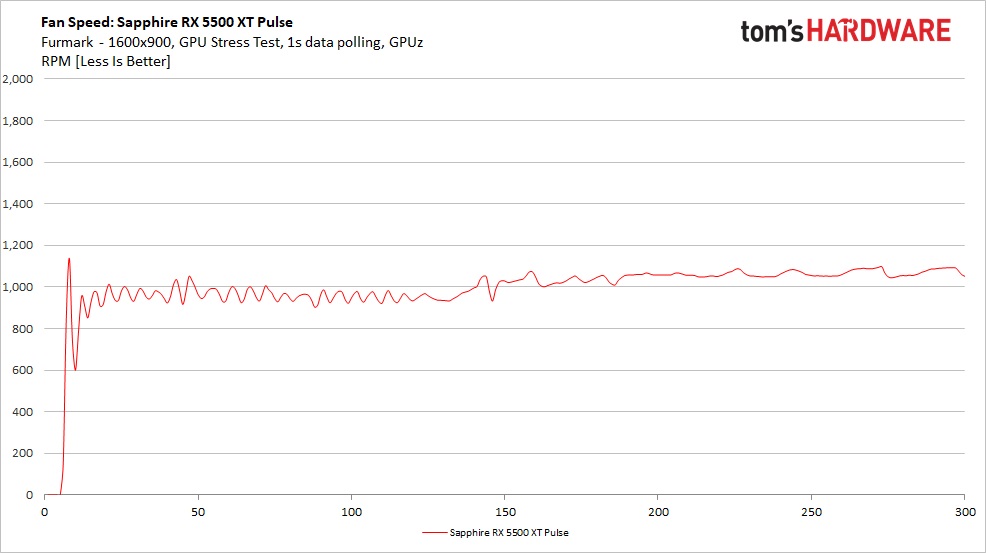
The Dual-X’s 90mm fans are off when idle but ramp up to 1,000 RPM quickly once temperatures reach 50C. Fan speeds varied wildly on this cooler, ranging from around 800 to 1,000 RPM. While we could not hear the fan changing speeds during testing, we normally do not see such consistent variations in tests. The fans are audible on load, but overall quiet and mixed in well with the three Corsair fans on the H115i, along with another chassis fan for air movement across the test bench.
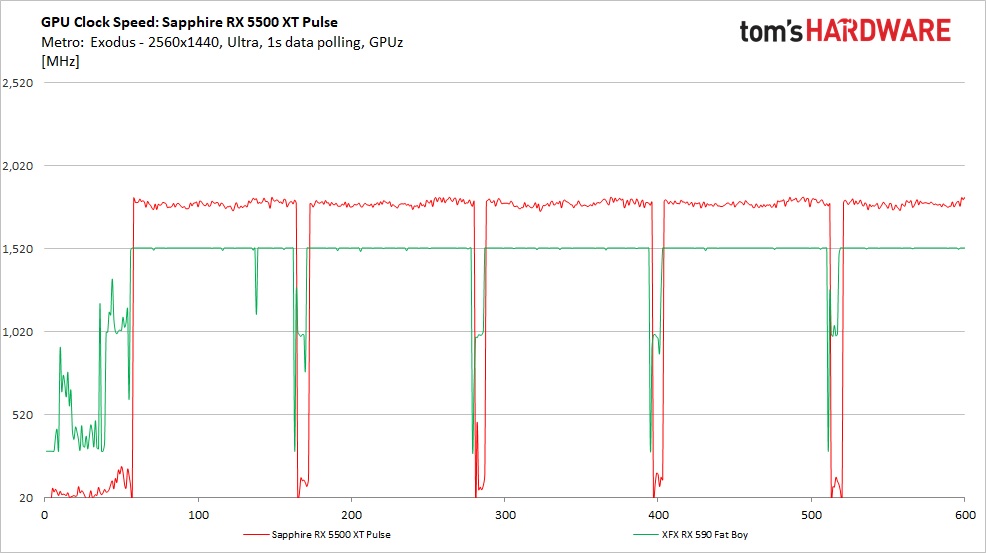
Clock speeds on this card during gaming averaged 1,794 MHz, peaking at 1,829 MHz. Per usual, we do not see the advertised AMD Boost clocks, but on this particular card, it is a lot closer than we have seen with the 5700 XTs reviewed previously, where they were closer to the game rate.
Furmark
Fan speeds when running Furmark were more stable throughout this testing. The loads Furmark puts on the card are more consistent and, in almost all cases, hit the built-in power limit. Fan speeds ranged from around 900 RPM to 1,100 RPM. Roughly midway through the test, the heatsink is close to being saturated and the fan speeds stabilize, keeping the card around the same temperature.
Temperatures in Furmark were a bit higher than gaming, reaching a peak of 74C. From the power testing earlier, we saw Furmark use over 30W more, so this result makes sense. It looks like there is headroom for overclocking, at least in regards to power limit.
MORE: Best Graphics Cards
MORE: Desktop GPU Performance Hierarchy Table
MORE: All Graphics Content
Current page: Power Consumption, Fan Speeds, Clock Rates and Temperature
Prev Page Performance Results: 1920 x 1080 (Medium) Next Page Software: Sapphire Trixx
Joe Shields is a staff writer at Tom’s Hardware. He reviews motherboards and PC components.
-
tennis2 Can we please get an "average of all benchmarks" graph in the summary page of GPU reviews? It's difficult to glean a winner when cards flip-flop depending on the game tested.Reply -
King_V Interesting - and definitely confusing when trying to judge overall performance, given how it, does better at some games and worse at others compared to Nvidia's cards.Reply
Also, this gave me a bit of a reminder that I've kind of been underestimating the RX 590, though its power draw is just too much for what it does.
Also, on page 4:
The outgoing XFX RX 590 Fat Boy averaged 140W.
and
The XFX RX 590 Fat boy averages 149W. Nothing out of the ordinary here.
The first one is a little hard to tell, given how the 590's plot on the graph swings so wildlyabout, but that number on the second one seems wrong, considering that only once does a plot point for it ever dip below 150W. Eyeballing it, I want to say it's about 190-ish watts?
Overall, though, I'm glad it's at the least trading blows with the 1650 Super, and pleasantly surprised to see it occasionally flirting with 1660 territory. Still, odd in the places where it does fall short, as the 4GB doesn't seem to hurt the 1650 Super the same way.
I'm definitely looking forward to the test results when the 8GB variant is added to the graphs, and thus far, this seems to bode well for the upcoming RX 5600 XT.
And yes, power efficiency has improved significantly, though Nvidia hasn't stood still on this, so, AMD still has a bit of work to do.
Maybe Mini-Me might use his Christmas money from Grandma and Grandpa to go for an RX 5600 XT, when they come out in January, to add to his ChromaTron build, currently in progress. -
mitch074 I would like the review more if I could get a more direct comparison with my reference RX480 8GB - I bought it almost when it came out and it serves me well, but I don't see myself upgrading for less than a 50% performance increase.Reply -
tennis2 Reply
RX480/RX580 (exact same GPU) is about 15% slower than an RX590 (used in this review). Depending on how much you paid for your RX480 and how much of a sale you can find on a GTX1660Ti, that's the 50% improvement for the same $$ step you're asking about. Unfortunately AMD has a gaping hole between the 5500XT and the 5700. Ain't nobody buying Vega 56's.mitch074 said:I would like the review more if I could get a more direct comparison with my reference RX480 8GB - I bought it almost when it came out and it serves me well, but I don't see myself upgrading for less than a 50% performance increase. -
InvalidError Reply
The 5600 is coming, should drop somewhere in-between.tennis2 said:Unfortunately AMD has a gaping hole between the 5500XT and the 5700. -
cryoburner The 5500XT seems decidedly underwhelming from a pricing standpoint, considering it generally doesn't perform much faster than an RX 580, and that level of performance has been available in the $170-$200 range for quite a while already. Even the RX 480 had nearly this level of performance, and the 4GB variant of that card launched for $199 back in June of 2016. A full 3 1/2 years later, we're only getting somewhere around 10-15% more performance at a slightly lower price, at least for the 4GB version, and at this point you'll probably want the higher VRAM version to keep up with future games.Reply
And compared to Nvidia's current offerings, this brings nothing new to the table. The 4GB 5500XT appears to offer similar performance to a 1650 SUPER at a slightly higher MSRP. And the 8GB version might cope a little better with games that have high VRAM requirements, but at a 25% higher MSRP than the 1650 SUPER. Around that price level, you can snag a faster 1660 for just a little more.
The only notable advantage over AMD's existing sub-$200 lineup would be the reduced power consumption, and in turn heat output, with the new cards being much closer to Nvidia's offerings. Again, that only brings them nearly on-par with what the competition is already offering though, and not providing any real advantage over products already on the market. These cards should have been priced at least $20 lower at launch to differentiate them from existing models. I suspect they didn't do that to give RX 500 series cards a chance to clear out first though, since it sounds like there's still a lot of inventory around. It's also possible that limited 7nm production might have played a role, with them not wanting to make the lower-margin products any more attractive than necessary. Perhaps prices will level down in the coming months though. -
tennis2 I'll say that AMDs superior software features are a scale-tipper for me. Wattman and Chill are fantastic and I'd really miss those features if I went Nvidia. Haven't tried the new Performance Boost scaling yet.Reply
On pricing, yes the 5500XT is a bit expensive comparatively. More than likely, prices will quickly correct. Not to forget that AMD is probably having to pass along a "7nm tax" in its products since 7nm is bleeding edge right now and not many fabs even have the capability. -
King_V I would be a little surprised if, for no other reason, the holidays drive the prices down some - the 5500 XT, which in turn would create downward pressure on the Polaris cards.Reply
I've been wrong before, though. -
InvalidError Reply
The Navi dies are about half the size of equivalent performance Polaris dies, the "7nm" tax would need to be in the nearly 100% for AMD to need to raise MSRPs to maintain gross margins.tennis2 said:Not to forget that AMD is probably having to pass along a "7nm tax" in its products since 7nm is bleeding edge right now and not many fabs even have the capability.
How many fabs "have the capability" does not really matter for bulk clients like AMD, they pay a predetermined cost per wafer for whatever volume they contracted for the duration of that contract and most of those contracts for 2020 got nailed down a long time ago. The companies who may have to pay the big bucks for wafers are smaller customers fighting over whatever capacity is left.
Pretty sure the launch pricing is just a pre-xmas cash grab and prices will come down a fair amount early next year, maybe sooner if enough people pick the 1650S over the 5500XT. -
digitalgriffin Replyadmin said:AMD’s 4GB Radeon RX 5500 XT is a capable 1080p gamer at $169. But if you need to play at Ultra, memory becomes an issue and you might want to step up to the 8GB model or Nvidia’s GTX 1660.
AMD Radeon RX 5500 XT Review: 7nm RDNA on a Budget : Read more
Current market price of $229 for 8Gigs makes it DOA.
$170 RX590's are common and there's just not enough of a difference to justy $60 price jump.
$195 Maybe. But that's pushing it.