Why you can trust Tom's Hardware
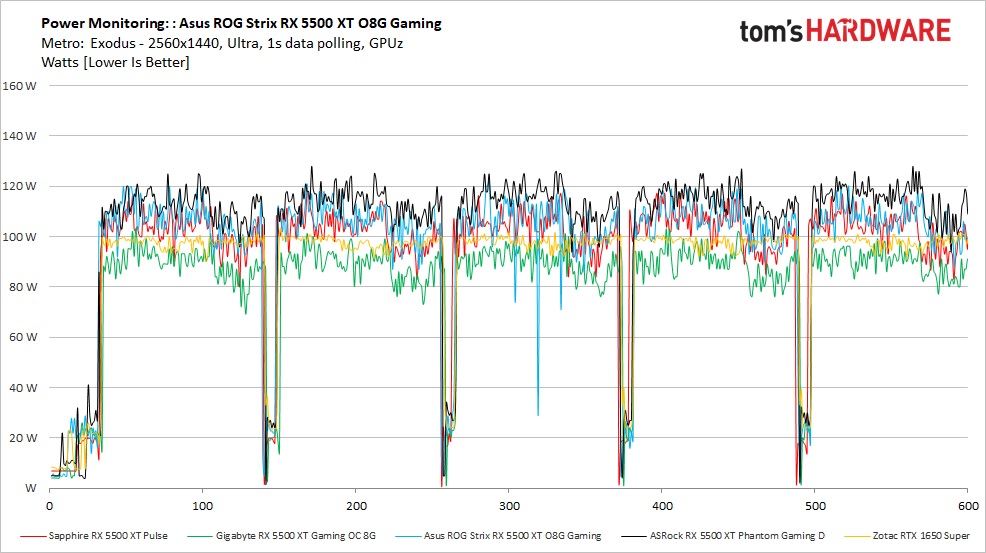
We use GPU-Z logging to measure each card's power consumption with the Metro Exodus benchmark running at 2560 x 1440 using the default Ultra settings. The card is warmed up prior to testing and logging is started after settling to an idle temperature (after about 10 minutes). The benchmark is looped a total of five times, which yields around 10 minutes of testing. In the charts, you will see a few blips in power use that are a result of the benchmark ending one loop and starting the next.
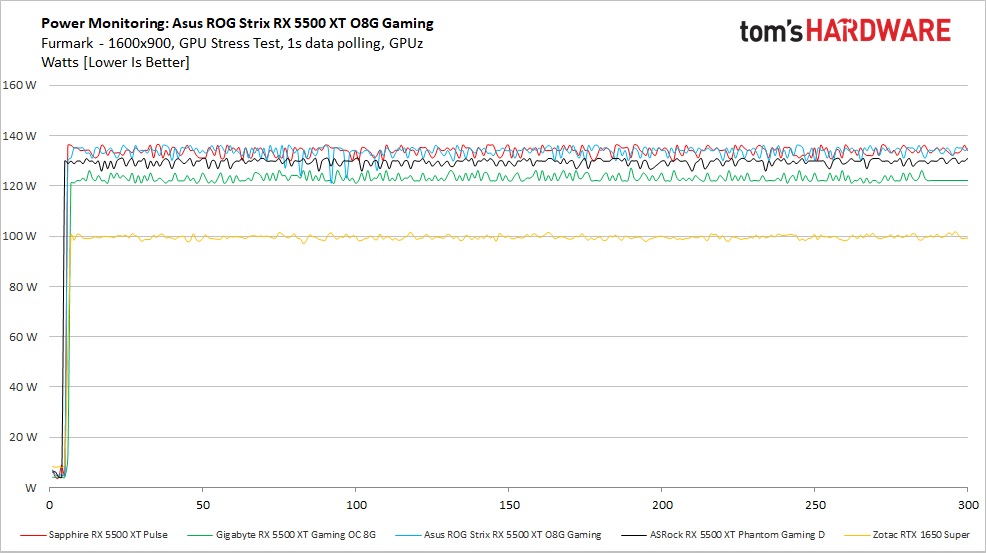
We also use FurMark to capture worst-case power readings. Although both Nvidia and AMD consider the application a "power virus," or a program that deliberately taxes the components beyond normal limits, the data we can gather from it offers useful information about a card's capabilities outside of typical gaming loads. For example, certain GPU compute workloads including cryptocurrency mining have power use that can track close to FurMark, sometimes even exceeding it.
Power Draw
In our gaming tests, the Asus ROG Strix RX 5500 XT O8G Gaming averaged 105W power draw. That's toward the higher end of the results, with the ASRock Phantom Gaming at 114W average, the Sapphire Pulse 102W, and the Gigabyte a surprisingly low 89W. Even with these differences, it will be difficult to notice on your electric bill. Also remember that GPU-Z only records chip power and not Total Board Power (TBP) for AMD GPUs, which means actual power use is probably 15-20W higher.
The slower Zotac GTX 1650 Super averaged 97W—a few watts lower than most of the RX 5500 XT’s we’ve tested. Meanwhile, the faster Zotac GTX 1660 Amp (not pictured in the chart) used even less power at 89W.
If power savings is the only thing on your mind, the Gigabyte card takes the crown among RX 5500 XT’s. Overall, however, Nvidia's 12nm Turing architecture is typically more efficient at this performance level.
The Furmark chart shows the the cards evening out, with the Asus and Sapphire cards at 133W while the ASRock and Gigabyte cards averaged 129W and 122W, respectively. Power use went up but clock speeds (and voltage) dropped to fit within each card’s power limits. The GTX 1650 Super went up a couple Watts to 99W, still using less power than the Navi 14 based RX 5500 XT cards.
Temperatures, Fan Speeds and Clock Rates
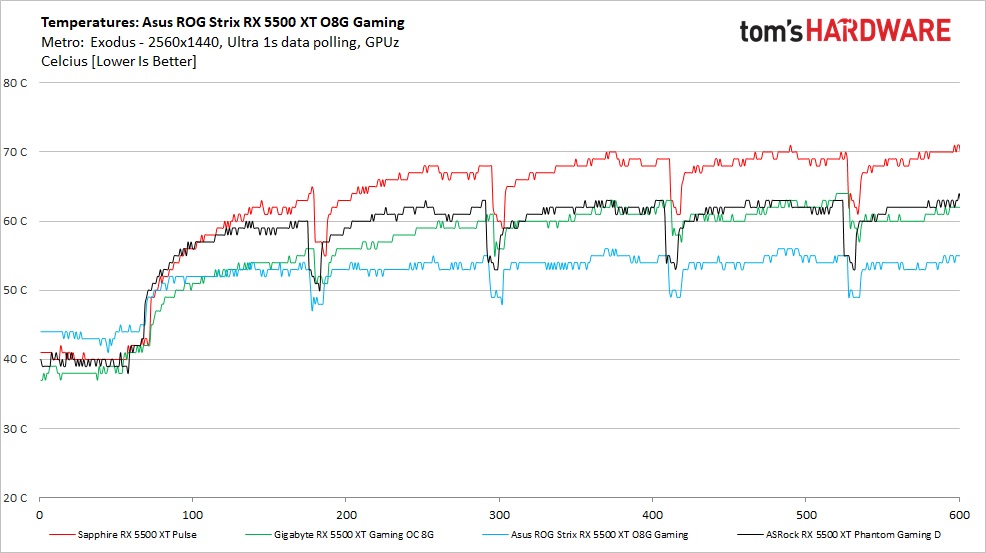
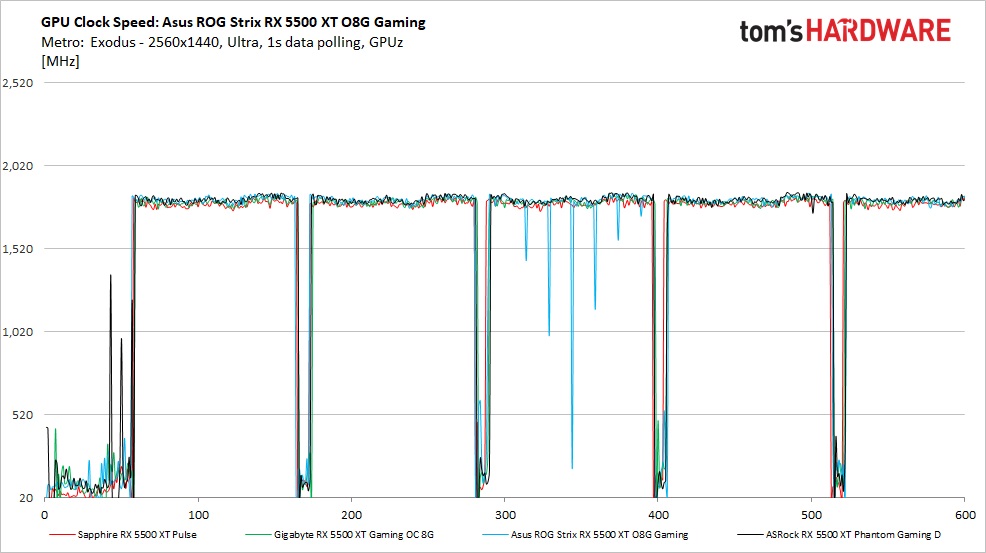
To see how each video card behaves with temperatures, fan speeds and clock rates, we use GPU-Z logging in one-second intervals to capture data. Unlike power, the data from GPU-Z is component agnostic. These items are captured by looping the Metro Exodus benchmark five times, running at 2560x1440 and ultra settings.
Get Tom's Hardware's best news and in-depth reviews, straight to your inbox.
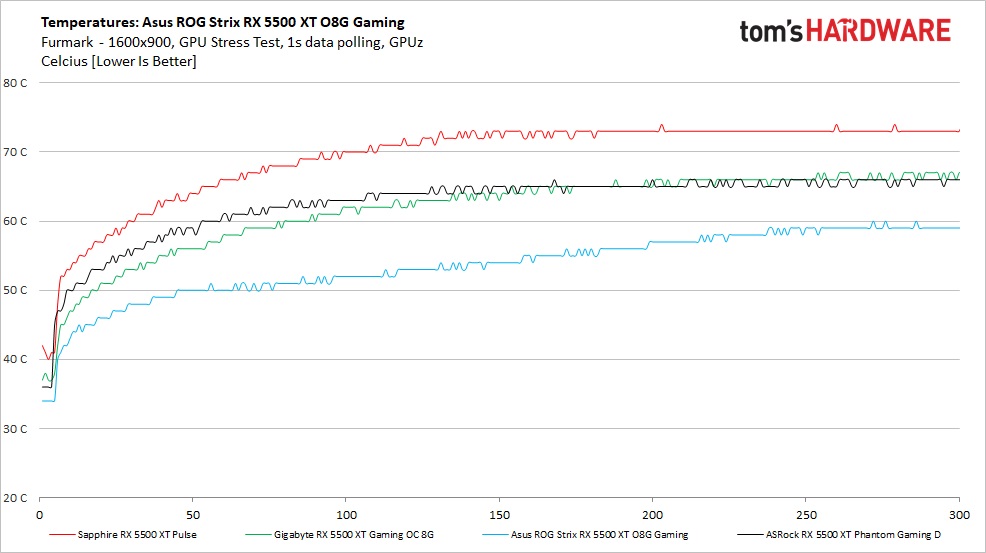
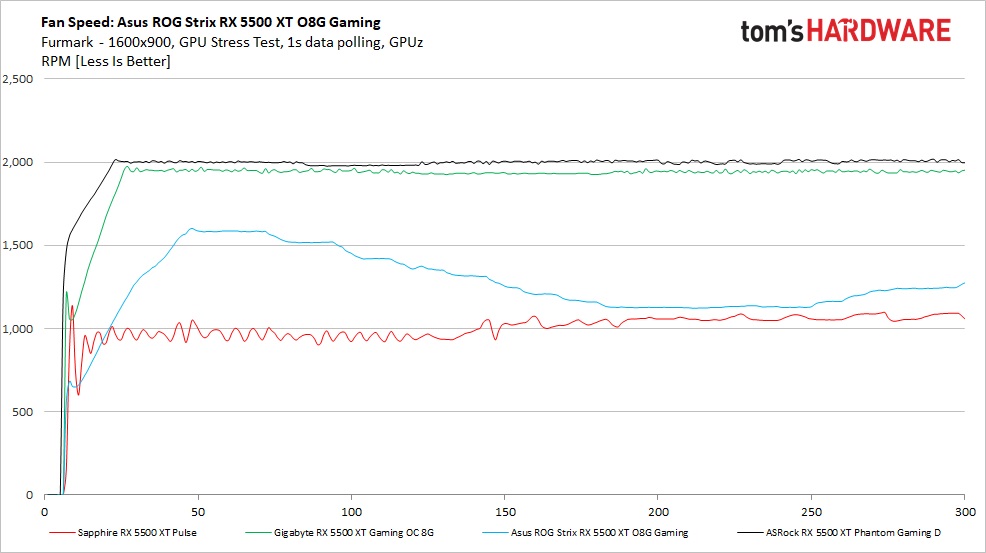
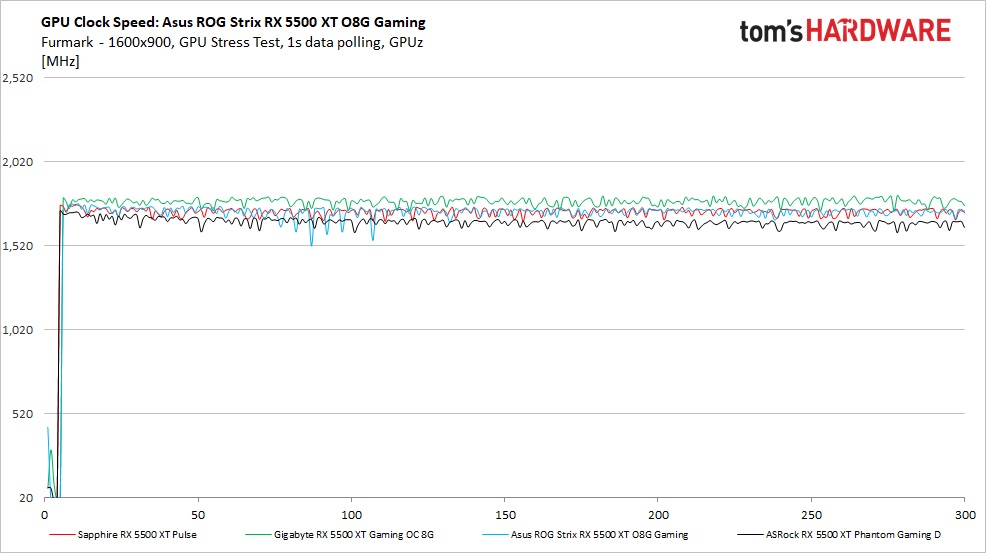
Additionally, we also use FurMark to capture the data below, which offers a more consistent load and uses slightly more power, regardless of the fact that the clock speeds and voltages are limited. These data sets give insight into worst-case situations along with a non-gaming workload.
Gaming
Temperatures for the Asus card averaged 54 degrees Celsius during gaming testing, the lowest (by far) of all the cards we've tested so far. The large heatsink and dual-fan cooling solution are the best we’ve seen. Even the Gigabyte Gaming OC card, with its lower power draw, still ran warmer than the Asus. The beefy 2.9-slot cooler has done its job with aplomb.
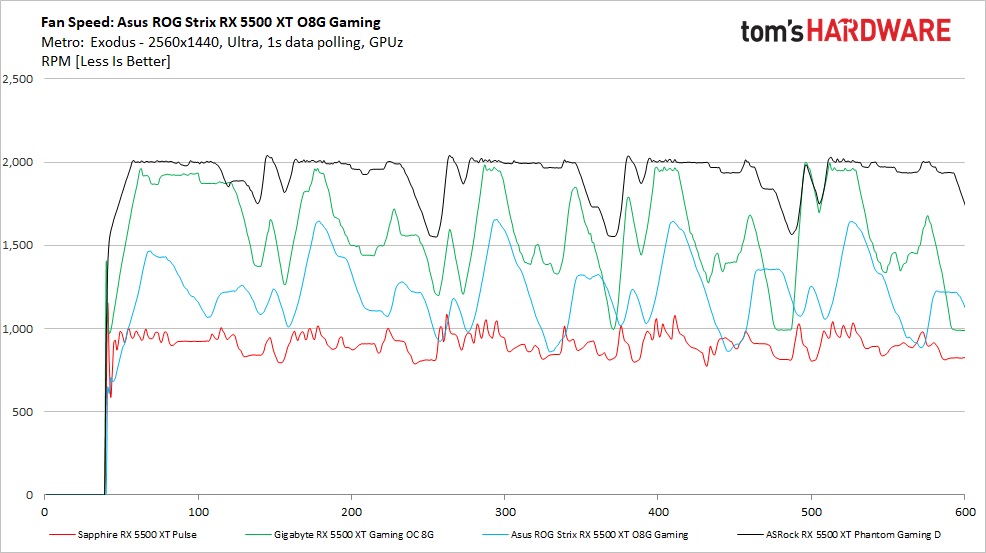
Fan speeds during the Metro Exodus testing show all cards except for the Sapphire Pulse have wildly varying fan speeds. The Asus ROG Strix varied from about 1,000 RPM peaking over 1,600 RPM. The good news is these speed differences, while noticeable, weren't distracting. It’s also worth noting that during normal gaming, we won’t see the large variances RX 5500 XT cards have shown.
Clock speeds on the Asus ROG Strix averaged 1,816 MHz during the last part of the gaming test. This result is over 20 MHz faster than the Sapphire Pulse (1,794 MHz), 10 MHz over the Gigabyte Gaming OC (1,806 MHz) and two MHz slower than the ASRock Phantom Gaming (1,818 MHz). While core clocks all ended up similar, one takeaway from this chart shows just how much the 4GB memory affects the Sapphire Pulse.
FurMark
Temperatures in Furmark were a couple degrees Celsius warmer than game testing across all cards. Again, the Asus ROG Strix ran the coolest peaking at 60 degrees Celsius, while the Gigabyte Gaming OC and ASRock Phantom Gaming D peaked around 67 degrees Celsius. The slower Sapphire card with its smaller heatsink ran the warmest, peaking at 74 degrees Celsius. All of these results are still well within the acceptable range.
Fan speeds during Furmark testing are much more stable for all cards. The Asus ROG Strix slowly ramped up to a peak speed of just over 1,600 RPM. From there it slowed down as the card figured out the clock speed and voltage needed to fit within the power limits.
Checking clock speeds during Furmark, the Asus O8G Gaming averaged 1,722 MHz in this brutal stress test. This clock speed is almost 100 MHz below the gaming clock speed average, about the same as the Sapphire Pulse, but less than the Gigabyte Gaming OC (1,764 MHz).
MORE: Best Graphics Cards
MORE: Desktop GPU Performance Hierarchy Table
MORE: All Graphics Content
Current page: Power Consumption, Fan Speeds, Clock Rates and Temperature
Prev Page Performance Results: 1920 x 1080 (Medium) Next Page Software: GPU Tweak
Joe Shields is a staff writer at Tom’s Hardware. He reviews motherboards and PC components.
-
King_V Is it weird that we're getting to a place where, with both Nvidia and AMD, that the low-end cards are starting to draw the same or slightly more power than the cards in the next tier up?Reply -
larkspur ReplyThe GTX 1650 Super is around 3% slower
For $230 it's only ~3% faster than a ~$160 1650 Super...
and close to 7% slower than the comparably priced Zotac GTX 1660 Amp
You can actually get a 1660 Super for the same price as this card, lol. Excuse my personification of Captain Obvious but unless there is a significant price drop I'd strongly recommend not buying this card! -
King_V Just did a quick check on PCPartPicker.com, and least expensive of:Reply
4GB RX 5500 XT models start at $163.98
8GB RX 5500 XT models start at $183.98
1650 Super is $159.99 (Zotac Twin fan, though the next two at $164 and $165 are single-fan models)
1660 is $179.99 (admittedly, a single-fan EVGA model)
1660 Super is $225.99 (and 4 other models are $229.99)Honestly, that particular EVGA 1660 makes just about any 1650 Super or RX 5500 XT a really tough sell.
We live in weird times when it comes to budget level GPUs. -
JarredWaltonGPU Reply
Seriously, the new budget GPUs are very hard to recommend on any level right now. 1660 / 1660 Super and the old RX 570 / 580 make for weird rankings.King_V said:Just did a quick check on PCPartPicker.com, and least expensive of:
4GB RX 5500 XT models start at $163.98
8GB RX 5500 XT models start at $183.98
1650 Super is $159.99 (Zotac Twin fan, though the next two at $164 and $165 are single-fan models)
1660 is $179.99 (admittedly, a single-fan EVGA model)
1660 Super is $225.99 (and 4 other models are $229.99)Honestly, that particular EVGA 1660 makes just about any 1650 Super or RX 5500 XT a really tough sell.
We live in weird times when it comes to budget level GPUs. -
King_V ReplyJarredWaltonGPU said:Seriously, the new budget GPUs are very hard to recommend on any level right now. 1660 / 1660 Super and the old RX 570 / 580 make for weird rankings.
Especially given some of the price dips we see in the RX 570, and more recently the RX 580 (that Gigabyte deal for $134.99 was nuts!) -
larkspur Reply
Yes I got that RX 580 8gb from Newegg's Ebay store (thanks again Avram!) for $139 including tax shipped (ebay very nicely had a $5 off coupon). I was in the sub-$180 market and wasn't fully sold on a 1650 super. Very happy with the card.King_V said:Especially given some of the price dips we see in the RX 570, and more recently the RX 580 (that Gigabyte deal for $134.99 was nuts!) -
King_V Reply
I'd missed it . . and did NOT NEED IT, but, if it hadn't sold out by the time I saw the offer, I would've been hard pressed to resist. That whole "well, I did have a budget machine idea in mind that I totally don't need anyway..." kind of thing.larkspur said:Yes I got that RX 580 8gb from Newegg's Ebay store (thanks again Avram!) for $139 including tax shipped (ebay very nicely had a $5 off coupon). I was in the sub-$180 market and wasn't fully sold on a 1650 super. Very happy with the card. -
dawgfan6 Reply
I agree, although based on past experience of AMD cards gradually gaining performance on competing nvidia cards with driver updates, etc, I wouldn't be surprised if the 5500XT 8gb gradually gains on and passes the GTX 1660, and eventually becomes competitive with the GTX 1660 super.King_V said:Just did a quick check on PCPartPicker.com, and least expensive of:
4GB RX 5500 XT models start at $163.98
8GB RX 5500 XT models start at $183.98
1650 Super is $159.99 (Zotac Twin fan, though the next two at $164 and $165 are single-fan models)
1660 is $179.99 (admittedly, a single-fan EVGA model)
1660 Super is $225.99 (and 4 other models are $229.99)Honestly, that particular EVGA 1660 makes just about any 1650 Super or RX 5500 XT a really tough sell.
We live in weird times when it comes to budget level GPUs.
The GTX1060 was once 5% or so faster than the RX480/580, but now it's 4-5% slower. Even since the launch of the 5500XT, it seems like it's benchmarks have slowly crept up on the RX590 and GTX1660. It's a bit of a hard sell at MSRP, but $179 for an 8GB 5500XT would be pretty competitive. -
JarredWaltonGPU Reply
This is one of those conspiracy theories that I've never seen 'proven' to any reasonable degree. I just did a bunch of retesting for the updated GPU hierarchy. The RX 580 8GB is about 7% faster than a GTX 1060 6GB (though that's using a factory OC 580 against a reference 1060 6GB). Digging back into my old articles, I find this:dawgfan6 said:I agree, although based on past experience of AMD cards gradually gaining performance on competing nvidia cards with driver updates, etc, I wouldn't be surprised if the 5500XT 8gb gradually gains on and passes the GTX 1660, and eventually becomes competitive with the GTX 1660 super.
The GTX1060 was once 5% or so faster than the RX480/580, but now it's 4-5% slower. Even since the launch of the 5500XT, it seems like it's benchmarks have slowly crept up on the RX590 and GTX1660. It's a bit of a hard sell at MSRP, but $179 for an 8GB 5500XT would be pretty competitive.
https://www.pcgamer.com/radeon-rx-580-review/
In that review, the 580 and 1060 were tied at 1080p ultra, 580 was 1% faster at 1080p medium, tied at 1440p ultra, and 580 was 2% faster at 4K ultra. That was with both cards being factory overclocked, though -- which is usually about a 5% difference. So, three years later, the overall rating of the two GPUs appears to still be within 2%.
I can point to things that have gone the other way as well. 570 4GB vs. 1060 3GB, here's the RX 590 review. GTX 1060 3GB was 11% faster at 1080p medium, 3% faster at 1080p ultra, 2% slower at 1440p ultra, and 15% slower at 4K ultra. My latest data (albeit with different games): 1060 3GB is 10% faster overall, including 4K results. Or if you want, 9% faster at 1080p medium, 8% faster at 1080p ultra, 9% faster at 1440p ultra, and 10% faster at 4K ultra. So the AMD GPU got comparatively worse at ultra settings, despite having 33% more VRAM.
Overall, though, nearly all of the data I've accumulated suggests that the long-term change in performance from both companies, after driver and game updates, is less than 5% -- and probably less than 3%. Individual cases vary, but if you look at a larger swath of games and settings things are pretty consistent. -
larkspur Reply
Very interesting, thank you. I'm guessing this theory goes back to the HD 7970 and 670/680/760/770 days? I seem to recall the early GCN chips having some significant driver-related performance improvements, no? I read your old RX 580 review... takeaway:JarredWaltonGPU said:Overall, though, nearly all of the data I've accumulated suggests that the long-term change in performance from both companies, after driver and game updates, is less than 5% -- and probably less than 3%. Individual cases vary, but if you look at a larger swath of games and settings things are pretty consistent.
Jarred doesn't play games, he runs benchmarks. If you want to know about the inner workings of CPUs, GPUs, or SSDs, he's your man. He subsists off a steady diet of crunchy silicon chips and may actually be a robot.
LOL! :ROFLMAO:
