Get Maximum Fortnite Performance: 'Epic' Mode With 10 Graphics Cards
How We Tested
How big a sensation is Fortnite at the moment? It's addicting the NBA. It's setting records for concurrent numbers of players. It's making our colleagues lose more sleep than they'd likely care to admit. (Wake up, buddy.)
Understatement of the year: Fortnite has enjoyed a whole lot of success since Epic Games added a free-to-play Battle Royale mode last September, building on the already available Save the World mode (PvE). (For more on Fortnite: Battle Royale, see this primer on sister site Tom's Guide.)
The game is available on the Sony PlayStation 4, Microsoft Xbox One, Windows, and macOS platforms. It leverages the Unreal Engine 4, and it is DirectX 11-compatible (Metal, if you're on macOS). And indeed, on the PC side of things, it's designed to run even on low-end hardware. Sister site Laptop did a keen analysis of how to play Fortnite on the integrated graphics chips that are common fare in most non-gaming-minded laptops and low-end desktop PCs.
Check out that story, if your intention is to play Fortnite on hardware like that. Under those circumstances, it becomes a balancing act of tweaking settings and resolutions. Our intention here, instead, is to see how Fortnite plays on a mainstream PC with a variety of dedicated graphics solutions, and what it takes to run the game at maximum settings, which in the case of Fortnite is known as "Epic."
The Benchmark Sequence
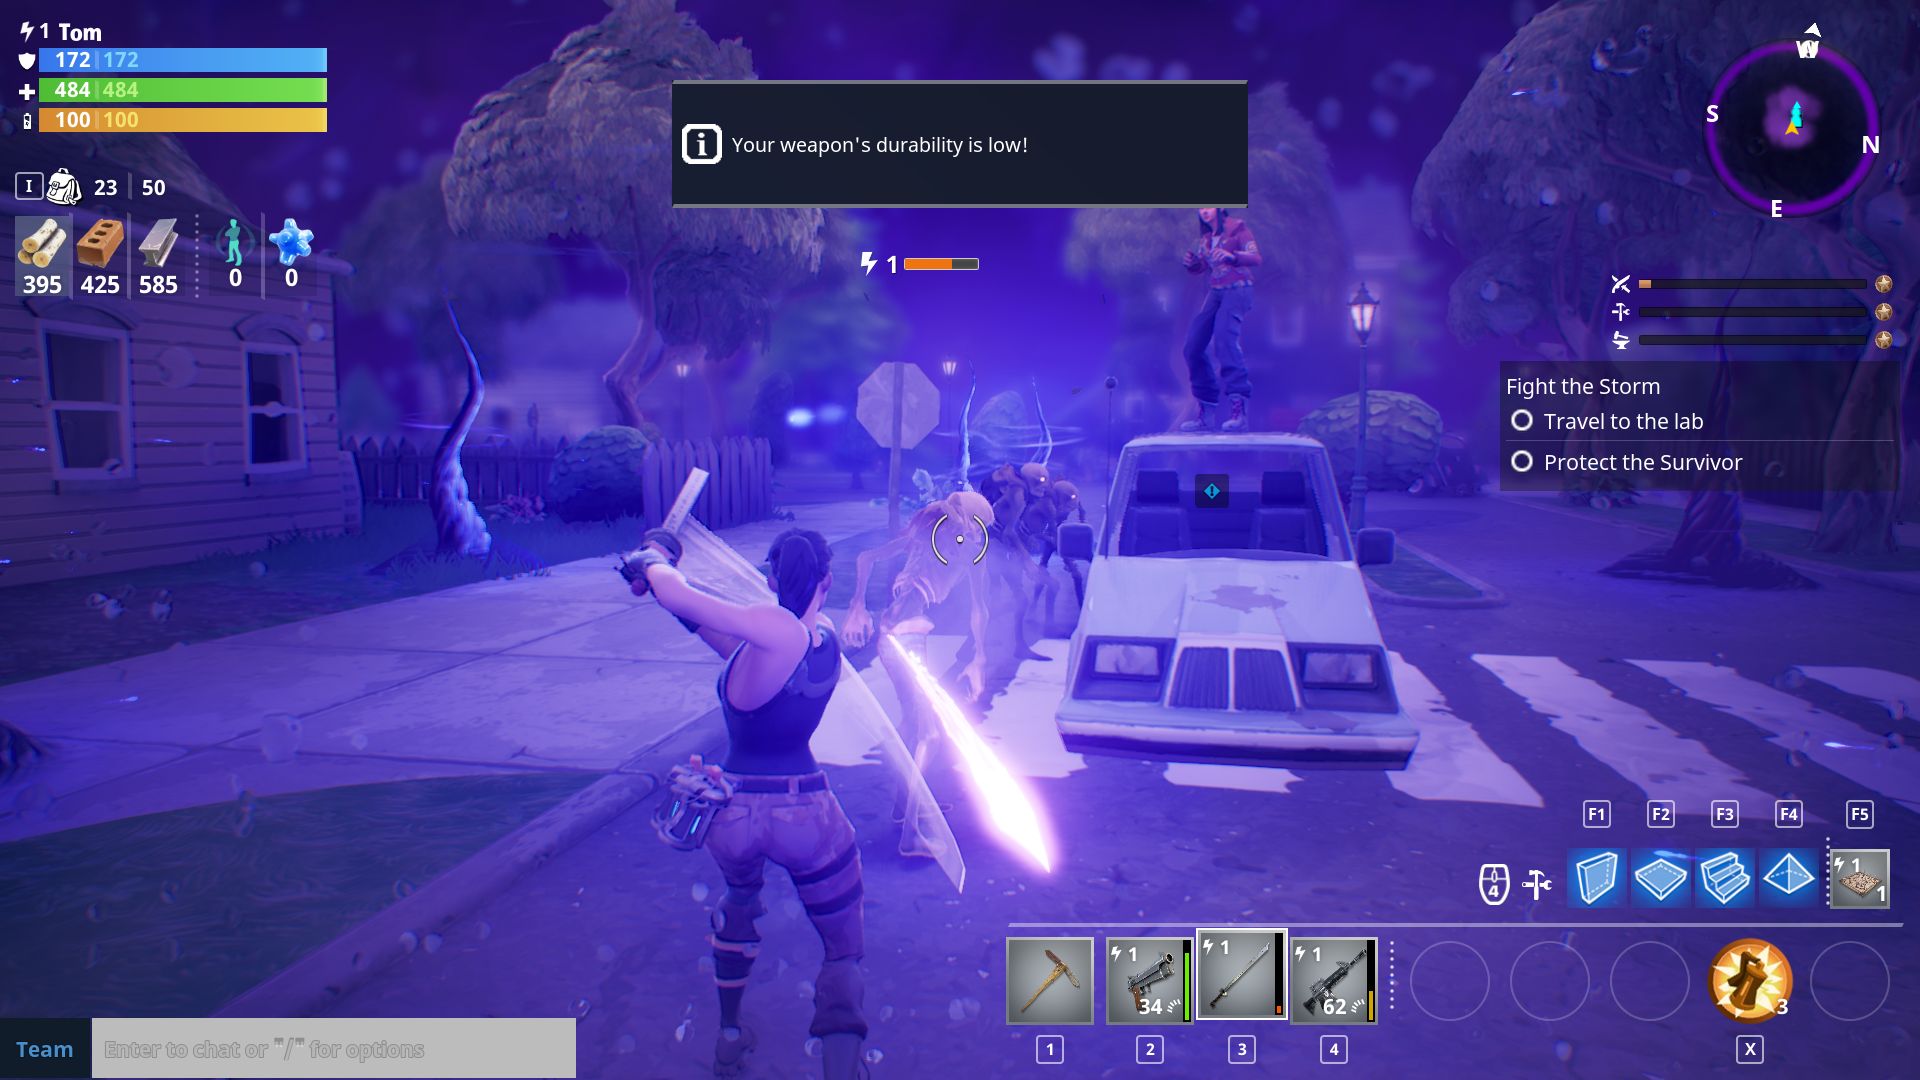
The trick to testing Fortnite on any kind of hardware is settling on a test sequence that will generate meaningful, repeatable results. It is always tough to choose a sequence for games that don't include an integrated benchmarking routine. For the purposes of our performance analysis, this time around we created an easily reproducible walk-through within the mission “Before and After Science,” found in Save the World mode. A recording of the exact sequence is shown below...
Minimum & Recommended System Requirements
Fortnite's minimum and recommended system configurations are available directly from Epic's webpage. Whether you're talking about host processing, system memory, or graphics horsepower, Fortnite doesn't seem particularly demanding. Of course, it remains to be seen if our mainstream gaming PC is enough to enable the Epic quality preset at 1920x1080...
| CONFIGURATION | MINIMUM | RECOMMENDED |
|---|---|---|
| Processor | Intel Core i3 (2.4GHz) | Intel Core i5 (2.8GHz) |
| Memory | 4GB | 8GB |
| Graphics | Intel HD Graphics 4000 | Nvidia GeForce GTX 660AMD Radeon HD 7870 |
| Operating System | Windows 7, 8.1, or 10 (64-bit) | Windows 7, 8.1, or 10 (64-bit) |
| Disk Space | - | - |
Test Configuration
| System Configuration | |
| Operating System | Windows 10 x64 Pro 1709 (16299.248) |
| Graphics Drivers | The game was tested using the latest public drivers available at the time we ran our benchmarks:Nvidia GeForce Game Ready 391.24AMD Radeon Adrenalin Edition 18.3.3 |
| Game Version | The most up-to-date version of the game was tested at the time we ran our benchmarks:Fortnite v3.3 (3948073) |
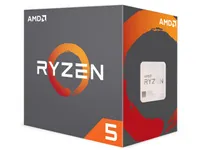
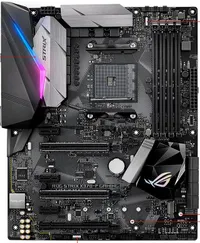
We recently updated our test configuration to better reflect the state of mid-range PC gaming on a desktop in 2018. This time around, we picked an AMD Ryzen-based platform, focusing specifically on the Ryzen 5 1600X as a great CPU compromise option for enthusiasts looking to save some money.
Get Tom's Hardware's best news and in-depth reviews, straight to your inbox.
Steam's survey of hardware and software configurations offers us a view of the most prevalent components and settings (the data comes from February 2018):
- 8GB of RAM is the memory level in 45% of gaming PCs. Our system has 16GB, similar to almost 40% of surveyed gamers.
- Full HD resolution is used by 76% of gamers, while 8% are still running at 1366x768. QHD is the resolution of choice of only 3.4% of respondents, while 4K remains a small enough percentage of adoption to remain anecdotal. We will test at 1440p in addition to the classic Full HD.
- Quad-core CPUs are installed in more than two-thirds of surveyed systems (72% to be exact). In anticipation of CPU trends in coming months, we're using a mid-range six-core processor.
Graphics Card Selection
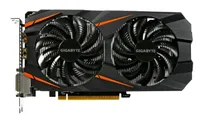
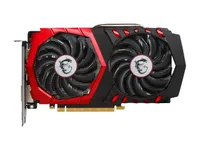
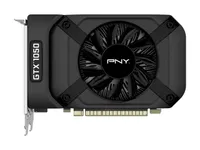
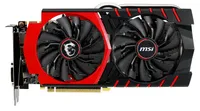
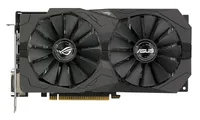
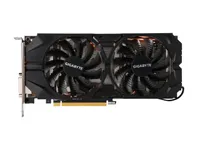
We chose 10 representative graphics cards for this test, mainly entry-level and mainstream options. Here are the competing boards:
Test Procedure
All performance data is collected using the PresentMon tool and our own custom front end.
To represent performance accurately, each graphics card is warmed up to a stable temperature before measurements are collected. Most newer GPUs employ mechanisms to optimize clock rates based on variables such as power consumption and temperature. As a result, tests run during the warm-up period would convey better performance than you'd see in the real world. We therefore execute the benchmark sequence one time to warm up the card, prior to gathering official data. For graphics settings, we tested the game at Full HD and QHD resolutions, with the maximum settings (Epic preset) and with the Show Grass setting turned on.
MORE: Final Fantasy XV Performance Review
MORE: Project CARS 2 Performance Review
MORE: Star Wars Battlefront II Performance Review
-
Gillerer I have a couple of suggestion to improve the readability of the CPU load chart - and make it more informative:Reply
*
1) Analyze the CPU thread loads in descending order:
■Record loads per CPU thread for each point in time.
■For each data point, assign the loads to graphs called "Highest loaded thread", "2nd highest", "3rd highest", ..., "Nth highest". (The spreadsheet function LARGE is your friend here.)
■Display these as you do now - only now the top bar displays how the highest loaded CPU thread - whatever thread it happened to be at the time - was doing throughout the entire test.
I think this display would be better than the current one, because you could see the performance profile at a glance: the colors would shift from highly loaded at the top to slightly loaded at the bottom. E.g. you could easily see how much of the time 4 or more threads were highly loaded *at the same time*. The current graph doesn't show this definitely, since the high loads on the two threads may have occurred at different times in the test.
*
2) Change the value groups of the CPU load: 86% to 100% is much too wide of a gap. I'd like there to be a "fully loaded" group of 99 - 100% (maybe 98 - 100%, or 98.5 - 100%, depending on the precision of the data recording). I feel this is very important, since it would indicate an almost certain CPU bottleneck. -
Ninjawithagun WOW! I'm impressed by the fact that the GTX970 can still hang in there with playable frame rates at 1440P :DReply -
Jamie_69 well, that's unequivocally false, but don't let that stop you posting nonsense - I'm sure it won'tReply
edit for context- the post i was replying to was a now deleted angry rant -
alextheblue ReplyUnreal Engine 4 does seem capable of exploiting the Ryzen CPU's resources, just not in a perfectly homogeneous fashion.
Maybe some other UE4 game. Unless by "not in a perfectly homogeneous fashion" you actually meant "unevenly taxes CPU cores and manages to use perhaps 50% of available horsepower under the very best of circumstances, using a mid-tier chip paired with a top-end GPU at settings geared for extremely high framerates".
Fortnite is deliberately built to NOT be CPU intensive so that it can run on a wide range of systems. You turn down the eye candy until your graphics can handle it, and your CPU is not a big concern. -
mario.abarth89 Damn, from the title i hoped you took a mining mainboard and somehow made it work with all 10 at the same time :(Reply -
jpe1701 Reply20862675 said:I have a couple of suggestion to improve the readability of the CPU load chart - and make it more informative:
*
1) Analyze the CPU thread loads in descending order:
■Record loads per CPU thread for each point in time.
■For each data point, assign the loads to graphs called "Highest loaded thread", "2nd highest", "3rd highest", ..., "Nth highest". (The spreadsheet function LARGE is your friend here.)
■Display these as you do now - only now the top bar displays how the highest loaded CPU thread - whatever thread it happened to be at the time - was doing throughout the entire test.
I think this display would be better than the current one, because you could see the performance profile at a glance: the colors would shift from highly loaded at the top to slightly loaded at the bottom. E.g. you could easily see how much of the time 4 or more threads were highly loaded *at the same time*. The current graph doesn't show this definitely, since the high loads on the two threads may have occurred at different times in the test.
*
2) Change the value groups of the CPU load: 86% to 100% is much too wide of a gap. I'd like there to be a "fully loaded" group of 99 - 100% (maybe 98 - 100%, or 98.5 - 100%, depending on the precision of the data recording). I feel this is very important, since it would indicate an almost certain CPU bottleneck.
I second a change with the load charts. Maybe I am just slow but I have a hard time reading them.
-
buzznut47 The graphics are pretty weak considering how much hardware processing power is required. Cartoonish really. I doubt that has much to do with Unreal Engine 4.Reply
Also the recommended specs from the game devs seem really underpowered. Would have liked to see just how low the settings would have to be under those conditions. -
interspool How were you able to set core affinities in the first place? It looks as though they've patched the game and it won't allow users to set affinity in Windows 10 or Process Lasso for the Fortnite exe. I want to lock the game to 4 cores, and use my other 4 cores for streaming. Someone please help!Reply


